


 Figure 1


« Prev Next »
Let's play the most boring card game in the universe! Here are the rules. We start with a fully sorted deck of 52 cards, and we deal out four hands. We don't deal in the ordinary way, though—instead, we give the top 13 cards to the first player, then the next 13 to the second player, and so forth. Hand 1 shows what each player's hand will look like.

Hand 1
Now, imagine that this process is repeated millions of times, always
yielding the same four hands of cards. What is the point of this
exercise?
An Analogy for Gene Distribution
In this case, the card game is an analogy. Think of the deck of cards as a genome, with each card representing a single gene and each hand representing a chromosome; thus, in this example, we're looking at an organism with 52 genes distributed among four chromosomes. The pattern of dealing in this analogy is representative of mitosis—here, each deal (cell division) involves a precise, repetitive set of mechanical operations that ensures that the same cards (genes) get distributed to each player (daughter cell). The rules guarantee that the same hands (sets of genetic information) will be preserved in each successive round of the game (generation of cells).
However, this situation leads to an interesting question of logic. What happens if the dealer and the hands are imperfect, and a mistake occasionally occurs? Say that every once in a while, the hands are dealt and the card distribution is slightly different. For instance, assume you see the results in hand 3. (Hint: Look carefully at the cards in hand 3.) Here, you didn't get to see the event that led to the change; rather, you are only able to observe the result. How, then, could you explain what happened in the prior round in the simplest way possible?
To describe what happened, you might say that it looks like some of the cards in hand 3 (specifically, the 5, 6, 7, and 8 of diamonds) were reversed in order. That's all—it's a simple change that can be logically deduced from the observed outcome. Note also that from this point forward, every round dealt from this deck will propagate this new arrangement—we will always have this inversion in hand 3, unless another accident rearranges them again. (In keeping with the analogy, this rearrangement can be thought of as a chromosomal inversion, in which small blocks of genes get flipped around.)

Hand 3
Now, imagine that we deal a few hundred thousand more hands, all of which look the same, and then we notice something new. What might be the simplest explanation for the results depicted in hand 4?

In hand 4, it appears that the last five cards that were dealt to hand 2 were swapped with the last five cards in hand 3. Once again, there is an analogous process in genetics—it's called a reciprocal translocation.
Hand 4
To make this game more difficult, you could have been asked to compare the last set of hands with the first, without receiving any information about the intermediate inversion error. Despite this omission of information, you still would have been able to figure out the simplest explanation for this result: that there was an inversion and then a translocation, in that order. Based on this explanation, you then would have been able to puzzle out the series of slow, small accidents that generated the final card arrangement. (Of course, this won't always be true—some combinations of rearrangements will be ambiguous, so you will only be able to approximate what happened.)
This game could be complicated still further. After all, here are plenty of other genetic operations that could be added. For instance, two hands could be fused together, or we could split one hand so that a total of five (rather than four) hands are dealt during each round. We could also add duplications—maybe one of the players has an ace of hearts up his sleeve, and he slips it into the deck. Deletions are also possible—perhaps someone tosses out the 2 of spades. The important thing is that these little distortions happen relatively rarely, leading to a slow rearrangement of the cards in the deck. There is nothing like a series of shuffles that scramble all of the cards at once.
Mapping Genetic Synteny
This particular game is one that is played in comparative genomics all the time, only the magnitude of complexity is much, much greater. When discussing comparative genomics, we're now dealing with tens of thousands of "cards" in the "deck," slowly rearranged in a series of "rounds" that have been played over hundreds of millions of years. Indeed, the only thing that makes it possible to play this game is that the changes have been relatively slow—in other words, not every generation and not every speciation event has been accompanied by an error. In addition, in whatever game the real species are playing, some arrangements of cards are advantageous and therefore conserved. Obviously, the game is now so difficult that not every rearrangement can be figured out, so what we often settle for is mapping synteny.
But what is synteny? In classical genetics, syntenic genes were originally defined as genes that lie on the same chromosome. Today, however, biologists usually refer to synteny as the conservation of blocks of order within two sets of chromosomes that are being compared with each other.

Hand 5
Let's look at our original set of hands, and then compare this set to the one that was produced by an inversion and a translocation as a simple example. Hand 5 shows the original set of hands with a little color coding added to mark the clusters of cards. Let's call each set of cards a species, as a simple label. Hand 6 shows them lightly scrambled around.

Hand 6
Real genes are not nicely labeled with suit markings to make it easy to see how they are related, but what we see here in the background colors are blocks of conserved order. Those blocks are regions of synteny. For instance, the region in hand 2 of species 2 that contains the 7, 8, 4, 3, and 2 of diamonds corresponds coarsely to a region of hand 3 in species 1—it's not perfect, because it's missing the 5 and 6 of diamonds, and the 7 and 8 are reversed, but we can at least say there's a kind of macrosynteny at play here, a larger block of rough correspondence with a whole chromosome. Within that syntenic region, there is some local scrambling, so if we wanted to go into more detail, we could say that the 7 and 8 of diamonds in hand 2 preserve the microsyntenic order of a piece of hand 3 in species 1, and the 4, 3, and 2 of diamonds in hand 2 are another microsyntenic region conserved from hand 3 of species 1.
This is a simple example. In the real world of comparative genomics, there are much more elaborately scrambled examples, and researchers don't get to see the ancestral species. Rather, they have two independently evolved species, and they have to puzzle out the minimal set of separate operations that would generate the two products. Next, the researchers must infer the ancestral chromosomal arrangement from this set of operations. Computers are essential for working out the possible permutations.
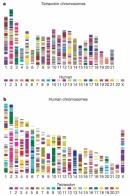
Papers that describe synteny between two species often do exactly what was illustrated above: They color code the chromosomes from one species, and then map those regions of color onto the chromosomes of the other species. Figure 1 shows an example comparing the chromosomes of pufferfish and humans (Jaillon et al., 2004; Mulley & Holland, 2004). Note that there is a key at the bottom of Figure 1; in this case, the authors of the study color coded the 21 chromosomes of the pufferfish Tetraodon—all of the genes on chromosome 1 are colored dark purple, for instance, and all of the genes on chromosome 9 are light blue. Then, wherever a block of human genes with a sequence and order similar to a block of genes in chromosome 1 of Tetraodon were found, the authors colored that portion of the human chromosome dark purple. So, for instance, we find bits of Tetraodon chromosome 1 scattered throughout human chromosomes 1, 2, 3, 14, and so forth; similarly, Tetraodon chromosome 9 has been broken apart and sprinkled throughout human chromosomes 1, 2, and (largely) 6. By comparing these shattered scraps of chromosomes and assuming the minimal set of operations that must have occurred to create these rearrangements, researchers can deduce the organization of the chromosome set of the most recent common ancestor of both Tetraodon and humans.
Using synteny mapping to trace evolutionary history is a combination of molecular archaeology and an elaborate logic game. It's an approach that has considerable power to let us look back into the genetic state of long-extinct organisms that have not left us their actual, intact DNA, but only the somewhat scrambled strands of their descendant's chromosomes.
References and Recommended Reading
Jaillon, O., et al. Genome duplication in the teleost fish Tetraodon nigroviridis reveals the early vertebrate proto-karyotype. Nature 431, 946–957 (2004) doi:10.1038/nature03025 (link to article)
Mulley, J., & Holland, P. Comparative genomics: Small genome, big insights. Nature 431, 916–917 (2004) doi:10.1038/431916a (link to article)


