


 Figure 1
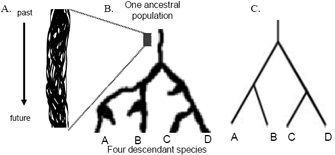


« Prev Next »
A phylogenetic tree, also known as a phylogeny, is a diagram that depicts the lines of evolutionary descent of different species, organisms, or genes from a common ancestor. Phylogenies are useful for organizing knowledge of biological diversity, for structuring classifications, and for providing insight into events that occurred during evolution. Furthermore, because these trees show descent from a common ancestor, and because much of the strongest evidence for evolution comes in the form of common ancestry, one must understand phylogenies in order to fully appreciate the overwhelming evidence supporting the theory of evolution.
Tree diagrams have been used in evolutionary biology since the time of Charles Darwin. Therefore, one might assume that, by now, most scientists would be exceedingly comfortable with "tree thinking"--reading and interpreting phylogenies. However, it turns out that the tree model of evolution is somewhat counterintuitive and easily misunderstood. This may be the reason why biologists have only in the last few decades come to develop a rigorous understanding of phylogenetic trees. This understanding allows present-day researchers to use phylogenies to visualize evolution, organize their knowledge of biodiversity, and structure and guide ongoing evolutionary research.
But what exactly is a phylogeny? Moreover, how should one read and interpret one of these diagrams? In an attempt to answer such questions, the following sections present a brief introduction to tree thinking. A more complete view of this subject can be developed by learning about how traits evolve along trees, how trees are reconstructed, and how trees are used to study various aspects of evolution.
What an Evolutionary Tree Represents
To better understand what a phylogeny represents, start by imagining one generation of butterflies of a particular species living the same area and producing offspring. If you focus on four individual butterflies in both the parental and offspring generations, the resulting pedigree may appear like the one in Figure 1B.
Now, expand your image to encompass all the butterflies of this species in a particular meadow over several generations. A pedigree for this population might look something like the one in Figure 1C. Note that each individual in the figure has two parents, but each gives rise to a variable number of offspring in the next generation.
Next, imagine taking your pedigree and getting rid of the organisms, thus keeping only the descent relationships, which are the glue that holds the population together (Figure 1D inset box). Then zoom out even farther to include many more individuals (say, from multiple meadows in the same region) and more generations. For example, the whole of Figure 1D is derived from a similar diagram as the inset box, but it now includes more individuals and many generations. As you can see, if one were to try to represent a typical population of several thousand individuals that persists for hundreds or thousands of generations, all one would see would be a fuzzy line.
Individual populations may be fairly isolated for some period of time. However, on an evolutionary timescale, migration will occur among the discrete populations that make up a typical species. This gene flow between populations has the effect of "braiding" the population lineages into a single species lineage, which might be thought of as resembling Figure 1E.
Moreover, during evolution, lineages often split. This occurs when populations or groups of populations become genetically isolated from one another. Lineages most commonly split because of the migration of a few individuals to a new, isolated region (e.g., an island). This is sometimes called a founder event. Alternatively, a formerly contiguous range can be broken up by geological or climatic events (e.g., the creation of mountains, rivers, or patches of inhospitable terrain). This phenomenon is called vicariance. No matter whether populations split due to founder events or vicariance, if the isolated populations remain separate, they will start evolving differences from one another (Figure 1F). After all, a mutation that arises in one population will have no way to get to the other population. Thus, even a mutation that would be selectively favored in both populations will become fixed in only one of the groups.
As a consequence of this genetic isolation, the lineages will evolve separately, becoming more and more different over time. If they remain apart for long periods, enough physiological and behavioral differences may evolve to result in reproductive isolation, such that it will be impossible for individuals from the two lineages to reproduce even in the case that they do come back into contact. Because of this, it is a useful simplification to assume that once lineages diverge, the two sets of descendants will remain distinct.
Figure 2B shows what we might see if we followed the fate of a single ancestral lineage (Figure 2A) long enough that it gave rise to four descendant lineages (species). This example includes three lineages that were established but became extinct before the end of the observation period. This diagram is an example of a simple phylogenetic tree.
In most cases, researchers draw phylogenetic trees in such a way as to record only those events that are relevant to a set of living taxa. Most commonly, these taxa are species. For example, Figure 2C shows the basic tree we could draw to represent the history of the four "tip" species, A through D. This tree shows that species A and B share a more recent common ancestor with each other than with either species C or species D. Likewise, species C and D share a more recent common ancestor with each other than with either species A or species B. This example illustrates the fact that a phylogeny is, at its most basic level, a history of descent from common ancestry.
Phylogenetic trees are fractal in the sense that the same pattern is found whether we consider recently diverged lineages or deep splits in the tree of life. Indeed, the most basic postulate of evolutionary theory is that the same general phenomenon of descent from common ancestry applies to both the most diverse branches of the tree of life and the most similar. As a result, the tree structure is extremely helpful in tracking biological diversity at all levels.
The Lexicon of Phylogenetic Inference
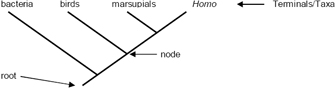
Most phylogenetic trees are rooted, meaning that one branch (which is usually unlabeled) corresponds to the common ancestor of all the species included in the tree. Note, however, that a tree can be drawn in any orientation. Figure 3, for example, shows a simple rooted tree with the root at the bottom and the tips at the top.
The labels at the "tips" of a phylogeny can correspond to individual organisms, to species, or to sets of species, as long as each tip makes up a separate branch on the tree of life. In fact, in certain contexts, the tips can even correspond to individual genes. In any case, some general terms for the items represented by these tips include "terminals," "terminal taxa," or "taxa"; in more mathematical circles, they may also be called "leaves." As opposed to tips, the branching points within a tree, which correspond to inferred speciation events, are called nodes. Each node represents the last common ancestor of the two lineages descended from that node. Internal branches or internodes connect two nodes, whereas external branches connect a tip and a node.
A clade is a piece of a phylogeny that includes an ancestral lineage and all the descendants of that ancestor. This group of organisms has the property of monophyly (from the Greek for "single clan"), so it may also be referred to as a monophyletic group. A clade or monophyletic group is easy to identify visually: it is simply a piece of a larger tree that can be cut away from the root with a single cut (Figure 4a). Accordingly, if a tree needs to be cut in two places to extract a given set of taxa, then those taxa are non-monophyletic (Figure 4b).
Clades are natural chunks of trees because there is a portion of history (specifically, the internal branch that attaches the clade to the rest of the tree) that is common to all members of the clade and to no other tips. As a result, statements of common ancestry that apply to a clade always apply to all tips within the clade. For instance, if you are told that mammals share a more recent common ancestor with lizards than with sharks, and if "mammals" refers to a clade, then you can deduce that all mammalian species share a more recent common ancestor with lizards than with sharks.
This is not true of non-monophyletic groups, as can be illustrated by reference to the traditional (but misleading) concept of "reptiles," which included lizards, snakes, crocodiles, and turtles, but not birds. Because "reptiles" (in this sense) does not refer to a monophyletic group, it is difficult to make general statements about the organisms in this group. Furthermore, researchers now know that crocodiles share a more recent common ancestor with birds than with lizards, snakes, or turtles. Thus, current concepts of "Reptilia" generally include birds as members of this clade. Indeed, it is because of such problems with non-monophyletic groups that modern systems of classification strive to give formal names only to monophyletic groups.
How to Read an Evolutionary Tree
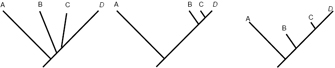
Unless indicated otherwise, a phylogenetic tree only depicts the branching history of common ancestry. The pattern of branching (i.e., the topology) is what matters here. Branch lengths are irrelevant--they are simply drawn in whatever way makes the tree look most tidy. Thus, the three trees shown in Figure 5 all contain the same information.
Similarly, tree diagrams can depict the same information yet be oriented in different ways. The three trees in Figure 6, for example, have the same topology and thus the same evolutionary implications. In each case, the first divergence event separated the lineage that gave rise to tip A from the lineage that gave rise to tips B, C, and D. The latter lineage then split into two lineages, one of which developed into tip B, and the other which gave rise to tips C and D. What this means is that C and D share a more recent common ancestor with each other than either shares with A or B. Tips C and D are therefore more closely related to each other than either is to tip A or tip B. The diagram also shows that tips B, C, and D all share a more recent common ancestor with each other than they do with tip A. Because tip B is an equal distance (in terms of branch arrangement) from both C and D, we could say that B is equally related to C and D. Likewise, B, C, and D are all equally related to A.
It might seem confusing that such different-looking trees can contain the same information. Here, it might be helpful to remember that the lines of a tree represent evolutionary lineages — and evolutionary lineages do not have any true position or shape. It is therefore equally valid to draw the branch leading to tip A as being on either the right or the left side of the split, as shown in Figure 7. Similarly, it doesn't matter whether branches are drawn as straight diagonal lines, are kinked to make a rectangular tree, or are curved to make a circular tree. Think of lineages as flexible pipe cleaners rather than rigid rods; similarly, picture nodes as universal joints that can swivel rather than fixed welds. Using this sort of imagery, it becomes easier to see that the three trees in Figure 7, for example, are equivalent. The basic rule is that if you can change one tree into another tree simply by twisting, rotating, or bending branches, without having to cut and reattach branches, then the two trees have the same topology and therefore depict the same evolutionary history.
It might seem confusing that such different-looking trees can contain the same information. Here, it might be helpful to remember that the lines of a tree represent evolutionary lineages--and evolutionary lineages do not have any true position or shape. It is therefore equally valid to draw the branch leading to tip A as being on either the right or the left side of the split, as shown in Figure 7. Similarly, it doesn't matter whether branches are drawn as straight diagonal lines, are kinked to make a rectangular tree, or are curved to make a circular tree. Think of lineages as flexible pipe cleaners rather than rigid rods; similarly, picture nodes as universal joints that can swivel rather than fixed welds. Using this sort of imagery, it becomes easier to see that the three trees in Figure 7, for example, are equivalent. The basic rule is that if you can change one tree into another tree simply by twisting, rotating, or bending branches, without having to cut and reattach branches, then the two trees have the same topology and therefore depict the same evolutionary history.
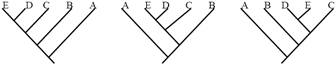
Figure 7: Relationships on a phylogenetic tree can be depicted in multiple ways.
These trees depict equivalent relationships despite the fact that certain internal branches have been rotated so that the order of the tip labels is different.
© 2008 Nature Education All rights reserved. 
Finally, it's important to note that in some instances, rectangular phylogenetic trees are drawn so that branch lengths are meaningful. These trees are often called phylograms, and they generally depict either the amount of evolution occurring in a particular gene sequence or the estimated duration of branches. Usually, the context of such trees makes it clear that the branch lengths have meaning. However, when this is not the case, it is important to avoid reading in any temporal information that is not shown. For example, Figure 8 may appear to suggest that the node marking the last split leading to tips A and B (marked x) occurred after the node separating tip C from tips D and E (marked y). However, this should not be read into the tree; in reality, node x could have occurred either before or after node y.
The Importance of Phylogenetic Trees
Given the increasing use of phylogenies across the biological sciences, it is now essential that biology students learn what tree diagrams do (and do not) communicate. Developing "tree thinking" skills also has other benefits. Most importantly, trees provide an efficient structure for organizing knowledge of biodiversity and allow one to develop an accurate, nonprogressive conception of the totality of evolutionary history. It is therefore important for all aspiring biologists to develop the skills and knowledge needed to understand phylogenetic trees and their place in modern evolutionary theory.
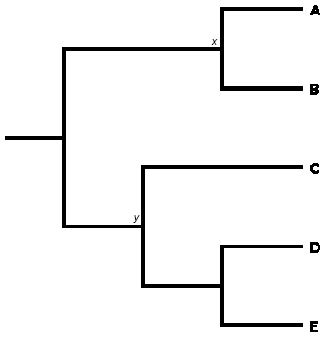
Figure 8: Trees contain information on the relative timing of nodes only when the nodes are on the same path from the root (i.e., when one node is a descendant of another).
In this tree, nodes x and y are not on the same path, so we cannot tell whether the ancestral organisms in node x lived before or after those in node y.
© 2008 Nature Education All rights reserved.
Summary
Avise, J. C. Evolutionary Pathways in Nature: A Phylogenetic Approach (Cambridge University Press, Cambridge, UK, 2006)
Baum, D. A., DeWitt Smith, S., & Donovan, S. S. The tree thinking challenge. Science 310, 979–980 (2005)
Baum, D. A., & Offner, S. Phylogenies and tree thinking. American Biology Teacher 70, 222–229 (2008)
Dawkins, R. The Ancestor's Tale: A Pilgrimage to the Dawn of Life (Houghton Mifflin, New York, 2004)
O'Hara, R. J. Homage to Clio: Toward an historical philosophy for evolutionary biology. Systematic Zoology 37, 142–155 (1988)
O'Hara, R. J. Population thinking and tree thinking in systematics. Zoologica Scripta 26, 323–329 (1997)
Maddison, W. P., & Maddison, D. R. MacClade: Analysis of Phylogeny and Character Evolution (Sinauer Associates, Sunderland, MA, 1992)
Tree Thinking Group. Tree Thinking Group homepage, (2004)


