


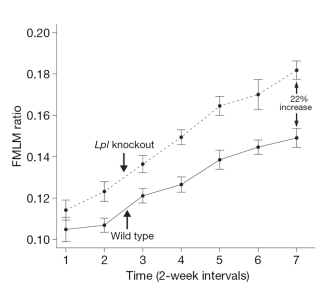
 Figure 1: Genes in the MEM network validated as having a causal relationship with obesity traits in Lpl knockout mice.


« Prev Next »
Before the human genome was sequenced, geneticists used pedigrees and restriction fragment length polymorphisms (RFLPs) to map and identify single genes linked to Mendelian diseases. In recent years, however, expanded knowledge of the human genome has led to the development of new tools that facilitate the simultaneous analysis of thousands of genes. Researchers now rely on such tools in their search to uncover the gene networks associated with numerous human diseases and conditions, including obesity. But how do these tools work, and what have they revealed? Furthermore, how might information regarding gene networks contribute to the treatment of human disease?
Studying Disease with Genome-Wide Scans
Today, geneticists use a number of forward approaches (i.e., approaches that seek to find the genetic basis of a phenotype) in their efforts to understand how gene networks contribute to disease. One such method is the genome-wide association study, or GWAS; this high-throughput approach allows geneticists to scan the entire human genome in an unbiased manner, using statistical methods to determine associations between chromosomal loci and a given phenotype. Another common method is quantitative trait locus (QTL) analysis. Here, investigators begin by identifying a QTL, or a chromosomal region associated with a given phenotype. Once a QTL has been identified, the candidate genes within that region are studied in more detail. A third method involves consideration of microsatellite DNA sequences, which are short stretches of chromosomal DNA that contain a two- to five-base-pair sequence (such as CA) that is repeated multiple times (e.g., CACACACACACACA). Microsatellites are polymorphic, and the number of base-pair repeats often varies between individuals. Finally, a fourth approach involves the comparison of single nucleotide polymorphisms (SNPs); these are single-base-pair polymorphic regions that often vary from one person to the next, and they have been mapped along the length of every human chromosome.
To carry out genome-wide scans, researchers start with a population of subjects (e.g., humans, mice, etc.) that manifests the disease in question, and they then use high-throughput methods to study the members of this population. For instance, investigators often employ microarrays to identify changes in gene expression associated with disease phenotypes. In other instances, they perform genome-wide scans of microsatellite DNA sequences and use SNP arrays to map disease phenotypes to particular chromosome regions. DNA mutations or variations within the microsatellites or SNPs can sometimes provide valuable insights about disease phenotypes. Once equipped with gene expression, QTL, and SNP data, researchers can use statistical approaches to establish which gene networks may be associated with a complex disease.
Reconstructing Obesity-Related Gene Networks
© 2008 Nature Publishing Group Chen, Y. et al. Variations in DNA elucidate molecular networks that cause disease. Nature 452, 433 (2008). All rights reserved. 
One excellent example of the use of such tools involves recent efforts aimed at uncovering the gene networks associated with obesity. For example, in one study, Emilsson et al. (2008) analyzed 1,675 adipose tissue and blood samples from Icelandic individuals of Caucasian descent. These individuals ranged in age from 18 to 85 years, and their clinical obesity-related biometric phenotypes (height, weight, percentage body fat [PBF], and waist-to-hip ratio [WHR]) were determined before the study began. All subjects were recruited as three-generation families. The researchers used the values of the subjects' biometric traits to determine age- and sex-adjusted body mass index (BMI) values as a measurement of obesity. They then collected adipose tissue samples from 1,002 subjects (group IFA) and blood samples from 673 subjects (group IFB); 553 of these subjects provided both an adipose tissue sample and a blood sample and were thus represented in both groups.
Next, Emilsson et al. used microarrays to simultaneously examine the mRNA expression levels of 23,720 different genes in each of the adipose and blood samples. The research team then used sophisticated computer-based statistical methods to determine associations between obesity and gene expression. In doing so, they identified strong correlations between the genes expressed in adipose tissue and the phenotypes associated with obesity. In particular, they found that the expression of 17,080 genes (72%) correlated with BMI, the expression of 16,977 genes (72%) correlated with PBF, and the expression of 14,901 genes (63%) correlated with WHR. On the other hand, in blood tissue, the team determined that the expression of 2,172 genes (9%) correlated with BMI, the expression of 1,098 genes (5%) correlated with PBF, and the expression of 711 genes (3%) correlated with WHR. Thus, there was an approximately tenfold higher correlation between gene expression and obesity-related traits in adipose tissue relative to blood.
© 2008 Nature Publishing Group Chen, Y. et al. Variations in DNA elucidate molecular networks that cause disease. Nature 452, 433 (2008). All rights reserved.
Furthermore, during the course of the study, Emilsson et al. used genome-wide methods to identify specific microsatellite DNA sequences and SNPs linked to obesity. The researchers screened a total of 1,732 microsatellite DNA sequences from all 1,675 subjects, and a total of 317,503 SNPs from 150 unrelated subjects who had donated both blood and adipose tissue samples. In doing so, the team was able to identify thousands of microsatellite DNA sequences and SNPs that were not only linked to obesity, but also found in the same chromosomal regions as some of the genes whose expression correlated to obesity.
Then, rather than focusing on individual genes, the researchers searched for gene networks associated with obesity. Here, they generated transcriptional co-expression networks by conducting pair-wise comparisons between all of the differentially expressed genes identified in adipose tissue. After identifying gene-gene correlations, they generated interaction maps to show the connections between each gene and all of the other genes. Following completion of this step, they examined the known functions of the genes within the co-expression network to determine whether these genes were involved in similar cellular processes.
In this way, Emilsson et al. found that many of the interconnected genes associated with obesity were also associated with the inflammatory response and pathways linked to macrophage activation. Some of these genes encoded macrophage-associated cell surface markers, and many were known to be expressed in spleen, thymus, and lymphoid tissues. The researchers thus coined the term "macrophage-enriched metabolic network," or MEMN, to describe this set of 886 genes, and they noted that expression of 868 out of the 886 MEMN genes (98%) showed a significant correlation with BMI and obesity.
Gene Validation Associated with Obesity in Mice
© 2008 Nature Publishing Group Chen, Y. et al. Variations in DNA elucidate molecular networks that cause disease. Nature 452, 433 (2008). All rights reserved.
In order to independently validate these findings, the same group of researchers next carried out a similar set of experiments in which they compared gene expression in adipose tissue samples from wild-type mice with that in samples from obese mice that carried a mutation in the Apoe gene. Here, the researchers found that many of the same genes associated with obesity in humans were also associated with obesity in mice.
For example, QTL studies by this research team showed a strong correlation between the distal half of chromosome 1 and obesity in those mice that carried the Apoe mutation. In particular, the team identified 375 genes whose expression correlated strongly with obesity-related phenotypes; many of these genes were known to be associated with metabolism and/or obesity (Chen et al., 2008). The researchers also identified three novel genes—lipoprotein lipase (Lpl), lactamase b (Lactb), and protein phosphatase 1-like (Ppm1l)—whose expression was strongly associated with obesity. The Lpl gene encodes an enzyme involved in triglyceride metabolism that is active in differentiated macrophages. The Lactb gene encodes a serine protease that is similar to the product of the bacterial lactamase gene, which is involved in metabolism of bacterial cell wall proteoglycans. Finally, the Ppm1l gene encodes a protein phosphatase of unknown function.
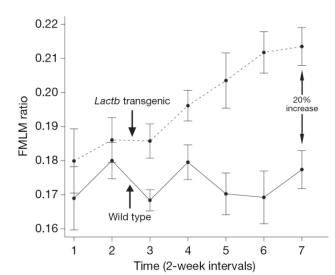
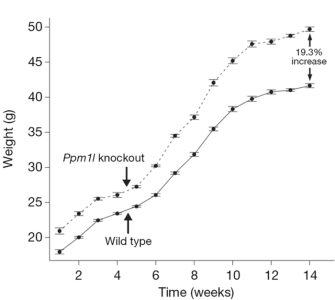
In order to learn more about the function of these three genes and to establish functional links to obesity, the researchers examined phenotypes in knockout mice that lacked these genes and in transgenic mice that overexpressed them. In doing so, the team found that growth curves from the Lpl knockout mice showed a fat mass to lean mass (FMLM) ratio 22% higher than the ratio in the wild-type control mice (Figure 1). Similarly, growth curves from transgenic mice engineered to express high levels of Lactb showed a 20% increase in their FMLM ratio relative to wild-type control mice (Figure 2). Furthermore, growth curves of Ppm1l knockout mice showed a 19% increase in their FMLM ratio relative to the wild-type controls (Figure 3). The Ppm1l knockout mice also exhibited a 47% increase in body fat at 20 weeks of age and significantly higher blood pressure. Thus, by studying phenotypes associated with altered Lpl, Lactb, and Pmp1l expression in mice, researchers showed that these three genes are likely to play a causal role in obesity.
Tailoring Disease Therapy to Target Gene Networks
As illustrated by the aforementioned studies, researchers have been successful in their initial efforts to uncover the gene networks involved in obesity. Similar approaches have also been used to investigate other forms of complex disease, including diabetes, age-related macular degeneration, asthma, breast and prostate cancer, and coronary disease. But just how will this expanding knowledge of gene networks be used to combat human disease? It is much too early to tell. However, it is easy to imagine that gene networks, rather than individual genes, may eventually represent a new generation of drug targets.
References and Recommended Reading
Chen, Y., et al. Variations in DNA elucidate molecular networks that cause disease. Nature 452, 429–435 (2008) doi:10.1038/nature06757 (link to article)
Emilsson, V., et al. Genetics of gene expression and its effect on disease. Nature 452, 423–428 (2008) (link to article)


