


 Figure 1


« Prev Next »
Humans have tens of thousands of genes, and the development of DNA microarrays by Patrick O. Brown, Joseph DeRisi, David Botstein, and colleagues in the mid-1990s made it possible to examine the expression of thousands of genes at once. Initial experiments using microarrays focused on determining which genes were expressed differently between normal cells and cancerous cells. Over time, these methods have provided even more detail for physicians. For instance, microarrays are currently a key tool in genetic diagnosis, allowing doctors to identify specific subtypes within an overall disease category based on differences in gene expression. Moreover, physicians can use information from microarrays to determine which treatment methods will most likely yield beneficial results for particular cancer patients. But how do microarrays work, and just how have they been used in cancer diagnosis and treatment thus far? A brief history of the DNA microarray, including its use in the treatment of diffuse large B cell lymphomas, sheds light on both of these questions.
The DNA Microarray
DNA microarrays exploit the ability of complementary strands of nucleic acids to base-pair with each other and bind. For example, ATATGCGC will bind to its complement (TATACGCG) with a certain affinity. This method was first used by Sol Spiegelman to measure the homology (similarity) of two different nucleic acids; Spiegelman called the method "hybridization" of nucleic acids. Later, the developers of the DNA microarray dotted an array of DNA copies (cDNAs) corresponding to a large number of different mRNAs of known sequence onto a glass slide. Because this array was so tiny, it was termed a microarray. Although the cDNAs were double-stranded, they could be melted, or denatured, to single strands, which could then be used to bind, or hybridize, to fluorescently labeled nucleic acid samples from cancerous or normal cells. After washing away the unbound molecules, bound fluorescent nucleic acid samples were identified by laser microscopy. Fluorescent dots indicated expressed genes, and differences in microarray patterns between normal and cancerous cells could be quickly identified.
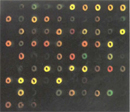
In these early microarray experiments, mRNA from one cell type was made into cDNA labeled with a red fluorescent dye, and mRNA from another cell type was made into cDNA labeled with a green fluorescent dye. The two cDNAs were then mixed and hybridized to the same DNA microarray, resulting in red, green, and yellow dots (caused by a combination of red and green), as well as black dots (Figure 1). Comparative gene expression in the two samples could easily be determined by quantitating the ratio of red and green fluorescence in the spot corresponding to each gene.
DNA Microarray Analysis and DLBCL
Later, microarrays were used to gain insight into whether gene expression changes could be correlated with cancer treatment outcomes. For instance, in 2000, Alizadeh et al. published an important study correlating gene expression in lymphomas (cancers of a group of white blood cells) with patients' clinical outcomes. The researchers were particularly interested in finding a way to distinguish molecular differences between patients with diffuse large B cell lymphomas (DLBCLs) who died very rapidly and those who lived much longer. Gene expression patterns in samples from healthy and DLBCL patients revealed some interesting trends. For example, a group of genes called germinal center B cell genes tended to be highly expressed in dividing B cells but not in resting B cells in healthy patients (Table 1). In contrast, in DLBCLs, expression could be either low or high; there was no consensus.
Table 1: Gene Expression Levels Compared with Reference mRNA Sample
| Cell Type | DLBCL* | B Cell of Germinal Center | T Cell | Transformed Cell Line | Resting B Cell | CLL** |
| Pan B cell | High/low | High | Low | Low | High | High/low |
| Germinal center B cell | High/low | High | Low | Low | Low | Low |
| T cell | High/low | Low | High | Low | Low | High/low |
| Activated B cell | High/low | Low | High | Low | Low | Low |
| Proliferation | High/low | Low | Low | High | Low | Low |
| Lymph node | High/low | Low | Low | Low | High/low | High/low |
* Diffuse large B cell lymphoma
** Chronic lymphocytic leukemia
These results gave researchers a clue that there might be subgroups within this group of genes, or that the genes had been grouped incorrectly. The genes were thus regrouped via statistical methods, and remarkably, the DLBCL samples fell neatly into two groups. One group exhibited gene expression similar to the B lymphocytes in germinal centers, while the other group exhibited gene expression similar to activated B lymphocytes (Table 2); this also held true for many other genes examined. Thus, the initial high/low expression of the germinal center B cell genes resulted from the fact that that this group actually consisted of two subgroups of genes that responded differently in DLBCL and healthy patients. Nonetheless, the real question remained to be examined: Could these differences in gene expression between subgroups be used to predict clinical outcomes?
Table 2: Gene Expression Levels in DLBCL Subgroups, as Compared with Reference mRNA Sample
| Selected Gene | GC-like* | Activated B-like** |
| FMR2 | High | Low |
| Myosin 1C | High | Low |
| A-MYB | High | Low |
| BCL2 | Low | High |
| MAPKK5 kinase | Low | High |
| C-MYC | Low | High |
* Similar to B cell of germinal center
** Similar to activated B cell
Notably, when the authors examined the clinical data from the same patients, they found that patients in the GC-like subgroup exhibited much better survival rates than those in the activated B-like subgroup. In fact, half of those patients with the activated B-like expression pattern died within two years of diagnosis, while over half of those with the GC-like pattern of gene expression were still alive 11 years after diagnosis. The researchers therefore concluded that "muddy diagnostic categories" can be clarified by means of DNA microarray analysis of gene expression. This study and others help provide the basis for the development of individualized medicine—the way of the future.
Other Applications of Microarray Data
As previously mentioned, research efforts such as the DLBCL study suggested that DNA microarrays would someday serve as a valuable tool in the delivery of patient-specific, highly individualized medical care--and so far, they have been right. Today, testing for elevated expression of certain genes can assist in predicting cancer outcomes and in assigning appropriate treatment programs. For example, elevated expression of the estrogen receptor gene predicts a favorable response to breast cancer treatments that interfere with estrogen synthesis or that block estrogen receptors. Similarly, Oncotype DX is a test that simultaneously examines 21 genes in patient biopsies. Combined with other information about a patient, details about the expression of these 21 genes can help doctors decide whether chemotherapy is the best course of action for the patient. Recently, DNA microarray technology has also been used to examine global gene-expression changes in disease, thereby shedding additional light on the complex nature of many seemingly straightforward conditions.
Summary
Since its development in the mid-1990s, DNA microarray technology has revealed a great deal about the genetic factors involved in a number of diseases, including multiple forms of cancer. Early on, researchers used microarrays to identify differences in gene expression between normal cells and their cancerous counterparts. Shortly thereafter, scientists began to employ this technology to distinguish specific subtypes of certain cancers, as well as to determine which treatment methods would most likely be effective for particular patients. Although individualized medicine such as this is still in its infancy, DNA microarrays will no doubt continue to play a leading role in the development of this field, as well as in continued research as to the complete genetic basis of all types of human disease.
References and Recommended Reading
Alizadeh, A., et al. Use of a cDNA microarray to analyse gene expression patterns in human cancer. Nature Genetics 14, 457–460 (1996) doi:10.1038/ng1296-457 (link to article)
Campbell, A. M., et al. Make microarray data with known ratios. CBE Life Sciences Education 6, 196–197 (2007)
Schena, M., et al. Quantitative monitoring of gene expression patterns with a complementary DNA microarray. Science 270, 467–470 (1995)
Tibshirani, R., et al. Distinct types of diffuse large B-cell lymphoma identified by gene expression profiling. Nature 430, 503–511 (2000) doi:10.1038/35000501 (link to article)


