


« Prev Next »

Gene Expression Is Analyzed by Tracking RNA
Even though nearly every cell in an organism's body contains the same set of genes, only a fraction of these genes are used in any given cell at any given time. It is this carefully controlled pattern of what is called "gene expression" that makes a liver cell different from a muscle cell, and a healthy cell different from a cancer cell. But how can researchers determine which genes are "turned on" and when?
How do scientists measure gene expression?

Figure 1: Siamese cats have colored \"points\" because of a temperature-sensitive pigmentation gene. In cooler areas of a cat's body (nose and paws), this gene is expressed to a greater degree.
Both Northern blots and SAGE analyses work by measuring levels of mRNA, the intermediary between DNA and protein. Remember, in order to activate a gene, a cell must first copy the DNA sequence of that gene into a piece of mRNA known as a transcript. Thus, by determining which mRNA transcripts are present in a cell, scientists can determine which genes are expressed in that cell at different stages of development and under different environmental conditions.
Northern blots: What are they, and how do they work?
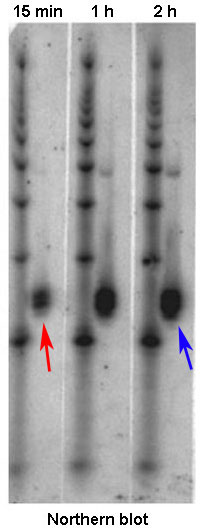
Figure 2: A Northern blot allows comparison of mRNA levels, which are a direct reflection of gene expression. This blot above shows the tracking of mRNA levels in a cell sample at various intervals after exposure to a drug. At 15 minutes after exposure, mRNA levels are low (red arrow, small black mark); at two hours after exposure, these levels have increased (blue arrow, larger black mark).
The quantity of mRNA transcript for a single gene directly reflects how much transcription of that gene has occurred. Tracking of that quantity will therefore indicate how vigorously a gene is transcribed, or expressed. To visualize differences in the quantity of mRNA produced by different groups of cells or at different times, researchers often use the method known as a Northern blot. For this method, researchers must first isolate mRNA from a biological sample by exposing the cells within it to a protease, which is an enzyme that breaks down cell membranes and releases the genetic material in the cells. Next, the mRNA is separated from the DNA, proteins, lipids, and other cellular contents. The different fragments of mRNA are then separated from one another via gel electrophoresis (a technique that separates molecules by passing an electrical current through a gel medium containing the molecules) and transferred to a filter or other solid support using a technique known as blotting. To identify the mRNA transcripts produced by a particular gene, the researchers next incubate the sample with a short piece of single-stranded RNA or DNA (also known as a probe) that is labeled with a radioactive molecule. Designed to be complementary to mRNA from the gene of interest, the probe will bind to this sequence. Later, when the filter is placed against X-ray film, the radioactivity in the probe will expose the film, thereby making marks on it. The intensity of the resulting marks, called bands, tells researchers how much mRNA was in the sample, which is a direct indicator of how strongly the gene of interest is expressed (Figure 2).
Is it possible to study the expression of multiple genes simultaneously?
Until recently, scientists studied gene expression by looking at only one or very few gene transcripts at a time. Thankfully, new techniques now make large-scale studies of gene expression possible. One such technique is SAGE (serial analysis of gene expression). A method for measuring the expression patterns of many genes at once, SAGE not only allows scientists to analyze thousands of gene transcripts simultaneously, but it also enables them to determine which genes are active in different tissues or at different stages of cellular development.
How does SAGE work?
SAGE identifies and counts the mRNA transcripts in a cell with the help of short snippets of the genetic code, called tags. These tags, which are a maximum of 14 nucleotides long, enable researchers to match an mRNA transcript with the specific gene that produced it. In most cases, each tag contains enough information to uniquely identify a transcript. The name "serial analysis" refers to the fact that tags are read sequentially as a continuous string of information.
The basic steps of the SAGE technique are outlined below.
Capturing mRNA
To begin a SAGE analysis, researchers must first separate the mRNA in a sample from the other cellular contents. To do this, they attach long strips of thymine nucleotides to tiny magnetic beads. When researchers flush the contents of a cell over the beads, these thymine strips form complementary base pairs with the poly-A tails of the mRNA molecules. Thus, when the flushing process is complete, the mRNA transcripts from the sample are captured because they are attached to the magnetic beads, while the other contents of the cells flush past the beads and are discarded.
Rewriting mRNA into cDNA

Figure 3: Reverse transcription converts mRNA into cDNA.
Cutting tags from each cDNA
To begin the next portion of SAGE, the researchers use a cutting enzyme to slice off short segments of nucleotides, called tags, at designated positions in each cDNA molecule. Next, two tags from each cDNA are combined into a single unit. These tags then become the representative for the gene they came from, and they act as a unique identifier in the form of a stand-in. Without having to process the entire mRNA sequence thereafter, scientists can use these shorter tag sequences to keep track of whether a specific gene was expressed in mRNA form.
Linking tags together in chains for sequencing
After the different tags have been made from each mRNA sequence, they are next linked together into long chains called concatemers. These concatemers therefore contain representatives of mRNAs from a group of genes. Linking the tags together in a concatemer is important, because it means that researchers will later be able to read thousands of tags at once during the analysis portion of the SAGE procedure.
Copying and reading the chains
Although the researchers now possess concatemers representing the genes expressed in the sample, they need multiple copies of these concatemers if they wish to run the molecules through a sequencing machine. Thus, just before sequencing, the concatemers are inserted into bacteria, and through their own replication process these bacteria make millions of copies of each concatemer chain. This step increases the volume of material, and it therefore ensures that there is a baseline amount of material necessary for a sequencing machine. After that, researchers use a sequencing machine to decode and read the long string of nucleotides in each chain.
Identifying and counting the tags
Finally, a computer processes the data from the sequencing machine and compiles a list of tags. By comparing the tags to a sequence database, the researchers can identify the mRNA (and ultimately the gene) that each tag came from. By subsequently counting the number of times each tag is observed, the researchers can also estimate the degree to which a particular gene is expressed: the more often a tag appears, the greater the level of gene expression.
What can researchers learn from SAGE?
Compared to other techniques for measuring gene expression, SAGE offers a significant advantage because it measures the expression of both known and unknown genes. Sometimes, when analyzing SAGE data, computers cannot find matches for certain tags in their sequence databases. What does this mean? Interestingly, a lack of matches indicates that the mRNA used to produce these tags is associated with genes that have not been studied before. In this way, SAGE has been used to discover new genes involved in a variety of diseases.
Are there other ways to measure gene expression?
More about measuring gene expression
In addition to Northern blot tests and SAGE analyses, there are several other techniques for analyzing gene expression. Most of these techniques, including microarray analysis and reverse transcription polymerase chain reaction (RT-PCR), work by measuring mRNA levels. However, researchers can also analyze gene expression by directly measuring protein levels with a technique known as a Western blot.
Further Exploration
Key Questions
eBooks
This page appears in the following eBook


