


 Figure 2: Two-step production of anthocyanin.
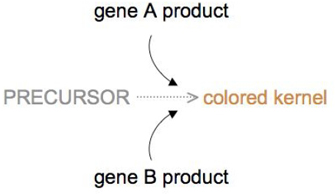


« Prev Next »
In his dihybrid crosses with pea plants, Gregor Mendel simultaneously examined two different genes that controlled two different traits. For instance, in one series of experiments, Mendel began by crossing a plant that was homozygous for both round seed shape and yellow seed color (RRYY) with another plant that was homozygous for both wrinkled seed shape and green seed color (rryy). Then, when Mendel crossed two of the F1 progeny plants with each other (RrYy × RrYy), he obtained an F2 generation with a phenotypic ratio of 9:3:3:1, as summarized in Table 1.
Table 1: Phenotypes and Genotypes in Mendel's F2 Generation
| Proportion | Genotype | Phenotype |
| 9/16 | R_Y_ | Round, yellow |
| 3/16 | R_yy | Round, green |
| 3/16 | rrY_ | Wrinkled, yellow |
| 1/16 | rryy | Wrinkled, green |
In this dihybrid cross, each gene locus had an independent effect on a single phenotype. Thus, the R and r alleles affected only the shape of the seed and had no influence on seed color, while the Y and y alleles affected only seed color and had no influence on seed shape. In this case, there were two separate genes that coded for two separate characteristics.
But what happens when two different loci affect the same characteristic? For instance, what if both of the loci in Mendel's experiment affected seed color? When two genes are involved in the outcome of one characteristic, a dihybrid cross involving these genes can produce a phenotypic ratio very different from 9:3:3:1. Under these circumstances, there are more than two gene products affecting the same phenotype, and these products may have complex hierarchical relationships. Any time two different genes contribute to a single phenotype and their effects are not merely additive, those genes are said to be epistatic.
Although some researchers have attempted to categorize all digenic (two-gene) epistatic interactions with specific names, those classification schemes are seldom used today. One reason that they have fallen out of favor is that terms such as "dominant" and "recessive" are best used to describe the effects of alleles of single genes. Furthermore, epitasis is not restricted to the interactions of only two genes. Rather, epistasis occurs in all of the following scenarios:
- Whenever two or more loci interact to create new phenotypes
- Whenever an allele at one locus masks the effects of alleles at one or more other loci
- Whenever an allele at one locus modifies the effects of alleles at one or more other loci
Epistasis is an interaction at the phenotypic level of organization. The genes that are involved in a specific epistatic interaction may still show independent assortment at the genotypic level. In such cases, however, the phenotypic ratios may appear to deviate from those expected with independent assortment.
Epistatic Relationships Involving Two Genes
As previously mentioned, scientists have performed numerous studies in an attempt to better understand and classify digenic epistatic relationships. Some of the most famous examples of research in which the interaction between two genes was found to produce a novel phenotype are examined in the following sections.
Combs in Chickens
Figure 1: Rooster displaying a single comb.
Eric Isselee/Shutterstock. All rights reserved.
Through continued research, Bateson and Punnett deduced that Wyandotte (rose-combed) chickens must have the genotype RRpp, while Brahma chickens must have the genotype rrPP. A cross between a Wyandotte and a Brahma would yield offspring that all had the RrPp genotype, which manifested as the walnut-comb phenotype. Indeed, any chicken with at least one rose-comb allele (R) and one pea-comb allele (P) would have a walnut comb. Thus, when two F1 walnut chickens were crossed, the resulting F2 generation would yield rose-comb chickens (R_pp), pea-comb chickens (rrP_), and walnut-comb chickens (R_P_), as well as chickens with a new, fourth phenotype—the single-comb phenotype. Based on the process of elimination, it could be assumed that these single-comb chickens had the rrpp genotype (Bateson & Punnett, 1905; 1906; 1908).
Flower Color in Peas
Bateson and Punnett next performed a set of experiments in peas that also showed gene-gene interaction. The duo opted to use peas because it is relatively easy to perform hybrid crosses with these plants, and they chose to focus on the characteristic of flower color.
Bateson and Punnett began by crossing two varieties of pea, each of which was pure-breeding for white flowers. This cross yielded an F1 generation in which all progeny had purple flowers. Next, two F1 plants were crossed to create the F2 generation. In this generation, Bateson and Punnett counted a total of 382 purple-flowered plants and 269 white-flowered plants. The ratio of purple flowers to white flowers was thus 9.4:6.6, or approximately 9:7.
What could explain this variation from Mendelian ratios? Bateson set out to answer this question in a 1909 report, in which he first proposed what he called the ability of one "allelomorphic pair" (pair of gene alleles) to mask the affects of the alleles for another gene. To rephrase this in terms of Bateson and Punnett's pea experiment, it seemed that two recessive alleles at one flower locus could mask the effects of the alleles at the other flower locus. Let's designate the first locus as the C locus, and the second as the P locus. If Bateson's theory held true, it meant that any flower with the cc genotype would be white, no matter what alleles were present at its P locus. Similarly, any flower with the pp genotype would also be white, no matter what alleles were present at its C locus. Bateson later used the word "epistasis," which translates as "standing upon," to define the masking action of one gene by another. (Since then, scientists have come to understand that genes can interact in more ways than just masking.)
Many years after Bateson first described this 9:7 phenotypic ratio in pea plants, researchers were finally able to determine the two genes responsible for it (Dooner et al., 1991). These genes control flower color by controlling pea plant biochemistry, in particular that related to pigment compounds called anthocyanins. In peas, there is a two-step chemical reaction that forms anthocyanins; gene C is responsible for the first step, and gene P is responsible for the second (Figure 2). If either step is nonfunctional, then no purple pigment is produced, and the affected pea plant bears only white flowers. The dominant C and P alleles code for functional steps in anthocyanin production, whereas the recessive c and p alleles code for nonfunctional steps. Thus, if two recessive alleles occur for either gene, white flowers will result.
Table 2 shows in detail how the 9:7 ratio is a modification of phenotypic but not genotypic Mendelian ratios. Note that the C and P genes independently assort, and remember that the presence of a recessive genotype at one locus (i.e., cc or pp) masks the effects of the alleles at the other locus. Note also that there are nine combinations of alleles in the F1 generation that feature at least one dominant C and one dominant P allele, which would yield a purple flower phenotype (indicated within the table by purple shading). Conversely, there are seven combinations that result in either a cc or a pp, which would yield the white flower phenotype-hence, the 9:7 ratio of purple to white flowers.
Table 2: Results of the Cross Between Two Pea Plants with Genotype CcPp
| Female Gametes | ||||||
| CP | Cp | cP | cp | |||
| Male Gametes | CP | CCPP | CCPp | CcPP | CcPp | |
| Cp | CCPp | CCpp | CcPp | Ccpp | ||
| cP | CcPP | CcPp | ccPP | ccPp | ||
| cp | CcPp | Ccpp | ccPp | ccpp | ||
Primula Petal Color

Figure 3:
Malvidin production.
Production of the petal pigment malvidin is controlled by one gene, but its synthesis can be suppressed by another gene at a different locus.
© 2008 Nature Education All rights reserved. 
So, if two plants with genotype KkDd are crossed with each other, what is the ratio of blue offspring to nonblue offspring? The results of such a cross are detailed in Table 3.
Table 3: Results of the Cross Between Two Primula Plants with Genotype KdDd
| Female Gametes | ||||||
| KD | Kd | kD | kd | |||
| Male Gametes | KD | KKDD | KKDd | KkDD | KkDd | |
| Kd | KKDd | KKdd | KkDd | Kkdd | ||
| kD | KkDD | KkDd | kkDD | kkDd | ||
| kd | KkDd | Kkdd | kkDd | kkdd | ||
In Table 3, all of the shaded boxes contain genotypes that indicate an absence of malvidin. In particular, the yellow boxes represent genotypes that feature at least one D allele, and the presence of the D allele suppresses the production of malvidin. Meanwhile, the light turquoise box represents a genotype with no malvidin suppression (dd), but also no malvidin production (kk). On the other hand, the three unshaded/white boxes are the only genotypes that permit the production of malvidin, which means that plants with these phenotypes bear blue flowers. The phenotypic ratio is therefore 13:3. This type of epistasis is sometimes called dominant suppression, because the deviation from 9:3:3:1 is caused by a single allele that produces a dominant phenotype, and the action of this allele is to suppress the expression of some other gene.
Wheat Kernel Color
Genes don't always have to act in opposition to each other for an interaction to be epistatic, however. Sometimes, two genes that each have the same role in protein production can substitute for each other.
The mechanism by which wheat kernel color is determined is an example of duplicate gene action. In wheat, kernel color is dependent upon a biochemical reaction that converts a precursor substance into a pigment, and this reaction can be performed with the product of either gene A or gene B (Figure 4). Thus, having either an A allele or a B allele produces color in the kernel, but a lack of either allele will produce a white kernel that is devoid of color.
Table 4 depicts the results of a dihybrid cross between two plants with genotype AaBb. Note that among the offspring of this cross, the phenotype is nearly uniform.
Table 4: Results of the Cross Between Two Wheat Plants with Genotype AaBb
| Female Gametes | ||||||
| AB | Ab | aB | ab | |||
| Male Gametes | AB | AABB | AABb | AaBB | AaBb | |
| Ab | AABb | AAbb | AaBb | Aabb | ||
| aB | AaBB | AaBb | aaBB | aaBb | ||
| ab | AaBb | Aabb | aaBb | aabb | ||
In this cross, whenever a dominant allele is present at either locus, the biochemical conversion occurs, and a colored kernel results. Thus, only the double homozygous recessive genotype produces a phenotype with no color, and the resulting phenotypic ratio of color to noncolor is 15:1.
In the malvidin example in Table 3, gene D is epistatic to gene K because one allelic pair masks the expression of an allele at the second locus. In the case of duplicate gene action, as in Table 4, the outcome is less variable, but it is still derived from multiple gene interactions. Here, if wheat kernel color is controlled by genes A and B, then A is epistatic to allele B or allele b, and B is epistatic to allele A or allele a.
Coat Color in Horses
Yet another type of epistasis occurs when one gene interacts with another to modify—but not mask—a phenotype. For example, in horses, the extension gene determines whether an animal's coat color will be red or black; here, the dominant allele E produces black pigment in the coat, while the recessive allele e produces red pigment. All horses with genotype ee are therefore red, yet there are many different types of red horses. These differences exist because of the action of epistatic modifier genes.
One such modifier gene is called cream dilution. The cream dilution gene has two alleles: CCr and C. The CCr allele is semidominant; it dilutes red to yellow in the heterozygous state and red to pale cream in the homozygous state. On the other hand, the C allele has no diluting effect on coat color. Thus, horses with genotype eeCC are chestnut colored, and they have reddish-brown coats, tails, and manes. In contrast, horses with one copy of the CCR allele (genotype eeCCCR) are palomino (i.e., they have a gold coat with a white mane and tail), while horses with two copies of the CCR allele (genotype ee CCRCCR) are cremello (i.e., basically white or cream colored).
Other Types of Epistatic Interactions
Today, scientists know that Mendel's predictions about inheritance depended on the genes he chose to study. Specifically, Mendel carefully selected seven unlinked genes that affected seven different traits. However, unlike the phenotypes that Mendel considered, the majority of phenotypes are affected by more than one gene. Indeed, most of the characteristics of organisms are much more complex than the characteristics that Mendel studied, and epistasis is one source of this complexity. Epistasis can occur in a variety of different ways and result in a variety of different phenotypic ratios, as illustrated in Table 4. Beyond epistasis, gene-environment interactions further increase the variety of phenotypes we see around us each day.
Table 4: Examples of Digenic Epistatic Ratios
| Ratio | Description | Name(s) of Relationship (Used by Some Authors) |
| 9:3:3:1 | Complete dominance at both gene pairs; new phenotypes result from interaction between dominant alleles, as well as from interaction between both homozygous recessives | Not named because the ratio looks like independent assortment |
| 9:4:3 | Complete dominance at both gene pairs; however, when one gene is homozygous recessive, it hides the phenotype of the other gene | Recessive epistasis |
| 9:7 | Complete dominance at both gene pairs; however, when either gene is homozygous recessive, it hides the effect of the other gene | Duplicate recessive epistasis |
| 12:3:1 | Complete dominance at both gene pairs; however, when one gene is dominant, it hides the phenotype of the other gene | Dominant epistasis |
| 15:1 | Complete dominance at both gene pairs; however, when either gene is dominant, it hides the effects of the other gene | Duplicate dominant epistasis |
| 13:3 | Complete dominance at both gene pairs; however, when either gene is dominant, it hides the effects of the other gene | Dominant and recessive epistasis |
| 9:6:1 | Complete dominance at both gene pairs; however, when either gene is dominant, it hides the effects of the other gene | Duplicate interaction |
| 7:6:3 | Complete dominance at one gene pair and partial dominance at the other; when homozygous recessive, the first gene is epistatic to the second gene | No name |
| 3:6:3:4 | Complete dominance at one gene pair and partial dominance at the other; when homozygous recessive, either gene hides the effects of the other gene; when both genes are homozygous recessive, the second gene hides the effects of the first | No name |
| 11:5 | Complete dominance for both gene pairs only if both kinds of dominant alleles are present; otherwise, the recessive phenotype appears | No name |
References and Recommended Reading
Bateson, W. Mendel's Principles of Heredity (Cambridge, Cambridge University Press, 1909)
Bateson, W., et al. Experimental studies in the physiology of heredity. Reports to the Evolution Committee of the Royal Society 2, 1–154 (1904)
---. Experimental studies in the physiology of heredity. Reports to the Evolution Committee of the Royal Society 3, 1–53 (1906)
---. Experimental studies in the physiology of heredity. Reports to the Evolution Committee of the Royal Society 4, 1–60 (1908)
Cordell, H. Epistasis: What it means, what it doesn't mean, and statistical methods to detect it in humans. Human Molecular Genetics 11, 2463–2468 (2002)
Dooner, H. K., Robbins, T. P., & Jorgensen, R. A. Genetic and developmental control of anthocyanin biosynthesis. Annual Review of Genetics 25, 173–199 (1991)


