


« Prev Next »
What are vector-borne diseases?
Vector-borne diseases are caused by pathogens transmitted among hosts by intermediate species, primarily arthropods such as mosquitoes or ticks (Figure 1). According to the World Health Organization Global Burden of Disease study, 7.77% of all human mortality due to infectious diseases in 2004 was associated with vector-borne diseases such as malaria, dengue fever, Japanese encephalitis, and neglected tropical diseases. Malaria, caused by the protozoan Plasmodium falciparum and transmitted by mosquito species in the Anopheles genus, was alone responsible for 83% of this mortality (Figure 2a; World Malaria Report 2010). Another example is dengue fever, which is caused by four related dengue viruses, and is transmitted by the yellow fever mosquito Aedes aegypti (Figure 2b). Vector-borne pathogens also present a health risk to livestock. For instance, bluetongue virus, which is transmitted by biting midges (Culicoides spp., Figure 2c), swept through Europe in 2006-2009, causing ~1.4B $USD in economic losses in France in 2008 alone (Tabachnik et al. 2008). Similarly, Rift Valley Fever, which is transmitted by Aedes mosquitoes in Africa, leads to both economic losses and human deaths mostly due to infection during the slaughtering of infected animals (see, e.g., Rich & Wanyoike 2010). Finally, diseases caused by vector-borne pathogens are not limited to humans and animals. Plants are also susceptible to pathogens transmitted by insect vectors, e.g., Rhopalosiphum padi aphids transmit barley yellow dwarf virus between cereal plants (Figure 2d), which can lead to 40% losses or greater (McKirdy & Jones 2002). These examples illustrate that pathogens transmitted by vectors cause significant human disease and economic loss, and may be an important part of the ecologies of many species. 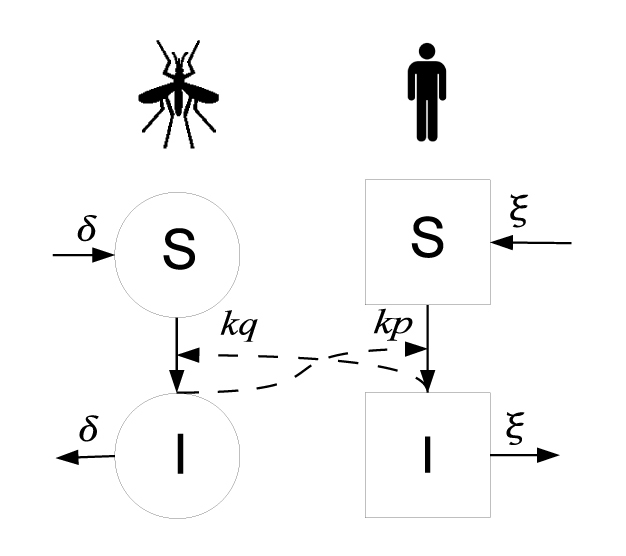
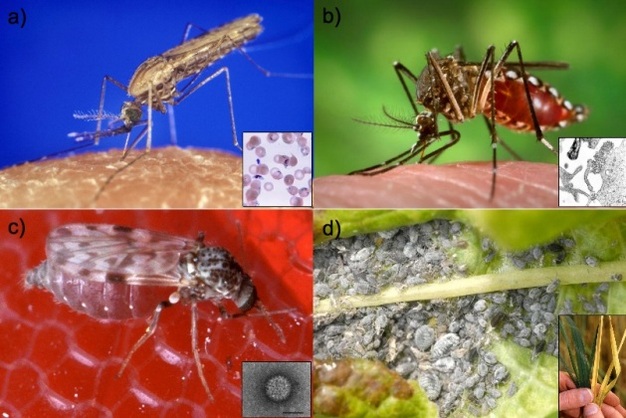
Figure 1
The transmission cycle of malaria as formulated in the Ross-Macdonald model. The variables S and I refer to the numbers of susceptible and infectious vectors and hosts, respectively. Straight arrows between S and I represent the transition from susceptible to infectious states. Dashed arrows represent that susceptible vectors become infectious following a bite of an infectious host, and conversely, susceptible hosts become infectious through the bite of an infectious vector. Formulas on the dashed arrows represent the rate at which such bites lead to a transition from a susceptible to an infectious state. Arrows leaving I represent the rate at which infectious vectors die, and infectious hosts recover, respectively. Arrows leading to S with the same rates denote the fact that susceptible vectors and hosts replace infectious individuals due to the assumption of a constant population size.
© 2013 Nature Education All rights reserved. 
Figure 2: Four examples of the vectors and the pathogens causing vector-borne diseases.
Four examples of the vectors and the pathogens causing vector-borne diseases. (a) Anopheles gambiae, the vector of Plasmodium falciparum, which causes malaria (inset); (b) Aedes aegypti, the yellow fever mosquito, which transmits the dengue viruses (inset); (c) Culicoides sonorensis, which transmits bluetongue viruses (inset); and (d) Rhopalosiphum padi, the oat aphid, the vector of the barley yellow dwarf virus, which causes stunting with yellow color in wheat (inset).
Photos via Wikimedia Commons.
Why study the population dynamics of vector-borne diseases separately?
One approach to understanding the ecology of vector-borne diseases is to study their dynamics. In general, population dynamics concerns changes in the size of populations and the biological and environmental processes influencing those changes. The population dynamics of vector-borne diseases is related to the epidemiology and public health of vector-borne diseases, but has a different scope. While public health and epidemiology focus on changes in the numbers of infected people and the control of the pathogen and the vector itself, population dynamics focuses on changes in the pathogen population size in the vectors and potential alternative animal hosts. One consequence of the deeply ecological nature of vector-borne diseases is that their understanding and control require an appreciation of the interactions among humans, vectors and alternative hosts.
Population dynamics also has a theoretical component, building on the mathematical foundation of demographic models. This theoretical basis enables the articulation and testing of hypotheses and generation of predictions from models that can represent hosts, vectors, and other aspects of the transmission cycle to describe the dynamics of vector-borne pathogens (May & Anderson 1991). These models can then be linked to experimental or observational data using statistical methods and projected forward in time for forecasting.
Key features of the population dynamics of vector-borne diseases
The population dynamics of vector-borne pathogens are characterized by three distinctive phenomena (Figure 3). First, the vectors of most of these pathogens are arthropods, which are ectothermic. Since the metabolic rates of these species are sensitive to abiotic conditions (especially temperature), demographic processes are strongly influenced by the environment leading to marked seasonality in disease activity in most regions of the world (Figure 3a; Laneri et al. 2010). Second, vector-borne diseases are often characterized by explosive outbreaks, especially when pathogens are introduced to new environments, such as the Borrelia burgdorferi spirochete, which causes Lyme disease in the United States (Figure 3b; Center for Disease Control; Surveillance for Lyme Disease 2000, 2008). Finally, pathogens that are transmitted by species with specialized habitat requirements occur sporadically. Thus, for example, the main vector of the Eastern Equine Encephalitis virus (EEEV) is the mosquito Culiseta melanura, which breeds in acid cypress swamps. This mosquito spreads EEEV in the local bird community, from which other mosquito species become infected, which can then bite humans. Successful amplification and the distance to which EEEV spreads vary annually with abiotic conditions, creating sporadic annual outbreaks.
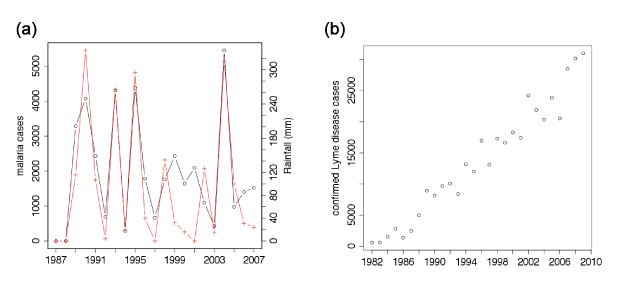
Figure 3
Key features of the population dynamics of vector-borne diseases. (a) Maximum number of monthly P. falciparum malaria cases (in black) and maximum monthly rainfall (in red) in Kutch district in Gujarat state in North-West India for years between 1987 and 2007. Data reconstructed from Figure 1A of Laneri et al. (2010). (b) Number of confirmed cases of Lyme disease reported in the United States 1982-2009. Data sources: Morbidity and Mortality Monthly Report (MMWR) April 28, 2000 / 49(SS03);1-11; MMWR October 3, 2008 / 57(SS10);1-9; (http://www.cdc.gov/ncidod/dvbid/lyme/ld_UpClimbLymeDis.htm)
© 2013 Nature Education All rights reserved.
The theory of population dynamics for vector-borne pathogens
The dynamical theory of epidemics for vector-borne diseases is now highly developed, and there are variations appropriate to many host-vector systems. The first mathematical model for the population dynamics of malaria was developed by Sir Ronald Ross in 1911 and later extended by George Macdonald (Macdonald 1957), N.T.J. Bailey (Bailey 1982), and others. The classical Ross-Macdonald model assumes that hosts and vectors are either susceptible or infectious and that both of their population sizes are constant (see Figure 1). Additionally, susceptible vectors only become infected through biting an infectious host, and susceptible hosts only become infected through the bite of an infectious vector. The model also assumes that each mosquito only needs a certain number of blood meals per unit time and that there are sufficiently many hosts present for each mosquito to always be able to find a meal. Therefore, the overall rate at which bites occur is proportional to the number of vectors but independent of the number of hosts. The following system of two differential equations describe the change in the number of infectious hosts and vectors:
where NV and NH are the total number of vectors and hosts, IV and IH are the number of infected vectors and hosts, respectively, k is the biting rate of the vectors, p is the probability that the bite of infectious vector will lead to the successful infection of a susceptible host, q is the probability that a susceptible vector which bites an infectious host will become infected, ξ is the rate at which infectious hosts recover, while δ is the mortality rate of infected vectors.
While the above two equations only describe the change in the number of infectious hosts and vectors, the change in the number of susceptible hosts and vectors is implicitly followed since host and vector population sizes are kept constant. Therefore, the mortality of infectious vectors immediately increases the number of susceptible vectors (Figure 1), accounting for the turnover in vector populations.
One of the most important characteristics that can be used to describe pathogens is the basic reproductive ratio R0 (Diekmann et al. 1990). It may be defined as the number of secondary infections that a single infectious individual will initiate on average in a population of completely susceptible hosts. It is a threshold quantity in the sense that R0 < 1 means that a single infectious host will typically infect less than one susceptible host during its infectious period (i.e., some infectious hosts infect none and some infect one or more), leading to the eventual extinction of the pathogen from the host population. Such pathogens are unable to invade the susceptible host population. Conversely, hosts infectious with pathogens that have R0 > 1will on average infect more than one susceptible host, leading to the spread of the pathogen in the host population (i.e., an epidemic).
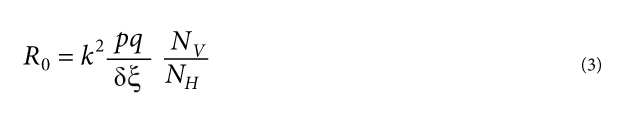
The basic reproductive ratio can be calculated for the Ross-Macdonald model presented above (Eq. 1-2) as follows (Keeling & Rohani 2007). Starting with a single infectious mosquito, one calculates the number of susceptible mosquitoes that become infected indirectly through the infection of susceptible hosts. The average number of hosts that the single infectious mosquito infects in a completely susceptible host population, based on Eq. 1, is kp/δ, which does not depend on the size of the available host population. One of these hosts that become infectious will in turn infect on average (kqNV) / (ξNH )susceptible mosquitoes that bite them. In order to calculate the basic reproductive number for a vector-borne pathogen, one multiplies the number of newly infected hosts with the number of mosquitoes that each infects, assuming that each infected host on average infects the same number of mosquitoes:
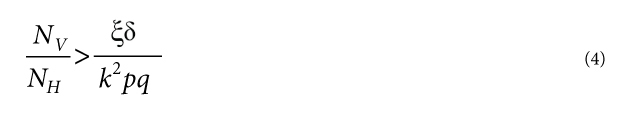
An important feature of the above equation is the biting rate of vectors, k, which factors into the basic reproductive ratio squared, since vectors need to bite once to acquire infection and then again to infect a susceptible host. Consequently, any increase or reduction of the biting rate of infectious vectors will affect the spread of the pathogen disproportionately (Lloyd et al. 2007). This explains the profound success of simple interventions, such as bed-nets, that reduce the biting rate of infectious vectors, in decreasing the burden of vector-borne diseases such as malaria. Another notable feature is the proportion of the total number of vectors and hosts, which is directly proportional to the basic reproductive ratio (Figure 4), implying that reducing the vector population can control vector-borne pathogens. Since the pathogen will not be able to invade and persist unless its basic reproductive ratio exceeds one, vector control may be successful in preventing and halting disease spread even when the vector population is not completely extinct (Focks et al. 2000). For successful control, the vector population has to be reduced only below the entomological threshold:
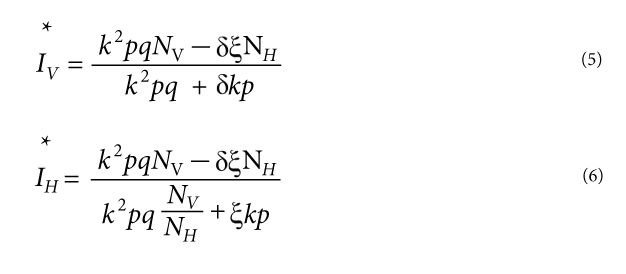
Another feature of the Ross-Macdonald model is the existence of an endemic equilibrium. Specifically, if R0 > 1, (Eqs. 1-2) have an equilibrium where the number of infectious hosts and vectors remain constant following an initial transient period at the following values:
Inspection of these equations shows that decreasing the vector-host ratio by vector control will, in addition to decreasing the basic reproductive ratio of the pathogen, also decrease the equilibrium number of infectious hosts and vectors (Figure 4). In fact, this equilibrium number will approach zero rapidly, and become quite small even before R0 < 1 as the pathogen is unable to persist in the population. Therefore, vector control will simultaneously decrease disease prevalence and protect the population from the re-invasion of the pathogen. An important further point, however, is that if vector control is relaxed after the pathogen has been eliminated from the population, the vector population may grow again above the entomological threshold. At this point, R0 > 1 and the pathogen can successfully re-invade the susceptible host population. This is what happened with dengue viruses in South America. Vector control campaigns in the 1960s eliminated the vector Aedes aegypti in 16 countries (Guzman & Kouri 2003). However, following the eradication of dengue virus, the vector re-established itself from countries in Central America and the United States in the 1970s. The resurgence of the vector subsequently allowed the reintroduction of dengue viruses in Central and South America, starting in the 1980s, so that it is now the most important arboviral disease worldwide (Kyle & Harris 2008).
Figure 4
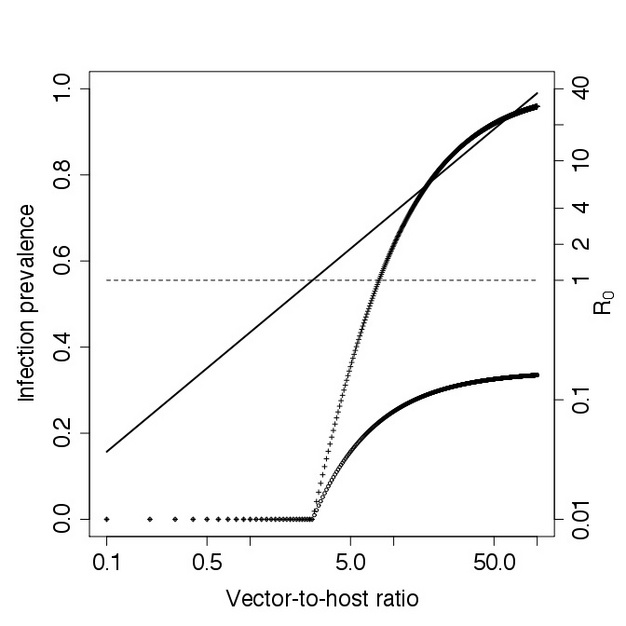
Infection prevalence and R0 with increasing vector-to-host ratio in the Ross-Macdonald model, assuming: k=0.5, p=0.2, q=0.15, δ=1/7, ξ=1/7. The total number of hosts was kept constant at NH=100. The solid line represents the basic reproductive ratio R0. The dashed line separates the region in which the pathogen is unable to invade the host population (R0 < 1) from the region in which the pathogen successfully invades (R0 > 1). Using these parameters, the threshold of R0 = 1 corresponds to a vector-to-host ratio of 2.6. Open circles represent the proportion of infectious vectors, while the plus signs show the proportion of infectious hosts, respectively. Note the log scale for the vector-to-host ratio and the basic reproductive ratio.
© 2013 Nature Education All rights reserved.
The simple Ross-Macdonald model demonstrated above is typically not sufficient to describe the biology of the hosts, vectors, and pathogens in adequate detail. Therefore, several extensions and modifications have been employed for specific disease systems. For example, most vector-borne pathogens have to get from the host blood-meal in the midgut to the salivary gland for successful transmission to the next host, during which they sometimes transform and specialize into other cell types (e.g. malaria). The time required for this to happen is called the extrinsic incubation period (EIP), and is of the order of a week for most pathogens. Consequently, mosquitoes have to survive this period in order to be able to transmit the pathogen. Entomopathogenic fungi, such as Metarhizium anisopliae and Beauveria bassiana, increase the daily mortality rate of mosquitoes when applied as a control method, decreasing the proportion of mosquitoes that survive the EIP, leading to reduced human transmission risk (Scholte et al. 2005). Another important extension of the Ross-Macdonald model concerns the population dynamics of hosts and vectors themselves. By relaxing the assumption of a constant host and vector population and incorporating the birth and survival of vectors and hosts, we are able to incorporate cycling and seasonality into these epidemiological models.
Epidemiological implications of interactions between vectors and their environment
The Ross-Macdonald model presented above demonstrates the interactions between hosts, vectors, the pathogens they transmit, and their environment, that is fundamental to the population dynamics of vector-borne diseases. The deeply ecological nature of these interactions has a number of epidemiological implications. Since most vectors are ectothermic arthropods, they are sensitive to changes of the abiotic environment. For example, both the developmental rate and the survival of mosquito larvae increases with water temperature (Gilpin & McClelland 1979). While it is true that high temperatures are detrimental to mosquito survival, the relationship is asymmetric in the sense that survival rate increases with temperature over a large interval, and only decreases above extreme values. Similarly, the development rates of pathogens tend to increase with increasing temperatures. Most arthropod vectors are very sensitive to desiccation, making humidity another important aspect of the abiotic environment. These strong dependencies between multiple components of the transmission cycle of vector-borne pathogens and the abiotic environment make it likely that climate change will affect the population dynamics of vector-borne diseases. There is an ongoing controversy on this topic where some studies have extrapolated the current distribution of vector-borne pathogens to future climate projections, finding potentially extensive range expansions. Critics argue that these studies do not adequately consider regional differences in the distribution of potential hosts, vectors, and other geographic and societal differences (Martens et al. 1995). As an example, malaria has been recently documented to spread to higher altitudes in the East African highlands, where it has been absent during the last 30 years (Alonso et al. 2010). However, establishing the causality between climate change and this expansion of malaria has been complicated, because many other factors have also changed during the same period (e.g. human population density, urbanization, land-use land-cover, and public health interventions) (Gething et al. 2010).
Another consequence of the inherent sensitivity of vectors and pathogens to abiotic conditions is high uncertainty in predicting the fine-scale spatio-temporal dynamics of vector-borne pathogens. For example, the transmission risk of a particular pathogen to humans in a specific area depends on the number of mosquitoes that bite people, the prevalence of the pathogen in those mosquitoes, and the competence of the mosquito species present in transmitting the infection. The number of mosquitoes and their community composition depend both on the prior abiotic conditions and the characteristics of a particular habitat. The prevalence of the pathogen depends on the prior dynamics of the pathogen in the hosts and vectors present in the area. These complex dependencies make predictions of changes in abundance of vector-borne pathogens very difficult.
Another consequence of the inherent sensitivity of vectors and pathogens to abiotic conditions is high uncertainty in predicting the fine-scale spatio-temporal dynamics of vector-borne pathogens. For example, the transmission risk of a particular pathogen to humans in a specific area depends on the number of mosquitoes that bite people, the prevalence of the pathogen in those mosquitoes, and the competence of the mosquito species present in transmitting the infection. The number of mosquitoes and their community composition depend both on the prior abiotic conditions and the characteristics of a particular habitat. The prevalence of the pathogen depends on the prior dynamics of the pathogen in the hosts and vectors present in the area. These complex dependencies make predictions of changes in abundance of vector-borne pathogens very difficult.
For some vector-borne diseases, which infect multiple hosts, the ecologies of other species may be important too. In the case of such multi-host pathogens, each host contributes to the overall dynamics of the pathogen, depending on the availability and the competence of each host to the pathogen. For example, Borrelia burgdorferi, the spirochaete that causes Lyme disease in humans, can infect white-footed mice (Peromyscus leucopus), red and grey squirrels (Tamiasciurus hudsonicus and Sciurus carolinensis), white-tailed deer (Odocoileus virginianus), and humans, among others. While white-tailed deer and humans are 'dead-end' hosts that do not contribute to further transmission of the Borrelia pathogen, other hosts can all contribute to the transmission of Borrelia to susceptible ticks to some degree (LoGiudice et al. 2008). In order to eliminate the transmission risk of Lyme disease to people in the area, we have to break the multiple transmission cycles corresponding to each potential host.
In summary, the ecological nature of vector-borne pathogens have profound epidemiological implications, which are inherently difficult to elucidate due to the complex dependency between the population dynamics of vector-borne pathogens and the population dynamics of vectors and hosts and their environment. The epidemiological implications of the ecological nature of vector-borne pathogens make it necessary to understand the population dynamics of vector-borne diseases in order to predict and control these diseases. Despite all the challenges involved, the significant global health burden and economic loss due to vector-borne pathogens in humans, livestock, and crops make this endeavor crucial.References and Recommended Reading
Alonso, D. et al. Epidemic malaria and warmer temperatures in recent decades in an East African highland. Proceedings of the Royal Society of London B doi: 10.1098/rspb.2010.2020 (2010).
Bailey, M. T. J. The Biomathematics of Malaria. London, UK: Charles Griffin & Co. Ltd., 1982.
Center for Disease Control. Division of Vector-borne Infectious Diseases. Reported Cases of Lyme Disease by Year, United States, 1995-2009. Retrieved on March 11, 2011. (link)
Diekmann O. et al. On the definition and the computation of the basic reproduction ratio R0 in models for infectious diseases in heterogeneous populations. Journal of Mathematical Biology 28, 365-382 (1990).
Focks, D. A. et al. Transmission thresholds for dengue in terms of Aedes aegypti pupae per person with discussion of their utility in source reduction efforts. American Journal of Tropical Medicine and Hygiene 62, 11-18 (2000).
Gething, P.W. et al. Climate change and the global malaria recession. Nature 465, 342-345 (2010).
Gilpin, M. E. & McClelland, G. A. H. Systems analysis of the yellow fever mosquito Aedes aegypti. Fortschritte der Zoologie 25, 355-388 (1979).
Guzman, M. G. & Kouri, G. Dengue and dengue hemorrhagic fever in the Americas: lessons and challenges. Journal of Clinical Virology 27, 1-13 (2003).
Keeling, M. J. & Rohani, P. Modeling Infectious Diseases in Humans and Animals. Princeton, NJ: Princeton University Press, 2007.
Kyle, J. L. & Harris, E. Global spread and persistence of dengue. Annual Review of Microbiology 62, 71-92 (2008).
Laneri K. et al. Forcing versus feedback: Epidemic malaria and monsoon rains in Northwest India. PLoS Comput Biol 6, e1000898. doi:10.1371/journal.pcbi.1000898 (2010).
Lloyd, A. L. et al. Stochasticity and heterogeneity in host-vector models. Journal of the Royal Society Interface 4, 851-863 (2007).
LoGiudice, K. et al. Impact of host community composition on Lyme disease risk. Ecology 89, 2841-2849 (2008).
Macdonald, G. The Epidemiology and Control of Malaria. Oxford, UK: Oxford University Press, 1957.
Martens, P. et al. Potential impact of global climate change on malaria risk. Environmental Health Perspectives 103, 458-464 (1995).
May, R. L. & Anderson, R. M. Infectious Diseases of Humans: Dynamics and Control. Oxford, UK: Oxford University Press, 1991.
McKirdy, S. J. & Jones, R. A. C.
Quantification of yield losses caused by barley yellow dwarf virus in wheat and
oats. Plant Disease 86,
769-773 (2002).
Rich, K. M. & Wanyoike, F. An assessment of the regional and national socio-economic impacts of the 2007 Rift Valley fever outbreak in Kenya. American Journal of Tropical Medicine and Hygiene 83, 52-57 (2010).
Ross, R. The Prevention of Malaria. London, UK: John Murray, 1911.
Scholte, E.-J. et al. An entomopathogenic fungus for control of adult African malaria mosquitoes. Science 308, 1641-1642 (2005).
Surveillance for Lyme Disease. United States, 1992-1998. Morbidity and Mortality Weekly Report 49, 1-11 (2000).
Surveillance for Lyme Disease. United States, 1992-2006. Morbidity and Mortality Weekly Report 57, 1-9 (2008).
Tabachnick, W.J. et al. Bluetongue. Entomology and Nematology Department, Florida Cooperative Extension Service, Institute of Food and Agricultural Sciences, University of Florida, Gainesville, (2008). (link)
World Malaria Report 2010. World Health Organization. Retrieved from http://www.who.int/malaria/world_malaria_report_2010/en/index.html on March 11
2011.
World Health Organization. The global burden of disease: 2004 update. Retrieved from http://www.who.int/healthinfo/global_burden_disease/2004_report_update/en/index.html on March 11 2011.


