


« Prev Next »

The capacity of soil to regulate the terrestrial freshwater supply is a fundamental ecosystem service. Water percolating through soil is filtered, stored for plant utilization, and redistributed across flow paths to groundwater and surface water bodies. As such, the sustainability of water resources (considering both quantity and quality) is directly influenced by soil. Thus, most aspects of terrestrial- and freshwater aquatic-life depend on hydrologic processes in soil (O'Geen et al. 2010).
Water dynamics in soil are governed by many factors that change vertically with depth, laterally across landforms and temporally in response to climate (Swarowsky, et al., 2011). This article focuses on soil water dynamics and introduces concepts of soil moisture storage, water flow and the soil properties that influence these processes. The learning objectives discussed here include: 1) an introduction to the soil water balance equation; 2) the factors and soil properties that govern water potential and plant available water holding capacity; and 3) soil morphologic features and classification methods to describe the fate of water in soil. These concepts are integrated with a case study that describes the interplay between hydrologic processes, water dynamics in soil, and soil genesis.
Storage, Flow and Potential Energy
Stored water in soil is a dynamic property that changes spatially in response to climate, topography and soil properties, and temporally as a result of differences between utilization and redistribution via subsurface flow (Figure 1; Western et al. 1999). Changes in soil moisture storage can be generalized with a mass balance equation (eq. 1) as a result of the difference between the amount of water added and that which is lost (Hillel 1982). 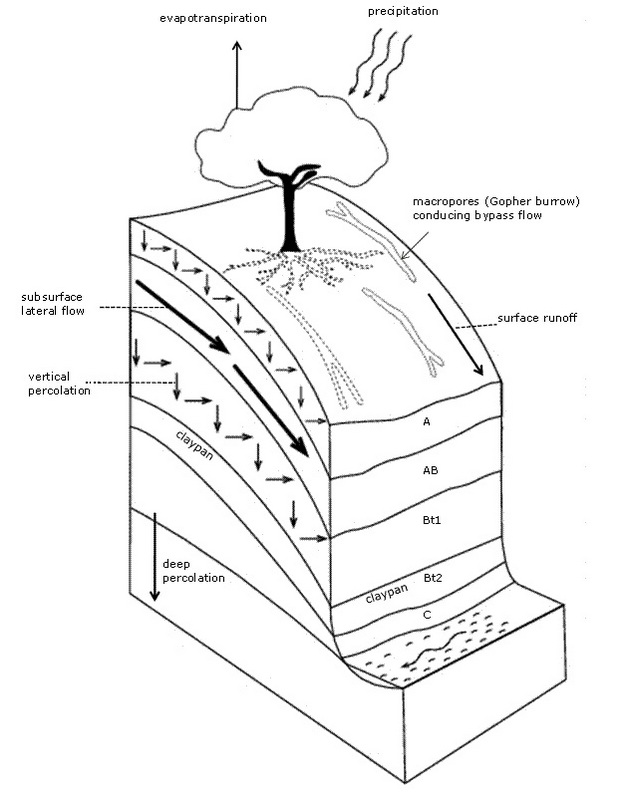

Change in soil moisture storage = inputs - outputs (eq. 1)
Water content increases (positive change in storage) when inputs including precipitation or irrigation exceed outputs. Water content decreases (negative change in storage) when outputs such as deep percolation, surface runoff, subsurface lateral flow, and evapotranspiration (ET) exceed inputs (eq. 1).
Figure 1
Conceptual diagram of a soil profile illustrating the multiple flow paths through which water moves through soil.
© 2013 Nature Education Modified from O’Geen et al. 2010. All rights reserved. 
Water storage and redistribution are a function of soil pore space and pore-size distribution, which are governed by texture and structure (Childs 1940). Generally speaking, clay-rich soils have the largest pore space, hence the greatest total water holding capacity. However, total water holding capacity does not describe how much water is available to plants, or how freely water drains in soil. These processes are governed by potential energy. Water is stored and redistributed within soil in response to differences in potential energy. A potential energy gradient dictates soil moisture redistribution and losses, where water moves from areas of high- to low-potential energy (Hillel 1982). When at or near saturation, soils typically display water potentials near 0 MPa. Negative water potentials arise as soil dries resulting in suction or tension on water allowing the soil to retain water like a sponge.
Three soil moisture states, saturation, field capacity and permanent wilting point are used to describe water content across different water potentials in soil and are related to the energy required to move water (or extract water from soil) (Figure 2). When the soil is at or near saturation the direction of the potential energy gradient is downward through the soil profile or laterally down slope. This mechanism of flow by the force of gravity occurs mainly in macropores. As the soil dries, field capacity is reached after free drainage of macropores has occurred. Field capacity represents the soil water content retained against the force of gravity by matric forces (in micropores and mesopores) at tension of -0.033 MPa (Figure 2). As water content decreases, soil matric potential decreases, becoming more negative, and as a result, water is held more strongly to mineral surfaces due to cohesive forces between water molecules and adhesive forces associated with water and mineral particles (capillary forces). Water held between saturation and field capacity is transitory, subject to free drainage over short time periods, hence is it is generally considered unavailable to plants. This free water is termed drainable porosity. In contrast, much of the water held at field capacity is available for plant uptake and use through evapotranspiration (Figure 2).
Figure 2
Water content and water potential at saturation, field capacity and permanent wilting point. The difference in water content between field capacity and permanent wilting point is plant available water. Drainable porosity is the amount of water that drains from macropores by gravity between saturation to field capacity typically representing three days of drainage in the field.
© 2013 Nature Education Adapted from Brady & Weil 2002 and McCauley et al. 2005. All rights reserved.
The point at which matric forces hold water too tightly for plant extraction (-1.5 MPa) is termed the permanent wilting point. The amount of water held between field capacity and permanent wilting point is considered plant available water (PAW) (Figure 2). Water held between these two states is retained against the force of gravity, but not so tightly that it cannot be extracted by plants. Mesopores and micropores supply most plant available water. Water held at potentials below permanent wilting point (< -1.5 MPa) is not available for use by most plants because it strongly adheres to mineral particles. Water held at permanent wilting point is associated with partially filled micropores and hydrated surfaces of soil particles (Figure 2).
Influence of Texture and Structure
Differences in soil properties (texture and structure) affect the water content at saturation, field capacity, and permanent wilting point. Texture and structure determine pore size distribution in soil, and therefore, the amount of PAW. Figure 3 illustrates how the magnitude of PAW changes with soil texture. Coarse textured soils (sands and loamy sands) have low PAW because the pore size distribution consists mainly of large pores with limited ability to retain water. Although fine textured soils have the highest total water storage capacity due to large porosity values, a significant fraction of water is held too strongly (strong matric forces/low, negative water potentials) for plant uptake. Fine textured soils (clays, sandy clays and silty clays) have moderate PAW because their pore size distribution consists mainly of micropores. Loamy textured soils (loams, sandy loams, silt loams, silts, clay loams, sandy clay loams and silty clay loams) have the highest PAW, because these textural classes give rise to a wide range in pore size distribution that results in an ideal combination of meso- and micro-porosity. Soil structure can increase PAW by increasing porosity. Soil depth and rock fragment content also affect water holding capacity because bedrock and rock fragments are assumed to be unable to hold plant available water and/or accommodate plant roots.
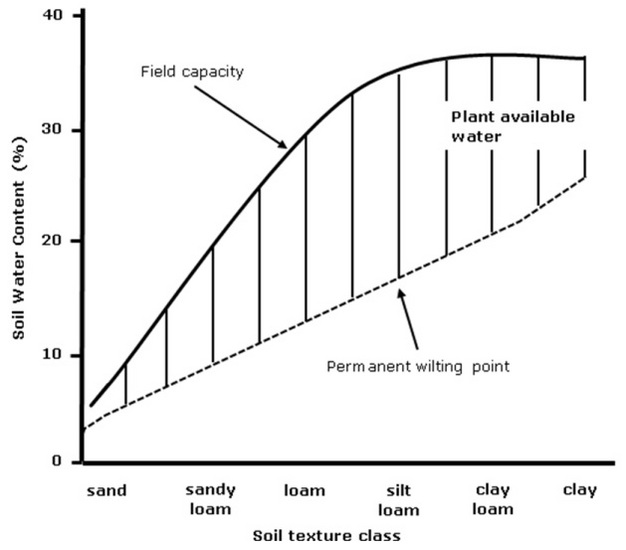
Figure 3
Generalized relationship between soil texture classes and plant available water holding capacity.
© 2013 Nature Education All rights reserved.
Water movement in soil is closely linked with storage because water potential is a function of water content (Richards 1931). Water flow is also influenced by texture and structure, and other factors such as the layering of soil profiles. The rate of water flow is a function of the potential energy gradient and the ease with which water is transmitted through soil, termed saturated hydraulic conductivity, which is governed by pore size distribution and tortuosity of flowpaths (Childs & Collis-George 1950, Vogel 2008). Clay-rich soils have low saturated hydraulic conductivity due to a highly tortuous flow path. Conversely, sandy soils have larger pores and lower tortuosity that facilitate rapid water flow. The National Cooperative Soil Survey identifies the following permeability classes based on soil texture (Table 1). These classes can be modified (qualitatively) by the degree of soil structure. Strong soil structure, consisting of very fine and fine aggregates (e.g., granular, fine and medium angular blocky and subangular blocky) facilitate rapid drainage of soil by increasing macroporosity. In contrast, weak structure or coarse-sized structural units (prismatic or blocky) and platy structure can inhibit flow, creating a more tortuous flow path constraining water to inter-structural voids (Figure 4). Soil structure is highly relevant to water management in soils because it is subject to change either through deterioration by improper management, or to improvement through additions of soil organic matter. In contrast, it is usually infeasible to change texture.
| Permeability Class |
Permeability (cm/hr) |
Textural class |
| Very slow | <0.13 | clay |
| Slow | 0.13–0.5 | sandy clay, silty clay |
| Moderately slow | 0.5–2.0 | clay loam, sandy clay loam, silty clay loam |
| Moderate | 2.0–6.3 | very fine sandy loam, loam, silt loam, silty clay loam, silt |
| Moderately rapid | 6.3–12.7 | sandy loam, fine sandy loam |
| Rapid | 12.7–25.4 | sand, loamy sand |
| Very Rapid | >25.4 | coarse sand |
| Table 1: Soil permeability classes and estimates of permeability rates by textural class. | ||
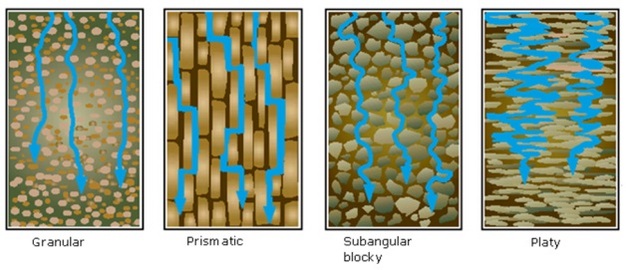
Figure 4
Water movement through different soil structure shapes.
© 2013 Nature Education Developed by USDA-NRCS. All rights reserved.
Drainage
The ease with which water drains from soil is equally as important as storage. For example, most terrestrial plants need to assimilate oxygen through roots, but oxygen is scarce in saturated soils. Moreover, microbial decomposition of organic matter is greatest (by orders of magnitude) under aerobic conditions. Poorly drained soils have limitations for a variety of land use practices. The recognition of poor drainage in soils is also used in wetland delineation efforts. 
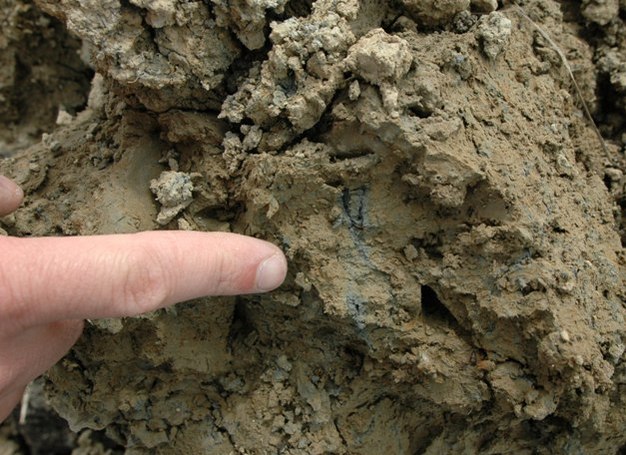
Drainage capacity can be identified through careful observation of soil properties. Poorly drained soils result in episodes of prolonged saturation, while excessively drained soils commonly experience water deficits. Soils that are saturated at times when the system is above biological zero (> 5° C) often develop redoximorphic features (Vepraskas & Sprecher 1997). The most common redoximorphic features in soil are iron and manganese concentrations and iron depletions (Figures 5 and 6). These features arise through microbial decomposition of soil organic matter under anaerobic conditions. Anaerobic conditions arise because the diffusion of oxygen in saturated soil is very slow and does not keep up with oxygen demands of aerobic respiration by microbes. When oxygen is depleted, facultative microbes utilize iron (Fe 3+) and manganese (Mn4+) as terminal electron acceptors to make energy. In doing so, these elements are reduced and become soluble in soil solution. As water mobilizes these soluble constituents they eventually encounter air (e.g., in root channels or other macropores) where they oxidize and re-precipitate as iron and manganese concentrations (Figures 5 & 6). Iron concentrations are usually rust colored, red or orange. Manganese concentrations are gunmetal blue, almost black (Figure 6). Redox depletions arise in microsites of extreme reducing conditions where Fe3+ has been completely removed. Redox depletions are typically dull in color (low Munsell chroma usually 2 or less for taxonomic purposes) and have blue, green, pale brown or yellow hues that reflect the coloration of primary minerals (Figure 7). The depth at which redoximorphic features occur is used to describe the extent of saturated conditions within a soil profile (Jacobs et al. 2002).
Figure 5
Iron redox concentrations in the form of rusty orange pore linings.
© 2013 Nature Education All rights reserved.
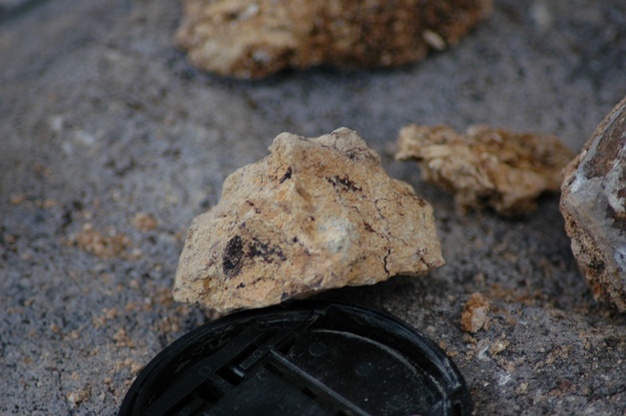
Figure 6
Gunmetal blue manganese redox concentrations in the form of ped surface coatings and pore linings. Note 35 mm lens cap at base of photo for scale.
© 2013 Nature Education All rights reserved.
Figure 7
Example of pale bluish gray redox depletions. Note the faint rusty orange concentration distributed throughout the soil matrix.
© 2013 Nature Education All rights reserved.
The National Cooperative Soil Survey describes five soil drainage classes determined by the rate at which water drains from soil and the height of the water table during the growing season (Table 2). Drainage classes are used for a variety of land-use decisions such as soil suitability for groundwater banking, land application of wastes, engineering and construction, septic system development, crop selection, land capability classification and wetland habitat.
| Drainage Class |
Water Removed |
Redoximorphic features |
Water table Height (m) |
| Excessively drained | Very rapid | None | >1.5 |
|
Somewhat excessively drained |
Rapid | None | >1.5 |
|
Well drained |
Readily not rapidly |
Below 1 m |
1.0–1.5 |
|
Moderately well drained |
Somewhat slowly |
Below 0.5 m |
0.5–1.0 |
|
Somewhat poorly drained |
Slowly |
Below 0.25 m |
0.25–0.5 |
|
Poorly drained |
Very slowly |
Gleyed or at or near soil surface |
<0.25 |
|
Very poorly drained |
Persistent saturation throughout the growing season | ||
|
Table 2: Diagnostic features and conditions of soil drainage classes. | |||
Timing of Inputs
The amount and timing of precipitation ultimately governs soil moisture content, availability and flow. The temporal nature of moisture dynamics dictates ecosystem response and land-use decisions. Soil moisture regimes are used in Soil Taxonomy to describe annual variability in moisture as dictated by climatic factors and indirectly by soil and landscape factors. There are five general soil moisture regimes: aquic, udic, xeric, ustic, and aridic. These moisture regimes have detailed definitions (Soil Survey Staff 1999). General working definitions are described below. 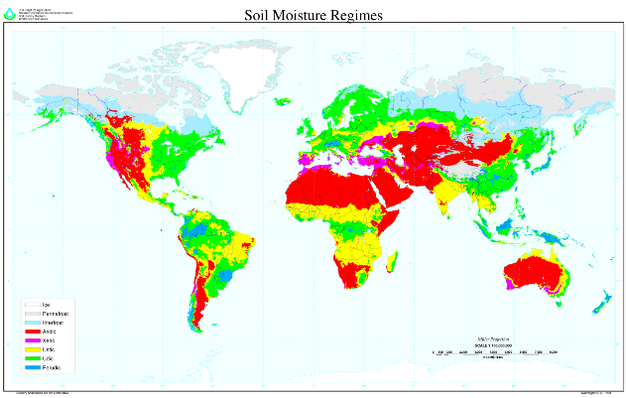
Aquic - poorly drained soils that are saturated when the soil temperature (at 50 cm) is above biological zero (>5°C). These soils typically display evidence of prolonged saturation in the form of redoximorphic features in the root zone.
Udic - soils typical of humid or tropical environments that receive an even distribution of precipitation throughout the year. Soils are never dry for as long as 90 cumulative days or 60 consecutive days following summer solstice.
Ustic - soil moisture conditions intermediate between aridic and udic and typical of semiarid, tropical and monsoon climates, where soil is moist during part or all of the growing season followed by a prolonged dry season at some point in the year.
Xeric - a soil moisture regime with wet winters and dry summers typical of Mediterranean type climates.
Aridic - a soil moisture regime that is dry (low plant available water) for most times of the year.
Figure 8 depicts these soil moisture regimes across the globe. Soil moisture regimes serve as a broad scale planning tool to inform a variety land use decisions related to the hydrologic cycle such as, regions suitable for groundwater banking, dryland agriculture, summer fallow, or requiring irrigation technology, engineering considerations, and drainage infrastructure. These decisions cannot be made from climatic conditions alone. Soil moisture regimes are more useful in this type of decision making because it accounts for how soil properties (such as PAW) affect moisture dynamics within the soil profile.
Figure 8
Global map of soil moisture regimes.
© 2013 Nature Education Developed by USDA-NRCS, Soil Survey Division, World Soil Resources, Washington, DC. All rights reserved.
Integrative Case Study
The type of soil moisture regime can be used to infer the direction of water movement in soil, which affects soil development and morphology. The following case study illustrates this point. Figure 9 shows two soils, Mollisols (Xerolls and Ustolls) with 450 mm of mean annual precipitation that differ in the timing of precipitation (i.e., the soil moisture regime). Mollisols are typically described as grassland soils that have large stocks of below ground soil organic matter. The Ustoll is a Mollisol with an ustic soil moisture regime that formed in a bunchgrass prairie east of the Rocky Mountains (Figure 9a). The Xeroll is a Mollisol with a xeric soil moisture regime that formed in a bunchgrass prairie on the Columbia Plateau in eastern Washington (Figure 9b). These soils share similarities in soil forming factors including parent material, vegetation, age, and topography. The notable difference between these two profiles is the nature of the B horizons (subsurface zones of accumulation of clay, salts or iron). The Ustoll has a Bk horizon, which is a zone of accumulation of calcium carbonate (CaCO3) (Figure 9a). This semi-soluble salt tends to accumulate in subsoils where deep percolation is minimal (Jenny 1994). The Xeroll has a Bw horizon, a subsoil where salts have been removed by deep percolation and the development of soil structure and slight accumulation of clay are detectable.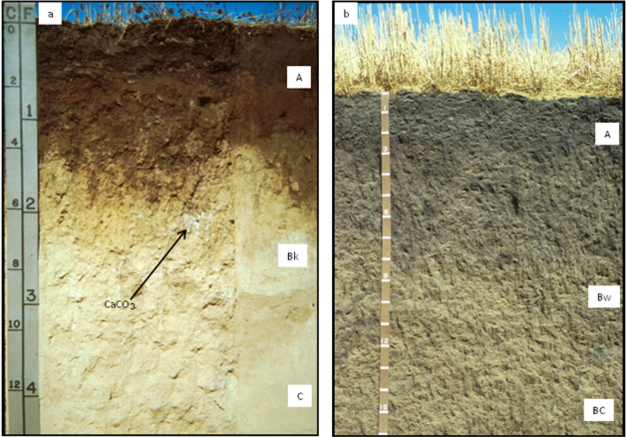

Figure 9
Examples of Mollisols (grassland soils) formed from loess. Both soils have mean annual precipitation of 450 mm. The Ustoll (a) has an ustic soil moisture regime and the Xeroll (b) has a xeric soil moisture regime. Note the presence of calcium carbonate filaments and masses throughout the Bk horizon of the Ustoll (a).
© 2013 Nature Education All rights reserved.
Potential evapotranspiration and precipitation over time in these soils illustrate the effects of timing of rainfall on soil moisture dynamics (Figure 10). In the Xeroll, precipitation is low during the growing season facilitating a period of utilization of stored water during the early growing season followed by a prolonged deficit (Figure 10a). Soil moisture is recharged at the onset of fall rains when the dormant season begins. As precipitation continues throughout the winter months a surplus is achieved. Surplus occurs when soils become saturated and water is allowed to freely drain with the force of gravity. A surplus in soil moisture results in the loss of free water stored between saturation and field capacity, which is subject to gravitational flow. In this scenario there are two main flowpaths: 1) deep percolation of free water beyond the root zone, and 2) losses of stored water by ET during the growing season. The large proportion of surplus water present during the winter months when plants are dormant facilitates the leaching of soluble and semi-soluble salts out of the soil profile and into the groundwater.
Figure 10
Climatic information and soil water balance for an Ustoll (a) and Xeroll (b). Note that the Ustoll never reaches a surplus condition, free drainage of saturated macropores.
© 2013 Nature Education All rights reserved.
In the Ustoll, most precipitation occurs during the growing season and is utilized through transpiration until a soil moisture deficit occurs (Figure 10b). As evapotranspiration decreases during the dormant season, soil recharge occurs, but precipitation is not high enough at this time to create a surplus. As a result, soil moisture is stored over the dormant season (winter months) and the major flow path is upward via capillary rise as plants become active in spring, extracting water by evapotranspiration. The absence of a surplus results in incomplete leaching of the soil profile and the accumulation of semi soluble salts (white coatings), as symbolized by the Bk horizon (Figure 9a).
This comparison of ustic and xeric soil moisture regimes provides an example of how soil moisture dynamics and timing of precipitation govern water utilization and movement in soil. Timing of precipitation is equally as important as its magnitude when considering soil water dynamics. This case study demonstrates that the fate of water in soil (e.g., deep percolation or evapotranspiration) governs the expression of soil morphologic features. Thus, soil features can be used to infer hydrologic processes.
Summary
Water storage dynamics and flow facilitate the four basic soil forming processes: translocations, transformations, additions and losses of soil constituents in a soil profile. These processes determine the chemical, morphological and physical properties of soil such as the variation of texture with depth. Hydrological processes active in soil contribute to weathering processes, and indicators of these processes are preserved by the soil profile in the form of observable and measurable soil characteristics, similar to those discussed in the case study (O'Geen et al. 2002). Other soil morphologic indicators of hydrologic process include redoximorphic features, abrupt accumulation of clay in the subsoil, development of soil structure, and presence of cemented layers (Fritsch & Fitzpatrick 1994). Thus soil resource inventories (e.g., soil survey), which document soil properties, can be used to infer hydrologic processes.
Although climatic factors ultimately control plant-water relationships, soils regulate water acting as a sponge to hold water against gravitational forces in plant available form. Soil properties such as texture and structure govern pore size distribution, which dictates total water storage, available water holding capacity, and water movement in soil. While it is generally not feasible to modify soil texture to improve plant-water relationships, soil structure can be enhanced by adding organic matter to promote more meso- and macro-porosity, which increases plant available water holding capacity and helps to promote free drainage. An understanding of soil water relationships is fundamental to most land use decisions.
Glossary
B horizon: Subsurface soil horizons that are zones of accumulation of soil constituents (such as clay, iron, or salts).
Bk horizon: B horizons that display an accumulation of pedogenic calcium carbonate
Bw horizon: B horizons that display the initial stages of pedogenesis such as the development of soil structure, oxidation
Capillary forces: Water held by small pores due to cohesive attraction between water molecules and adhesive forces between water molecules and solids.
Evapotranspiration: The combined loss of water from evaporation from the soil surface and transpiration by plants (SSSA, 1997).
Field capacity: The soil water content after three days of drainage of a saturated soil. Described quantitatively as the soil water content after saturated soil is exposed to a suction pressure (e.g., drying by water removal) of -0.33 MPa.
Macropore: Pores ranging in size from >5000 to 75 µm (SSSA, 1997).
Micropore: Pores ranging in size from 30-75 µm (SSSA, 1997).
Mesopore: Pores ranging in size from 5-30 µm (SSSA, 1997).
Mollisols: Generally considered grassland soils having a surface layer (approximately 18 cm thick) that is friable, dark in color and with high soil organic carbon content.
Munsell chroma: A system used to describe soil color according to hue (spectral color), value (degree of lightness or darkness) and chroma. Chroma refers the intensity of color.
Percolation: The downward movement of water through soil (SSSA, 1997).
Permanent wilting point: Water content at which soil has dried to the point that plants begin to wilt. Described quantitatively as the soil water content after saturated soil is exposed to a suction pressure (e.g., drying by water removal) of -1.5 MPa.
Plant available water: Equals the water content at field capacity minus the water content at permanent wilting point.
Redoximorphic features (redox features): Soil features associated with prolonged or seasonal wetness that result from reduction and oxidation of iron and manganese.
Saturation: The soil water content at which all pore space is filled with water corresponding to a water potential of 0 MPa.
Saturated hydraulic conductivity: The ease with which water moves through soil when at a saturated state. The water flux of water per unit gradient of hydraulic potential (SSSA, 1997).
Soil organic matter: Soil organic matter consists of living microorganisms, weakly and/or partially decomposed residues and highly decomposed materials (humus).
Structure: The aggregation of sand, silt and clay particles into aggregates that are characterized by shape, size and degree of aggregate stability (SSSA, 1997).
Texture: The relative proportion of sand, silt and clay.
Ustoll: Mollisols with an ustic soil moisture regime.
Water potential: The amount of work that must be done per unit quantity of pure water to transport water over a defined distance.
Xeroll: Mollisols with a xeric soil moisture regime.
References and Recommended Reading
Brady, N. C. & Weil, R. R. The Nature and Properties of Soils, 12th ed. Upper Saddle River, NJ: Prentice Hall, 1999.
Childs, E. C. The use of soil moisture characteristics in soil studies. Soil Science 50, 239-252 (1940).
Childs, E. C. & Collis-George, N. The permeability of porous materials. Proceedings of the Royal Society, Series A 201, 392-405 (1950).
Fritsch, E. & Fitzpatrick, R. W. Interpretation of soil features produced by ancient and modern processes in degraded landscapes. I. A new method for constructing conceptual soil-water-landscape models. Austrailian Journal of Soil Research 32, 889-907 (1994).
Hillel, D. Introduction to Soil Physics. San Diego, CA: Academic Press, 1982.
Jacobs, P. M., West, L. T. & Shaw, J. Redoximorphic features as indicators of seasonal saturation, Lowndes County, Georgia. Soil Science Society of America Journal 66, 315-323 (2002).
Jenny, H. Factors of Soil Formation. New York, NY: Dover Publications, 1994.
McCauley, A., Jones, C. & Jacobsen, J. Soil and Water Management Module 1: Basic Soil Properties. Bozeman, MT: Montana State University Extension Service, 2005.
O'Geen, A. T. et al. Paleosols as deep regolith: Implications for recharge in a Palouse climosequence. Geoderma 126, 85-99 (2005).
O'Geen, A. T. et al. Research connects soil hydrology and stream water chemistry in California oak woodlands. California Agriculture 64, 78-84 (2010).
Richards, L. A. Capillary conduction of liquids through porous mediums. Physics 1, 318-333 (1931).
Soil Science Society of America. Glossary of Soil Science Terms 1996. Madison WI, 1997.
Soil Survey Staff. Soil Taxonomy A Basic System of Soil Classification for Making and Interpreting Soil Surveys. Agricultural Handbook No. 436. U.S. Government Printing Office Washington, DC, 1999.
Swarowsky, A., et al. Catchment-scale soil water dynamics in a Mediterranean-type oak woodland. Vadose Zone Journal, 10, 800-815 (2011).
Vepraskas, M. J. & Sprecher, S. W. "Overview of aquic conditions and hydric soils," in Aquic Conditions and Hydric Soils: The Problem Soils, eds. M. J. Vepraskas & S. W. Sprecher, SSSA Special Publication No. 50, (Madison, WI: SSSA and ASA, 1997) p. 1-22.
Vogel, H. J. A numerical experiment on pore size, pore connectivity, water retention, permeability, and solute transport using network models. European Journal of Soil Science 51, 99-105 (2000).
Western, A. W., Grayson, R. B. & Green T. R. The Tarrawarra project: High resolution spatial measurement, modeling and analysis of soil moisture and hydrological response. Hydrological Processes 13, 633-652 (1999).


