


« Prev Next »
The oceans take up CO2 from the atmosphere and are responsible for absorbing around a third of the CO2 emitted by fossil fuel burning, deforestation, and cement production since the industrial revolution (Sabine et al. 2004). While this is beneficial in terms of limiting the rise in atmospheric CO2 concentrations and hence greenhouse warming due to this CO2, there are direct consequences for ocean chemistry. Ocean acidification describes the lowering of seawater pH and carbonate saturation that result from increasing atmospheric CO2 concentrations. There are also indirect and potentially adverse biological and ecological consequences of the chemical changes taking place in the ocean now and as projected into the future.
What is Ocean Acidification?
When CO2 dissolves in seawater to produce aqueous CO2 (CO2(aq)) it also forms carbonic acid (H2CO3) (Eq. 1; Figure 1). Carbonic acid rapidly dissociates (splits apart) to produce bicarbonate ions (HCO3-, Eq. 2). In turn, bicarbonate ions can also dissociate into carbonate ions (CO32-, Eq. 3). Both of these reactions (Eqs. 2, 3) also produce protons (H+) and therefore lower the pH of the solution (i.e., the water is now more acidic than it was — recall that pH is the negative logarithm of the proton concentration or activity, -log10[H+]. Note, as illustrated in Figure 2, Ocean Acidification does not imply that ocean waters will actually become acidic (i.e., pH < 7.0).
CO2(aq) + H2O ↔ H2CO3 (1)
H2CO3 ↔ HCO3- + H+ (2)
HCO3- ↔ CO32- + H+ (3)
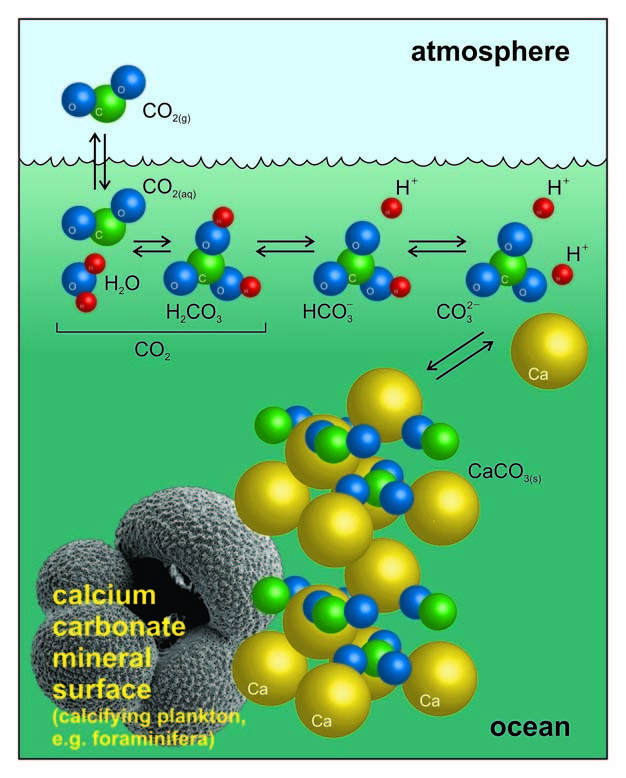
Figure 1: Dissociation of carbon dioxide in seawater.
Cartoon of the reactions described by Equations 1–3 plus the precipitation (or dissolution) of calcium carbonate. The scanning electron micrograph image (bottom left) is of the planktic foraminifer, Globigerina bulloides (about 0.5 mm long), which secretes a multi-chambered shell made of calcite (the more resistant-to-dissolution structural form of CaCO3 than coral aragonite).
© 2012 Nature Education Courtesy of Stephen Barker and Andy Ridgwell. All rights reserved. 
However, when CO2 dissoves in seawater it does not fully dissociate into carbonate ions and the number of hydrogen ions produced (and the drop in pH) is therefore smaller than one might expect. This is due to the natural capacity of seawater to buffer against changes in pH, which can be represented simply by:
CO2(aq) + CO32- + H2O → 2HCO3- (4)
where CO2 is effectively neutralized by reaction with CO32- to produce HCO3-. The HCO3- produced by Eq. 4 then partly dissociates (Eq. 3), releasing protons and so decreasing the pH-which is where the ‘ocean acidification' actually comes from-but this drop is much smaller than for an un-buffered system. One can also think of the sequence of events resulting from dissolving CO2 in seawater as firstly the production of HCO3- and H+, but because the equilibrium between HCO3- and CO32- (Eq. 3) has now been unbalanced by excess acidity (H+), Eq. 3 goes to the left to consume some of the excess H+, and in doing so, also consumes CO32-.
The total dissolved inorganic carbon (DIC) in seawater is defined as the sum of [CO2(aq)] + [HCO3-] + [CO32-]. The distribution of DIC between these species varies with seawater pH (Figure 2). Typically, the surface waters of today's ocean have a pH of around 8.1, meaning that HCO3- is the dominant carbonate species, representing about 90% of DIC. CO32- is the next most abundant species (~10% of DIC), while CO2(aq) represents less than 1% of DIC. Note that there is so little carbon in the form of carbonic acid (H2CO3) at any one moment in time, that the concentrations of CO2(aq) and H2CO3 are usually combined as [CO2(aq)] (also written: [H2CO3*]). All else being equal, as more CO2 is added to seawater the pH will slowly decrease and the balance between the three carbonate species will change, with [CO2(aq)] and [HCO3-] increasing and [CO32-] decreasing — this is the fingerprint of anthropogenic (human caused) ocean acidification.
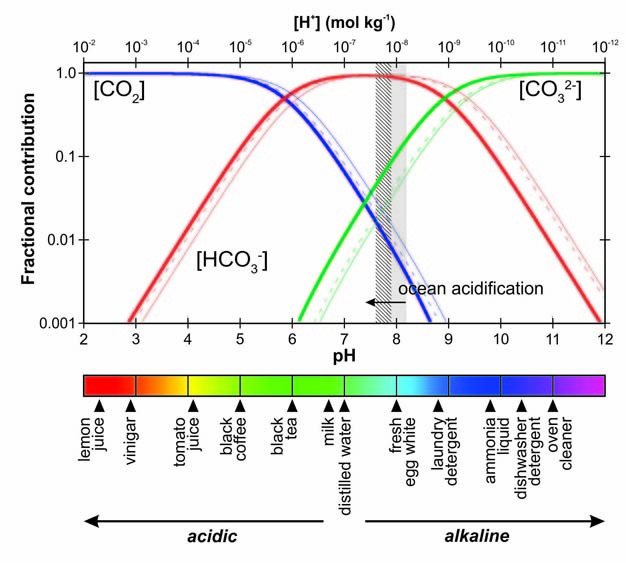
Figure 2: How ocean carbonate chemistry and pH are related.
Bjerrum plot showing the relative proportions of [HCO3-], [CO32-] and [CO2] to DIC in seawater with different temperature, salinity and pressure (heavy curves are for S=35‰, T=25ºC, P=0bar, narrow curves are S=35, T=0ºC, P=0bar, dashed curves are S=35, T=0ºC, P=300bar). The shaded region reflecting the range of modern (annual average) ocean surface, with the hashed region reflecting the corresponding projected year 2010 range: taken from the global ocean geochemistry model projections of Turley et al. (2010). To put ocean chemistry into some perspective, some common substances and their respective pH are shown at the bottom (scale is same as upper panel). pH values for foodstuffs are from Bridges & Mattice (1939), and for household products from (Hoffman et al. (1989). Note that different brands and preparations can give different pH values (up to ±0.5 pH units) — typical measured values are shown.
© 2012 Nature Education Reprinted with permission: Turley et al.; Bridges & Mattice; Hoffman et al. All rights reserved.
From the relations above it can be seen that the ability of seawater to buffer changes in its pH as CO2 is added depends on the amount (or concentration) of CO32- present. It is then intuitive that the buffering capacity of seawater will decrease as more CO2 is added and CO32- is progressively consumed. Because of this, the proportion of CO2 added to seawater that remains as CO2(aq) increases as more CO2 is added, an effect first recognised by Roger Revelle and Hans Suess (Revelle & Suess 1957) and quantified as the 'Revelle Factor'. The proportion of DIC present as CO2 is also affected by temperature, as illustrated in Figure 2. The consequence of this is that, as the ocean warms, less DIC will be partitioned into the form of CO2 (and more as CO32-), hence enhancing the buffering and providing a ‘negative feedback' on rising atmospheric CO2. Here, a feedback describes a mechanism that dimishes or amplifies an initial change and asribed the sign ‘negative' or ‘positive', respectively. For example, melting polar ice caps through global warming will reduce the amount of solar radiation that is reflected back out to space (the Earth's surface becomes less reflective), so producing more warming, which in turn will melt more ice, and so on — a positive feedback. A well-known positive feedback in the carbon cycle arises due to the decrease in solubility of CO2 gas in seawater at higher temperatures. In fact, this greatly outweighs the negative feedback described above, meaning that as the ocean surface warms, even more of the emitted fossil fuel CO2 will remain in the atmosphere.
Biological Implications of Ocean Acidification
Decreasing ocean pH has the potential to affect life in the ocean because all organisms must expend metabolic energy in maintaining a particular pH inside of their cells to ensure biochemical processes operate efficiently (Raven et al. 2005). Decreasing ocean pH also has rather more unexpected consequences — frequencies of sound, important for sonar and marine mammal (whale) communication, propagate more efficiently in waters with lower pH. This is because seawater borate ions (B(OH)4-), which absorb sound at these frequencies, become depleted with increasing absorption of CO2 by the ocean (Brewer & Hester 2009), in much the same way that carbonate ions (CO32-) are affected (as discussed earlier). However, we will focus here on the better studied — and potentially more serious — implications of ocean acidification for calcifying marine organisms.
The mineral calcium carbonate (CaCO3) is a fundamental building block for numerous marine organisms, from microscopic algae to reef-building corals. Its importance can be seen clearly in the geological record in the form of vast deposits of limestones and chalk rocks. However, this important structural material can dissolve under certain conditions, determined by the 'saturation state' (Ω) of seawater:
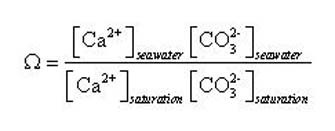
Here, the subscript 'seawater' refers to the in-situ concentration and 'saturation' refers to the concentration at mineral saturation, reflecting the equilibrium point between the tendency of ions dissolved in seawater to attach to the surface of the crystal surface (precipitation) and ions detaching from the surface to enter solution (dissolution), as illustrated in Figure 1. For our purposes, the concentration of Ca is relatively uniform and unchanging in the ocean, and hence Ω is principally a function of [CO32-] (Eq. 6).
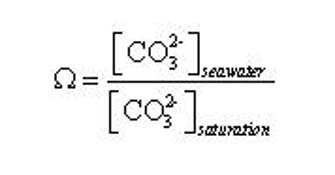
(6)
For supersaturated (Ω > 1) conditions, with an excess of [CO32-]seawater, a crystal of CaCO3 will tend to grow, and in undersaturated (Ω < 1) conditions, CaCO3 will dissolve. [CO32-]saturation is a weak function of temperature and salinity but a strong function of water depth (pressure) meaning that deeper waters are typically more corrosive. The particular crystal structure form of CaCO3 is also important — for example, for a given set of T,S,P conditions, [CO32-]saturation for aragonite is greater than that for calcite, and its saturation state will be lower. In other words, aragonite is a more soluble phase of CaCO3 than calcite, which has implications for the orgnaisms that construct shells and skeletons out of aragonite, as we'll discuss shortly.
We can see immediately from Eq. 6 that Ω will decrease as ocean acidification proceeds because we know that [CO32-]seawater will decrease (Figure 2). While modern surface ocean waters (where the majority of carbonate-secreting organisms live) are generally supersaturated (Ω > 1) with respect to both phases, there are regions of the ocean surface which are already close to undersaturation (Figure 3). The effect of pressure means that deep ocean waters are mostly undersaturated with respect to aragonite and, at great depths, also undersaturated with respect to calcite. The continued decrease in seawater [CO32-] means that the depth at which waters become undersaturated is shoaling (i.e., getting shallower) and will ultimately reach the surface in certain regions. Colder temperatures also mean a naturally lower initial saturation state, because atmospheric CO2 is more soluble in cold seawater (Figure 3). High latitude surface waters will therefore be some of the first to become undersaturated, later this century (Orr et al. 2005) — small, swimming sea snails, known as sea butterflies (Limacina) (Figure 3) that build fragile shells made from aragonite may be amongst the first to be impacted in these regions. Bottom-dwelling shellfish living in polar regions, or in more naturally acidic upwelling regions off western coasts (Figure 3), will also start to experience undersaturated conditions sooner than animals living elsewhere.
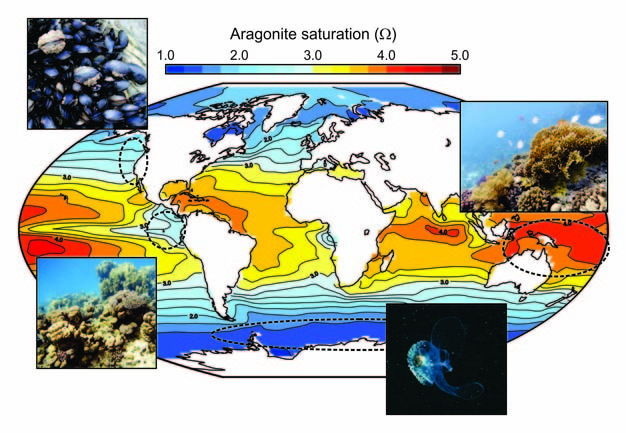
Figure 3: Carbonate chemistry properties of the ocean surface.
To illustrate spatial differences in the carbonate chemistry of the modern ocean surface, and hence which regions start from being already relatively close to under-saturation (a value of Ω less than 1.0), the model-reconstructed modern (year 2010) annual mean surface saturation with respect to aragonite is plotted. Representative calcifying organisms are shown as picture inserts (coral images courtesy of Ms Elena Couce) with typical habitat regions indicated by dashed ellipses (see Turley et al. 2010, for further analysis of seasonality and future trends).
© 2012 Nature Education Reprinted with permission: Turley et al., coral images courtesy of Elena Couce. All rights reserved.
It is not just the occurrence and spread of undersatured conditions that may cause problems. Thermodynamics tells us that the rate at which CaCO3 can be precipitated is also related to the saturation state (Ω) of that solution. How this affects calcifying organisms is difficult to predict however, because different species exert varying degrees of biological control on the calcification process. Still, logically, it requires more energy to precipitate the same amount of CaCO3 under conditions of lower saturation, and it is not unreasonable to expect some change in shells and skeletons as seawater Ω decreases in the future. Experiments carried out on cultured corals support this assertion and show a general decline in calcification rate with declining saturation (Pandolfi et al. 2011), but with considerable uncertainty in how non-linear the response might be and hence the sensitivty of tropical corals to ocean acidification. While it is highly unlikely that the tropical ocean will become undersaturated in the near future, because the surface seawater there starts with a relatively high degree of (over) saturation (Figure 3), once coral carbonate production drops below the rate at which CaCO3 is being lost due to physical and bio-erosion, the reef is in danger of being eroded away (Kleypas et al. 1999). It is notable that today, the poorly developed reefs of the Eastern Tropical Pacific are associated with relatively low saturation states (Figure 3; Manzello et al. 2008) — saturation states that reefs in the Western Tropical Pacific (such as the Great Barrier Reef) may start to experience before the end of the present century.
Other species, notably fast-growing, single-celled planktic marine algae such as coccolithophores, may be comfortable within a physically and chemically dynamic (seasonal) environment, and ocean acidification may not cause serious disruption. For instance, replacing one species of coccolithophore by a similar and also calcifying species may have little overall impact on the ecosystem and global biogeochemical cycles (Ridgwell et al. 2009, Ries et al. 2009).
Perspectives on Historical and Future Ocean Acidification
Computer models of the chemical changes associated with historical CO2 emissions predict that average surface ocean pH has dropped by about 0.1 units (equivalent to a ~25% increase in [H+]) since the dawn of the industrial age (i.e., the past 200 years or so). Continuing emissions into the future may drive a further decrease of 0.3 or 0.4 units by the end of this century (Orr et al. 2005) (Figure 4). By comparison, the change between glacial (ice age) and interglacial (similar to the current Holocene) conditions, when CO2 naturally alternated between lows (glacials) and highs (interglacials), was no more than 0.2 units (Hönisch & Hemming 2005) (Figure 4). Notably, ocean surface pH over the past almost one million years has tended to be higher and only very rarely significantly lower than pre-industrial times. Also geologically unusual is the rate at which ocean chemistry is currently changing. While the geological record is incomplete, sometimes difficult to interpret, and with the potential for as yet undiscovered surprises, we would probably have to go back at least 65 million years (the time at which the dinosaurs went extinct) to maybe find an ocean chemical change as fast as we are experiencing today (Ridgwell & Schmidt 2010. The rate of change is important as organisms with longer generation times and used to living and evolving in relatively stable environments such as cold water corals (e.g., Lophelia) (Maier et al. 2009) may be unable to adapt quickly enough if their environment changes very rapidly.
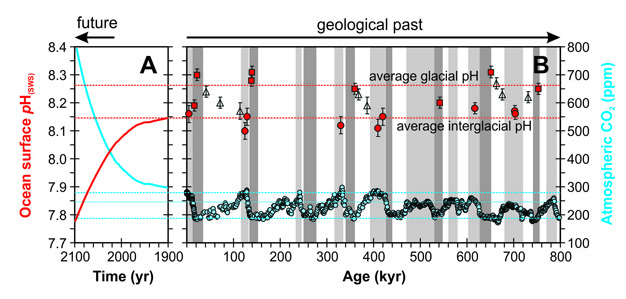
Figure 4: How historical and future ocean acidification compares with the geologic past.
Shown is a comparison of past records of CO2 and pH variability as compared to the projected impact of fossil fuel combustion. Panel B shows a reconstruction of ocean surface pH, based on the boron isotopic composition of carbonate foraminiferal shells (red symbols and axis) (Hönisch et al. 2009). The past 9 interglacial periods, with climatic characteristics generally similar to that of pre-industrial time (together with the current interglacial — the 'Holocene'), are shaded in light grey, with (8) ‘full’ glacial conditions in dark grey (definitions of the intervals of time assigned as ‘interglacial’ or (full) ‘glacial’ follow Masson-Delmotte et al. 2010). Filled circles represent measured ocean surface pH during interglacials, squares during interglacials, and empty triangles pH during intermediate climate conditions. The red horizontal dashed lines mark the mean values of the pH measurements falling within glacial (upper line) and interglacial (lower line) intervals. Also shown in Panel B is a composite record of atmospheric CO2 (blue symbols and axis) spanning the past 800,000 years (800 kyr), drawn from measurements made on air bubbles trapped in Antarctic ice cores (Petit et al. 1999, Monnin et al. 2001, Siegenthaler et al. 2005, Luthi et al. 2008). Dashed and dotted lines are shown only to illustrate different apparent CO2 thresholds here, and are not statistically derived. Panel A shows model-reconstructed historical changes plus a projection of future changes to the year 2100 both following Turley et al. (2010) on the same y-axis scales (for CO2 and pH), but with the time-axis magnified one thousand times. Here, the closely-spaced model projections of annual mean conditions each year between 1900 and 2100 have been interpolated to continuous lines.
© 2012 Nature Education Reprinted with permission: Hönisch et al.; Masson-Delmotte et al.; Petit et al.; Monnin et al.; Siegenthaler et al.; Turley et al. All rights reserved.
It is important to recognise that there may be winners as well as losers as a consequence of ocean acidification, either because some species may actually ‘prefer' lower pH, or because reductions in numbers of one species will leave more resources available for another. However, changes taking place in marine resources and the species we eat may be costly — or simply unpopular — to adapt to. Proposals to neutralise the acidity in the ocean and/or extract CO2 from the atmosphere (e.g., Kheshgi 1995) are currently at the drawing-board stage and likely to be more costly still. Natural processes will eventually act to re-set the chemistry of the ocean, but these processes — dissolution of carbonate sediments lying at the bottom of the ocean and the weathering of rocks on land — require many hundreds of thousands of years to occur (Ridgwell & Schmidt 2010).
References and Recommended Reading
Brewer, P. G. & Hester, K. Ocean acidification and the increasing transparency of the ocean to low-frequency sound. Oceanography 22, 86–93 (2009).
Bridges, M. A. & Mattice, M. R. Over two thousand estimations of the pH of representative foods. American Journal of Digestive Diseases 9, 440–449 (1939).
Eby, M. et al. Lifetime of anthropogenic climate change: Millennial time scales of potential CO2 and surface temperature perturbations. Journal of Climate 22, 2501–2511 (2009).
Hoffman, R. S. et al. Comparison of titratable acid/alkaline reserve and pH in potentially caustic household products. Clinical Toxicology 27, 241–261 (1989). doi:10.3109/15563658908994421
Hönisch, B. & Hemming, N. G. Surface ocean pH response to variations in pCO2 through two full glacial cycles. Earth and Planetary Science Letters 236, 305–314 (2005).
Hönisch, B. et al. Atmospheric carbon dioxide concentration across the Mid-Pleistocene transition. Science 324, 1551–1554 (2009).
Kheshgi, H. S. Sequestering atmospheric carbon-dioxide by increasing ocean alkalinity. Energy 20, 915–922 (1995).
Kleypas, J. A. et al. Geochemical consequences of increased atmospheric carbon dioxide on coral reefs. Science 284, 118–120 (1999).
Luthi, D. et al. High-resolution carbon dioxide concentration record 650,000-800,000 years before present. Nature 453, 379–382 (2008).
Maier, C. et al. Calcification of the cold-water coral Lophelia pertusa under ambient and reduced pH. Biogeosciences 6, 1671–1680 (2009).
Manzello, D. P. et al. Poorly cemented coral reefs of the eastern tropical Pacific: Possible insights into reef development in a high–CO2 world. Proceedings of the National Academy of Sciences of the United States of America 105, 10450–10455 (2008).
Masson-Delmotte, V. et al. EPICA Dome C record of glacial and interglacial intensities. Quaternary Science Reviews 29, 113–128 (2010). doi:10.1016/j.quascirev.2009.09.030
Monnin, C. et al. Barium geochemistry in sediment pore waters and formation waters of the oceanic crust on the eastern flank of the Juan de Fuca Ridge (ODP Leg 168), Geochemistry, Geophysics, Geosystems 2, U1–U15 (2001).
Orr, J. C. et al. Anthropogenic ocean acidification over the twenty-first century and its impact on calcifying organisms. Nature 437, 681–686 (2005).
Pandolfi, J. M. et al. Projecting coral reef futures under global warming and ocean acidification. Science 333, 418–422 (2011).
Petit, J. R. et al. Climate and atmospheric history of the past 420,000 years from the Vostok ice core, Antarctica. Nature 399, 429–436 (1999).
Raven, J. et al. Ocean Acidification due to Increasing Atmospheric Carbon Dioxide. London, UK: The Royal Society, 2005. (link)
Revelle, R. & Suess, H. Carbon dioxide exchange between atmosphere and ocean and the question of an increase of atmospheric CO2 during the past decades. Tellus 9, 18–27 (1957).
Ridgwell, A. & Schmidt, D. N. Past constraints on the vulnerability of marine calcifiers to massive carbon dioxide release. Nature Geoscience 3, 196–200 (2010).
Ridgwell, A. et al. From laboratory manipulations to Earth system models: Scaling calcification impacts of ocean acidification. Biogeosciences 6, 2611-2623 (2009).
Ries, J. B. et al. Marine calcifiers exhibit mixed responses to CO2-induced ocean acidification. Geology 37, 1131–1134 (2009).
Sabine, C. L. et al. The oceanic sink for anthropogenic CO2. Science 305, 367–371 (2004).
Siegenthaler, U. et al. Stable carbon cycle-climate relationship during the late Pleistocene. Science 310, 1313–1317 (2005).
Turley, C. et al. The societal challenge of ocean acidification. Marine Pollution Bulletin 60, 787–792 (2010).


