


« Prev Next »
What is Climate?
Every day, we note the weather: temperature, rain, cloud cover, wind and humidity. Climate is the long-term prevailing weather in an area and is largely determined by temperature and precipitation. The climate in a desert is hot and dry. The climate in the tropics is warm and wet. The climate of a particular area is the largest determinant to the life found there. Climate is a key focus in ecology.
Variations in climate include daily and seasonal cycles. Climatic variation also includes changes over several years, such as El Niño events, or even decades. Longer-term climate change occurs as a result of changes in intensity and distribution of solar radiation reaching Earth’s surface.
Sunlight Intensity Is a Key Component of Climate
Directly or indirectly, the sun provides energy for living organisms, and it drives our planet’s weather and climate patterns. Because Earth is spherical, energy from the sun does not reach all areas with equal strength. Areas that are exposed more directly to the sun’s rays (i.e. those nearest to the equator) receive greater solar input. In contrast, those in higher latitudes receive sunlight that is spread over a larger area and that has taken a longer path through the atmosphere. As a result, these higher latitudes receive less solar energy (Figure 1).
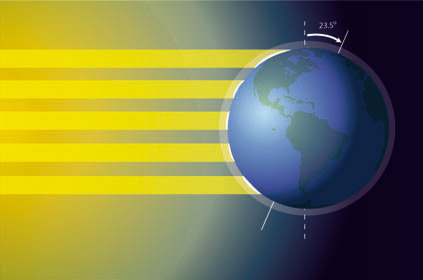
Figure 1: Variation in incident sunlight
Areas in the tropics receive sunlight directly. Regions further north and south receive incoming solar radiation at an angle, which reduces the heat and energy that reaches these areas.
© 2010 Nature Education All rights reserved. 
The sunlight intensity on some parts of the earth significantly varies over the course of the year as the earth changes its orientation in space. Seasonal variation in solar input occurs because the Earth is tilted on its axis by 23.5˚ (Figure 2). As Earth orbits the sun, its orientation to the sun changes. Winter in the northern hemisphere occurs as the northern tip of the planet tilts away from the sun; during this time, the southern hemisphere receives greater solar input and experiences summer. As Earth reaches the opposing point of its orbit and the northern hemisphere becomes angled toward the sun, the seasons reverse. Tropical areas experience relatively minor changes in temperature, and their seasons are characterized by the presence or absence of rain.
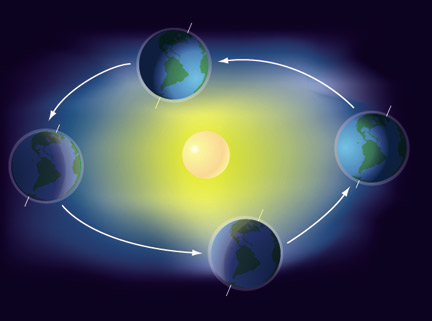
Figure 2: Seasonal variation in climate
As the northern hemisphere tilts toward the sun, it experiences summer; at the opposite end of Earth's orbit, the southern hemisphere receives greater solar input and experiences summer. Both hemispheres receive equal solar input at the spring and fall equinoxes.
© 2010 Nature Education All rights reserved.
Sunlight Intensity Affects Global Winds, Precipitation Patterns, and Ocean Circulation Which Are All Components of Climate
At the equator, the Earth receives greater exposure to the sun’s rays where both air and extensive bodies of water warm under the influence of the sun. Molecules are more closely packed together when cold than they are when warm, which makes warm air and water less dense than cold air and water. This difference in relative density causes heat to rise.
The warm air that rises in the tropics is wet. Sunlight causes water to evaporate from plants, soils, and bodies of water. These water molecules rise to become part of the air; because the air is warm and less dense, there is sufficient room for water molecules within the air mass. But as the air gains altitude it cools, reducing density and space for water. The water molecules condense to form clouds and eventually fall as precipitation (Figure 3).
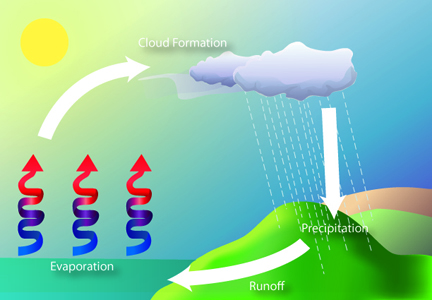
Figure 3: Evaporation, condensation, and precipitation cycles
Solar energy drives a cycle of evaporation, condensation, and precipitation.
© 2010 Nature Education All rights reserved.
At the same time as sunlight is driving evaporation and precipitation patterns, it is also creating winds. As warm air moves upward, colder air from neighboring areas rush in to fill the void left behind. Tropical air moves away from the equator and toward the poles. As it travels, it cools, becomes denser, and eventually descends around 30˚ north- or south-latitude. This dry air mass, having lost its moisture in the tropics, absorbs moisture from the ground, creating arid conditions at these latitudes. Some of the air is drawn back toward the equator, and some is drawn toward the pole as part of a new air mass. At latitudes around 60° north and south, the air again rises, cools and releases precipitation (though less than in the topics). Some of the cold, dry rising air then flows to the poles, where it absorbs moisture creating the cold climates of the polar regions (Figure 4).
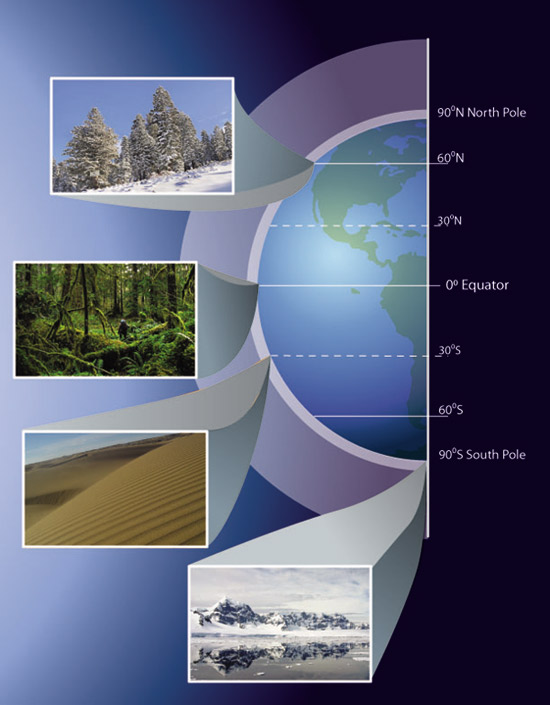
Figure 4: Air circulation and climate
Bands of cycling air carry moisture-laden air away from the tropics. Dry descending air at 30° latitude contributes to formation of deserts, while two additional cells of air create a band of moisture at 60° North latitude.
© 2010 Nature Education All rights reserved.
Winds are also generated by the rotation of the earth. Unlike the northern and southern direction of the winds described above, there are westward and eastward winds. These winds affect ocean currents. Warm, tropical waters carry heat pole-ward along the east coast of continents; cold water from the poles is forced toward the equator along the west coast. Warm surface currents can carry heat well away from the tropics, bringing temperate climates to areas nearer the poles than the equator.
Deeper currents are driven by a combination of Earth’s rotation and temperature differences between the tropics and the poles. Cold, dense melted water from the icecaps flows underneath warmer surface waters towards the equator.
The combination of wind and ocean currents redistributes heat and moisture across Earth’s surface. Around 60% of the solar energy that reaches the earth is redistributed around the planet by atmospheric circulation and around 40% by ocean currents.
Regional Climate Patterns
Proximity to large bodies of water influences climate on a regional scale. Coastal areas experience less seasonal variation in their climates than do continental interiors. Winters are milder, summers cooler, and the temperature swing between daytime high and nighttime low is much less extensive. This is partly due to the high heat capacity of water — its ability to hold heat for long periods of time and to release that heat when the atmosphere cools — and partly due to redistribution of heat by ocean currents (Figure 5).
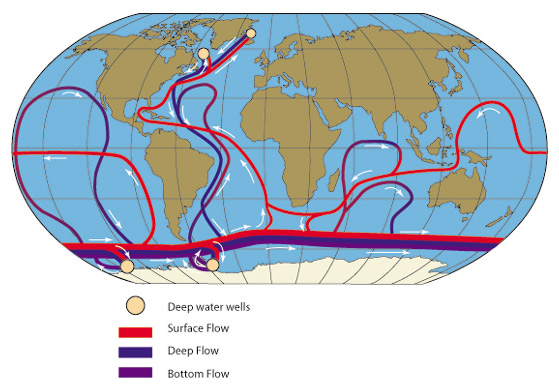
Figure 5: Global oceanic circulation
Ocean currents are driven by a combination of Earth's rotation and temperature differences between the topics and poles. Ocean currents vary on depths in which they flow, with denser pole melted waters flowing beneath warmer surface waters towards the equator.
© 2010 Nature Education All rights reserved.
Whereas most coastal regions experience high levels of precipitation, continental interiors are typically arid. Distant from large bodies of water, these areas lack sources of water to recharge moisture in the air. In addition, any air masses reaching them tend to have already discharged any moisture that they carried. This is particularly true of regions near mountain ranges. These physical barriers force air to rise and cool. Moisture is lost as precipitation on the windward side of the mountain.
As the drier air descends on the leeward side, it warms and absorbs moisture from the ground. Much less precipitation falls on the leeward side of the mountain range, or for some distance beyond it, creating a rain shadow (Figure 6). Some rain shadows create extremely arid, desert-like conditions, as occurs in the Gobi, Atacama, Mojave, and Sonoran deserts. Other rain shadows result in less pronounced drying; in these regions, grasslands tend to flourish, as in the Great Plains of North America and the Kazakh Steppe.
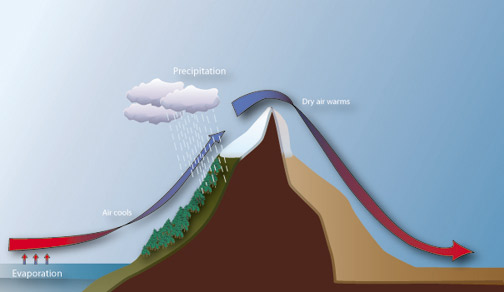
Figure 6: Creation of a rain shadow
Mountain ranges force air to rise along the windward side of the range; clouds form and precipitation falls. On the leeward side, dry air descends and warms. Little precipitation falls on this side, creating a rain shadow.
© 2010 Nature Education All rights reserved.
Microclimates
Although we tend to think of climate as affecting large regions of the earth, both temperature and moisture can vary on small spatial scales, which we refer to as microclimates. Microclimates are most often created by variation in the physical structure of an area, although they can also be created by vegetation. Even ground color can influence microclimate, as dark substrates absorb the sun’s rays, driving temperatures higher and promoting evaporation and drying. Each of these variables affects the types of organisms that can inhabit the area. Plants thrive in areas that provide optimal climatic conditions (temperature, sunlight, and moisture) for growth, and animals thrive in areas with appropriate resources, including vegetation. As a result, we see a strong relationship between climatic — or microclimatic — conditions and ecosystem structure.
The interaction between temperature and moisture creates climates on all levels of the spatial scale, and it is this interaction that limits the geographic ranges of plants, which in turn determine the geographic ranges of animals.
The interaction between temperature and moisture creates climates on all levels of the spatial scale, and it is this interaction that limits the geographic ranges of plants, which in turn determine the geographic ranges of animals.
El Niño-Southern Oscillation
Temporal changes in climate at small scales tend to be predictable: seasons occur consistently from year to year. However, changes may occur when oceanic currents and movement of air masses are disrupted. The best-known example of this phenomenon is the El Niño-Southern Oscillation (Figure 7).
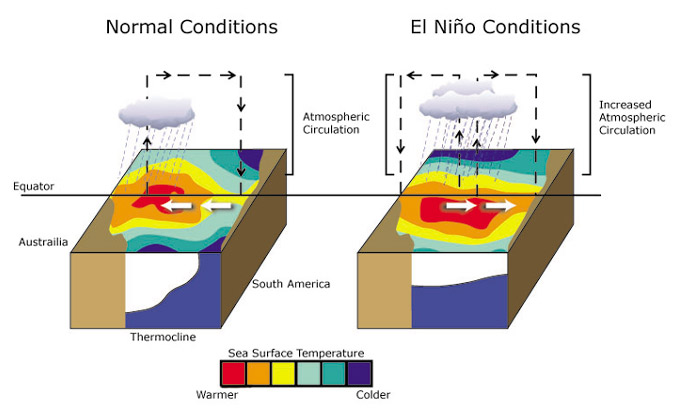
Figure 7: El Niño-southern oscillation
Under normal conditions, warm water pools in the western Pacific, but during an El Niño event, the heat covers most of the tropical Pacific.
© 2010 Nature Education All rights reserved.
During an El Niño event, the trade winds decrease, and the surface currents follow suit. Rather than pooling in the western Pacific, warm water covers much of the ocean surface in the tropics. This redistribution of heat leads to evaporation, condensation, and precipitation in the eastern Pacific and the Americas. The event is responsible for atypical flooding in North America, South America, even Europe, and for drought conditions in Australia, Indonesia, and parts of Africa.
Under abnormally wet conditions, terrestrial ecosystems can experience a population boom. Abundant precipitation may lead to unusually high availability of plant resources in typically arid regions, such as the Southwestern United States. With abundant resources, rodent populations increase over the course of a few months. In turn, the greater density of individuals increases predator population sizes and incidence of disease. Hantavirus outbreaks associated with deer mouse population explosions have been shown to co-occur with El Niño events.
At the same time, marine life is negatively affected by an El Niño event. The upwelling of water off the coast of Peru and Ecuador brings cold, nutrient-rich water to the area and sustains primary production by phytoplankton. These, in turn, sustain extensive food webs in the region. When an El Niño event cuts off the supply of nutrients, phytoplankton productivity declines. Loss of the main food supply depresses populations of fish, birds, and marine mammals, and these changes in population size can extend to regions far from the equatorial Pacific. Scientists are currently working to more reliably predict El Niño events, in hopes of ameliorating their negative impacts on human and non-human populations.
References and Recommended Reading
Becker, B. H. et al. Modeling the effects of El Niño, density-dependence, and disturbance on harbor seal (Phoca vitulina) counts in Drakes Estero, California: 1997–2007. Marine Mammal Science. 25, 1–18 (2009).
Campbell, N. A. & Reece, J. B. Biology, 7th ed. San Francisco, CA: Pearson, 2005.
Hjelle B. & Glass, G .E. Outbreak of hantavirus infection in the Four Corners Region of the United States in the wake of the 1997–1998 El Niño-Southern Oscillation. Journal of Infectious Disease 181, 1569–1573 (2000).
Molles, Jr., M. C. Ecology: Concepts and Applications, 3rd ed. Dubuque IA: McGraw-Hill, 2005.
National Academy of Sciences. El Niño and La Niña: Tracing the Dance of Ocean and Atmosphere (2000).
NOAA. Tropical Atmosphere Ocean Project El Niño Theme Page (2010).
Rosenberg, N. J. et al. Microclimate: the Biological Environment. Hoboken, NJ: John Wiley & Sons, Inc., 1983.
Stevens, G. C. The elevational gradient in altitudinal range: and extension of Rapoport's Latitudinal Rule to altitude. American Naturalist 140, 893-911 (1992).


