


« Prev Next »
Populations of organisms do not remain constant; the number of individuals within a population changes, sometimes dramatically, from one time period to the next. Ecologists have documented examples of such fluctuations in a wide variety of organisms, including algae, invertebrates, fish, frogs, birds, and mammals such as rodents, large herbivores, and carnivores.
Ecologists have long wondered about the factors that regulate such fluctuations, and early research suggested that resource availability plays an important role. Researchers found that when resources (food, nesting sites, or refuges) were limited, populations would decline as individuals competed for access to the limiting resources. Such bottom-up control helped to regulate the population around carrying capacity. More recently, scientists have discovered that predation can also influence the size of the prey population by acting as a top-down control. In reality, the interaction between these two forms of population control work together to drive changes in populations over time. Additional factors, such as parasites and disease can further influence population dynamics.
Population Cycles in a Predator-Prey System

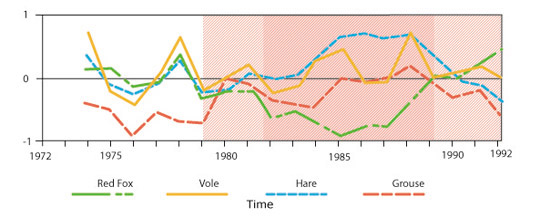
Figure 1: Population cycles in a Swedish forest community
The top figure (a) shows changes in population size for voles and small game. The striped arrows indicate years in which voles consumed tree bark as a marginal food. The bottom figure (b) illustrates how predator populations change in relation to prey abundance.
Grouse, hares, and voles feed on vegetation, and the availability of their preferred foods will influence the population size of each. The availability of food acts as a bottom-up control that affects population size. In years when their preferred food items are abundant, populations will grow. When preferred foods are scarce, individuals must turn to less desirable foods to prevent starvation. They grow more slowly, reproduce less, and populations decline. When vole populations peak and competition for food is strongest, they turn to bark as a marginal food, and this shift in foraging behavior coincides with a population decline (Figure 1a). Grouse and hare populations cycle in a manner comparable to those of voles, which suggests that food availability plays a role in regulating populations of these herbivores.
Foxes prefer to consume voles and other small rodents, but will occasionally eat grouse and hares when voles are less abundant. We would expect that the number of foxes in the population would increase as availability of their preferred food increases, and studies have demonstrated that this does, in fact, occur (Figure 1b). Owl populations cycle in a similar manner, closely following the abundance of voles.
As predator populations increase, they put greater strain on the prey populations and act as a top-down control, pushing them toward a state of decline. Thus both availability of resources and predation pressure affect the size of prey populations. We cannot easily determine the extent to which each of these controls drives population cycles in the Swedish boreal forest, because this system is not amenable to caging experiments, but studies show that food and predation work together to regulate population sizes.
Experimental Studies of Snowshoe Hare Populations
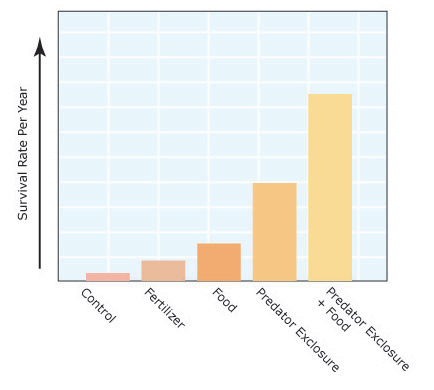
Figure 2: Outcome of the snowshoe hare field experiment
Average showshoe hare density increased under conditions of supplemental food and predator-removal. Density increased dramatically when both food and predation were modified.
Krebs and colleagues followed snowshoe hare populations on the nine plots over a course of eight years, through one population cycle in which the population peaked and declined on each study plot. At the end, they averaged the number of hares over the experiment. They found that blocks with supplemental food increased hare density three-fold, whereas fertilizer increased plant biomass on treated plots, but did not correspond to an increase in hares. These findings suggest that resource quality, rather than resource availability, acts as a bottom-up control on hare populations. The predator exclusion blocks increased the average density of hares two-fold, which supported the idea that hare populations were also controlled from the top-down through predation. The most striking finding of the study came from the plot that both excluded predators and had supplemental food supplies. This block experienced an 11-fold increase in average hare density relative to the controls (Figure 2). The researchers found that the increased density of hares was due to both higher survival and reproduction on the study plots.
Modeling Predator-Prey Interactions
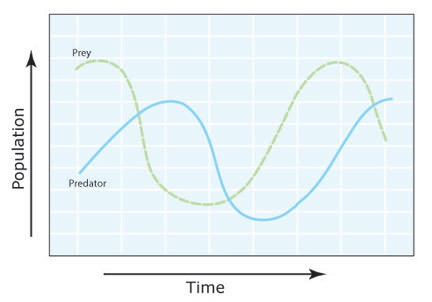
Figure 3: Graphical view of the Lotka-Volterra model
Predator and prey populations cycle through time, as predators decrease numbers of prey. Lack of food resources in turn decrease predator abundance, and the lack of predation pressure allows prey populations to rebound.
Lotka-Volterra models provide a useful tool to help population ecologists understand the factors that influence population dynamics. They have been particularly useful in understanding and predicting predator-prey population cycles. Although the models greatly simplify actual conditions, they demonstrate that under certain circumstances, predator and prey populations can oscillate over time (Figure 3) in a manner similar to that observed in the populations described above.
Foraging Behavior
Few systems oscillate in the cyclical manner of those described thus far. In reality, predator-prey systems are complex; they often involve multiple predators and multiple types of prey. What factors influence the type of prey an individual predator takes? What influences the foraging behavior of prey species? Under ideal circumstances, an individual will encounter high-quality food items on a regular basis. These preferred foods provide the most nutritional benefit with the fewest costs. Costs for an organism may be handling time (e.g., time required to catch prey or remove a nut from its shell) or presence of chemicals, such as tannins, that reduce the nutritional quality of the food item.
When preferred foods are scarce, organisms must switch to other, less-desirable alternatives. The point at which an organism should make this shift is not easy to predict. It depends upon many factors, including the relative abundance of each of the foods, the potential costs associated with each food, and other factors, such as the risk of exposure to predators while eating.
Consider the vole-fox system described in the first section. Field voles (Microtus agrestis) and bank voles (Clethrionomys glareolus) preferentially consume forbs and grasses, but they will turn to the bark from trees when their preferred foods become scarce. Bark contains poorer-quality nutrients than do grasses and forbs. In addition, voles must venture into the open to approach trees to feed on bark, making them more vulnerable to predation by foxes, which rely on sight to find their prey. Only when the preferred foods are very difficult to find—as occurs during times of population peaks—do voles switch to bark.
Increasing Complexity: Host-parasite Interactions
Thus far, we have focused on herbivore-plant interactions and predator-prey interactions, but parasites also play an important role in regulating populations of their hosts. The Francisella tularensis bacteria that cause tularemia are commonly found in both voles and hares in the Swedish boreal forest. Voles serve as a host species for F. tularensis and do not display symptoms of disease; however other species, such as mountain hares (Lepus timidus), do exhibit symptoms of tularemia when infected. Infection by these bacteria may play a role in the population cycles of these species (Figure 1b), though we currently lack data that demonstrate a causal link.
Other parasites, however, have been shown to impact the overall food web. The ectoparasite Sarcoptes scabiei is a mite that causes sarcoptic mange. In the late 1970s and early 1980s, mange infected red foxes in Sweden, decreasing the numbers of foxes in the community by approximately 70%. Erik R. Lindstrom and colleagues were surprised to discover that a decline in the fox population did not affect numbers of voles, which continued to oscillate as before. The fox population decline did, however, result in increased population sizes of mountain hares and grouse. S. scabiei reduced the strength of top-down control exerted by foxes on these prey species, which increased numbers of individuals in the prey populations and damped the 3-4 year oscillation in population size for each (Figure 4).
Parasites with complex life cycles require two hosts; in some of these systems, prey function as intermediate hosts for the parasite, with predators acting as primary hosts. Parasites can manipulate the behavior of the intermediate host to make transmission to the primary host more likely. These changes typically occur when the parasite is at a stage of its life cycle when it can successfully infect the primary host. Behavioral changes that favor parasite transmission often involve unusual foraging behavior on the part of the intermediate host: foraging in locations that make the individual more susceptible to predation by the primary host. As a result, parasites can change the size of prey populations during times of heavy infestation; as the parasites infect the primary host, predator populations may also decline.
Species interactions occur on many levels, as part of a complex, dynamic system in ecological communities. Predators, prey, plants, and parasites all influence changes in population sizes over time. Simple systems may undergo large, cyclical changes, but communities with more complex food webs are likely to experience more subtle shifts in response to changes in parasite load, predation pressure, and herbivory. Consider, however, that humans have impacted many ecological communities by removing predators or reducing the availability of resources. How will such changes affect population fluctuations in the rest of the community?
Other parasites, however, have been shown to impact the overall food web. The ectoparasite Sarcoptes scabiei is a mite that causes sarcoptic mange. In the late 1970s and early 1980s, mange infected red foxes in Sweden, decreasing the numbers of foxes in the community by approximately 70%. Erik R. Lindstrom and colleagues were surprised to discover that a decline in the fox population did not affect numbers of voles, which continued to oscillate as before. The fox population decline did, however, result in increased population sizes of mountain hares and grouse. S. scabiei reduced the strength of top-down control exerted by foxes on these prey species, which increased numbers of individuals in the prey populations and damped the 3-4 year oscillation in population size for each (Figure 4).
Figure 4: Population changes during a sarcoptic mange outbreak
Parasites with complex life cycles require two hosts; in some of these systems, prey function as intermediate hosts for the parasite, with predators acting as primary hosts. Parasites can manipulate the behavior of the intermediate host to make transmission to the primary host more likely. These changes typically occur when the parasite is at a stage of its life cycle when it can successfully infect the primary host. Behavioral changes that favor parasite transmission often involve unusual foraging behavior on the part of the intermediate host: foraging in locations that make the individual more susceptible to predation by the primary host. As a result, parasites can change the size of prey populations during times of heavy infestation; as the parasites infect the primary host, predator populations may also decline.
Species interactions occur on many levels, as part of a complex, dynamic system in ecological communities. Predators, prey, plants, and parasites all influence changes in population sizes over time. Simple systems may undergo large, cyclical changes, but communities with more complex food webs are likely to experience more subtle shifts in response to changes in parasite load, predation pressure, and herbivory. Consider, however, that humans have impacted many ecological communities by removing predators or reducing the availability of resources. How will such changes affect population fluctuations in the rest of the community?
References and Recommended Reading
Berven, K. A. Factors Affecting Population Fluctuations in Larval and Adult Stages of the Wood Frog (Rana Sylvatica) Ecology 71, 1599-1608 (1990).
Carr, M. H., Anderson, T. W. et al. Biodiversity, population regulation, and the stability of coral-reef fish communities. Proceedings of the National Academy of Sciences of the United States of America 99, 11241-11245 (2002).
Hörnfeldt, B. Synchronous population fluctuations in voles, small game, owls, and tularemia in northern Sweden. Oecologia 32, 141-152 (1978).
Krebs, C. J. & Boutin, S. Impact of food and predation on the showshoe hare cycle. Science 269, 112-115 (1995).
Krebs, C. J., Boonstra, R. et al. What drives the 10-year cycle of snowshoe hares? Bioscience 51, 25-35 (2001).
Larsson, T. B. & Hansson, L. Vole diet on experimentally managed afforestation areas in northern Sweden. Oikos 28, 242-249 (1977).
Lindström, E. R., Andren, H. et al. Disease reveals the predator: Sarcoptic mange, red fox predation, and prey populations. Ecology 75, 1042-1049 (1994).
Moore, J. The Behavior of Parasitized Animals. BioScience 45, 89-96 (1995).
Utida, S. Cyclic fluctuations of population density intrinsic to the host-parasite system. Ecology 38, 442-449 (1957).
Wood, C. L. & Byers, J. E. Parasites alter community structure. Proceedings of the National Academy of Sciences of the United States of America 104, 9335-9339 (2007).


