


« Prev Next »

Early seafaring nations recognized the practical and economic benefits of mapping surface currents and winds in great detail. However, knowledge of the deep oceans, their properties, and their climatic significance has been acquired relatively recently. The first field program to systematically measure physical and chemical properties of all the world's deep oceans took place from 1973–1978. Subsequent measurements revealed that properties of deep water in key regions vary from decade to decade, and that these changes are linked to oscillations in surface climate (Dickson et al. 1996, Zhang 2007). Unfortunately the observations are too limited to provide insight into how the deep oceans and climate interact on the longer time scales of ocean circulation and also how this interaction might change in response to rising greenhouse gases. Instead, scientists use computer climate models to predict how the Earth's climate will change. Reconstructions of past ocean circulation using the geochemistry of microfossils preserved in marine sediments provide critical information to test these models.
Water Masses in the Deep Atlantic Ocean
The Atlantic Ocean is the only ocean basin that features the transformation of surface-to-deepwater near both poles. Warm salty tropical surface waters flowing northward in the western Atlantic cool in transit to and within the high-latitude North Atlantic, releasing heat to the overlying atmosphere and increasing seawater density. Once dense enough, these waters sink and flow southward between ~ 1000 and 4000m. This North Atlantic Deep Water (NADW), as it is called, flows from the Atlantic to the Southern Ocean where much of it upwells — or rises to the surface — around Antarctica, and some of it circulates Antarctica before entering the rest of the world's deep oceans. Antarctic Bottom Water (AABW), which is formed close to Antarctica, is denser than NADW, and flows northward in the Atlantic below NADW. AABW is confined to water depths below 4000 meters in the tropical and North Atlantic. Antarctic Intermediate Water (AAIW) flows northward above NADW. The presence of these three water masses in the Atlantic Ocean is evident in cross-sections of many water properties, including salinity, phosphate concentration and carbon isotope ratios (Figure 2). The residence time of deepwater in the western Atlantic is approximately 100 years (Broecker 1979), meaning that the average water parcel spends about a century in the deep Atlantic.

Figure 1: Modern transects from the western Atlantic Ocean.
(a) salinity (Bainbridge 1981), (b) phosphate (Bainbridge 1981), and (c) δ13C (Kroopnick 1985) where δ13C = 1000(13C/12Csample/13C/12Cstandard − 1). NADW, identified by its high salinity, contains more surface water than AABW, and therefore has lower nutrients and higher δ13C, as well as a younger radiocarbon age (Stuiver & Ostlund 1980).
© 2012 Nature Education Slides (a), (b) Bainbridge, 1981; Slide (c) reprinted with permission: Kroopnick, 1985. All rights reserved. 
Why is Deep Water Formed in the Atlantic and not the Pacific?
Warren (1983) first noted that the difference in salinity between the North Pacific and the North Atlantic (Figure 1) was the principal reason deep water formation occurs today only in the North Atlantic. Salty water, when cooled, achieves a higher density and is thus able to sink to greater depth in the water column. Wintertime cooling occurs in both the North Atlantic and North Pacific, but since the surface waters of the North Atlantic are much closer in salinity to the mean of the ocean's deep water, they achieve a density high enough to sink to great water depths. Warren (1983) noted that the salinity of the North Pacific was low because of relatively low evaporation, little exchange with salty tropical waters, and an influx of fresh water from precipitation and river runoff. Emile-Geay et al. (2003) reevaluated the Warren (1983) results and fundamentally confirmed his thesis, noting that atmospheric moisture transport from the Asian monsoon was also an important source of fresh water to the North Pacific not originally considered by Warren. Interestingly, Warren also noted that the North Atlantic had much greater river runoff than the North Pacific, so its higher surface salinities must be the result of greater evaporation in the Atlantic basin.

Broecker et al. (1990a) noted that higher Atlantic salinities are the result of a net transfer of water vapor from the Atlantic to the Pacific over the Isthmus of Panama, equivalent to approximately 0.35 Sverdrup (106 m3 per second). In the absence of other processes, this would raise the salinity of the Atlantic by about 1 salinity unit each 1000 years. If the Atlantic salinity is in balance, then it must be exporting the excess salt (enough to compensate for the lost fresh water) through ocean circulation processes. Today this is occurring through the production and export of North Atlantic Deep Water.
At times in the past, rapid melting of ice sheets surrounding the North Atlantic was great enough to alter surface salinities, likely reducing the density of deep water formed, and slowing the export of deep water from the North Atlantic. Broecker et al. (1990b) hypothesized that natural oscillations in the rate of water vapor exchange between the Atlantic and the Pacific during the last glacial period were responsible for the rapid, short term fluctuation ocean circulation linked to the abrupt millennial-scale Dansgaard-Oeschger Events seen in the Greenland ice cores (Figure 9).Figure 2: Global distribution of (a) evaporation minus precipitation (Schmitt 1995) and of (b) surface water salinity (Curry 1996).
Oceanic regions with higher evaporation than precipitation (red) have relatively high salinity (note the increased salinity in the subtropical gyres around the globe) and regions with higher precipitation than evaporation (blue) have lower surface salinity (along the equator beneath the Intertropical Convergence Zones and in subpolar locations). Note that the Atlantic Ocean has overall much higher surface salinity than the Pacific Ocean.
© 2012 Nature Education Courtesy of R. Curry. All rights reserved.
What Replaces the Deep Water that Leaves the Atlantic?
There are three main pathways for water to return to the North Atlantic and renew NADW, a warm-water route and two cold water routes (Figure 3). The "warm-water route" begins with the flow of surface and thermocline water from the Pacific to the Indian Ocean through the Indonesian Seas. Both colder return flows involve Antarctic Intermediate Water (AAIW), described above. AAIW enters the southern South Atlantic through the Drake Passage between Antarctica and South America, with some flowing into the Atlantic and some flowing into the Indian Ocean. AAIW also enters the Indian Ocean from south of Tasmania and flows westward towards Africa, where it joins the warm-water flow and the other branch of AAIW before rounding southern Africa, entering the South Atlantic, and flowing northward (Gordon 1985, Speich et al. 2002). Along its transit to the North Atlantic, AAIW from the Drake Passage, flowing above Tasman AAIW, mixes with overlying water and contributes to the "warm-water route" (Gordon 1986). These return flows provide a significant source of heat to high northern latitudes. Together, southward flow of water in the deep Atlantic and its shallower return flows are a large component of what is known as the global Meridional Overturning Circulation (MOC).
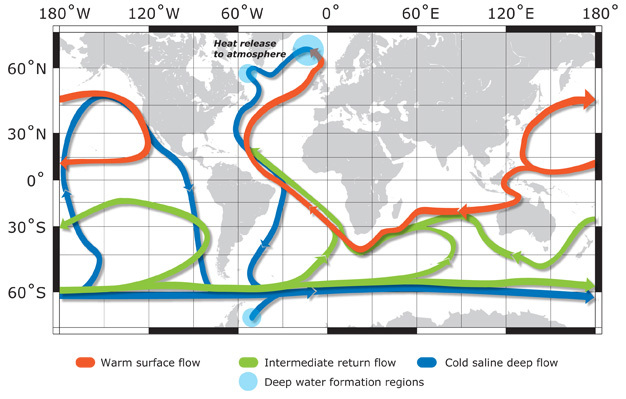
Figure 3: The Global Ocean Circulation.
Schematic representation after Broecker (1987), and S. Speich (adapted from Lumpkin & Speer 2007, following Speich et al. 2007). Red, green, and blue denote the pathways of surface, intermediate, and deep water flow. Most surface currents are omitted to clarify the return paths.
© 2012 Nature Education All rights reserved.
Reconstructing Past Ocean Circulation
Reconstructions of past ocean circulation have relied heavily on the chemistry of foraminifera, single-celled organisms that secrete a shell made of calcium carbonate (CaCO3). The shells of foraminifera that live on the sea floor, or "benthic" foraminifera, record many chemical properties of the overlying seawater. Critical for paleoceanographic reconstructions, benthic foraminifera incorporate carbon to make their shells in approximately the same carbon-13 to carbon-12 isotope ratio as the overlying seawater (Curry et al. 1988). Similarly, benthic foraminifera incorporate cadmium (Cd) into their shells in a known proportion to seawater Cd, and so cadmium/calcium (Cd/Ca) measured in benthic foraminifera enable estimates of seawater Cd (CdW) (Boyle 1988).
CdW and the ratio of carbon-13 to carbon-12 (13C/12C, reported as δ13C) in deep water covary with nutrient content. In the deep Atlantic, phosphate content is correlated to salinity, which helps define the different water masses (Figure 2), and so measuring δ13C or Cd/Ca in fossil foraminifera with known ages can tell us whether the properties and boundaries of the important deep water masses — NADW, AABW, and AAIW — have changed in the past.
Foraminifera also record the abundance of carbon-14 in seawater. Carbon-14 is a radioactive carbon isotope produced in the atmosphere, and enters the surface ocean through air-sea gas exchange. The difference between its abundance in deep water and in surface water provides a measure for how much time has passed since the deep water was last at the surface and in contact with the atmosphere. This "ventilation age" can be estimated in the past by measuring the difference in the abundance of 14C between coexisting benthic foraminifera and foraminifera that lived at the ocean surface, or "planktic" foraminifera (Benthic-Planktic radiocarbon age). Radiocarbon measurements therefore provide a way to evaluate whether the renewal rate of deepwater by surface water was slower or faster in the past (Broecker & Peng 1982). Ventilation age estimates are complicated by variations through time in the production of radiocarbon in the atmosphere (Adkins & Boyle 1997) and by variations in surface ocean radiocarbon due to changes in oceanography (e.g., mixing with deeper, older water) (Bard et al. 1994). These complications can be circumvented to some extent if there is an independent timescale for a sediment record that does not rely on the radiocarbon chronology (e.g., Thornalley et al. 2011).
To reconstruct deep ocean circulation using the geochemistry of foraminifera, scientists use sediment cores, taken from a range of water depths along the continental margins, mid-ocean ridges, and other bathymetric highs in the ocean basins. This strategy allows them to sample sediments that intersect the main water masses: AAIW, NADW, and AABW (Figure 4). Once they have acquired the sediment cores, they use a variety of methods, including radiocarbon dating of foraminifera, to identify sediments that were deposited at times in the past, like the last Ice Age, when climate was very different from today.
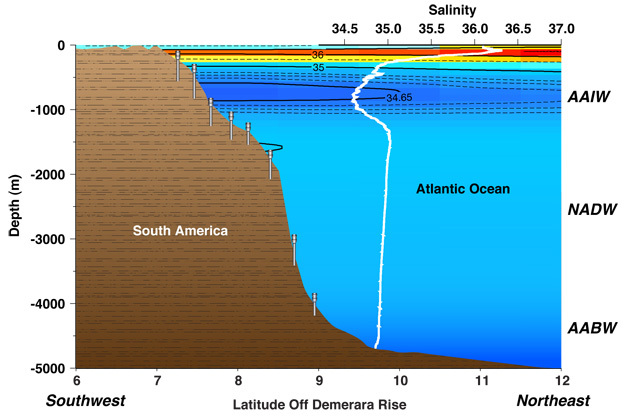
Figure 4: Schematic representation of a depth-transect of sediment cores in the tropical western Atlantic.
In many locations, for example, along the continental margins, the sea floor intersects the main water masses - AAIW, NADW, and AABW - which are identified by their salinities (salinity section from Curry 1996). By analyzing synchronously-deposited samples from each core (e.g., the LGM), it is possible to reconstruct the vertical gradients in key nutrient-related deepwater properties and past watermass geometry. The salinity profile (white) is from 8°42'N, 53°52'W.
© 2012 Nature Education All rights reserved.
Atlantic Ocean Circulation During the Last Ice Age
There is strong evidence that the circulation of the deep Atlantic during the peak of the last Ice Age, or the Last Glacial Maximum (LGM; ~22,000 to 19,000 years ago) was different from the modern circulation (Boyle & Keigwin 1987, Duplessy et al. 1988, Marchal & Curry 2008). Compilations of deepwater δ13C and CdW for the LGM (Figure 5) show several features that contrast with their modern distributions. Whereas much of the modern deep western Atlantic has similar δ13C values because it is filled with NADW, during the LGM, the range of δ13C values was larger than today, with higher values in NADW and lower values in AABW. The main core of high-δ13C, low-CdW NADW was at least 1000 meters shallower than today, probably because the density difference between surface waters and deep water was reduced — surface salinity may have decreased as a result of less evaporation due to colder glacial temperatures, and as a result of input of freshwater from glaciers surrounding the North Atlantic (Boyle & Keigwin 1987). In the western Atlantic, depths below ~2 km were filled with AABW. Radiocarbon data suggest that deepwater was older (Keigwin & Schlegel 2002), consistent with less NADW and more AABW as indicated by the δ13C and CdW of benthic foraminifera. Glacial δ13C data from the eastern Atlantic suggest that the boundary between glacial AABW and glacial NADW may have been shallower than in the western Atlantic (Sarnthein et al. 1994), although the difference may be the result of local effects caused by increased glacial productivity and higher rates of remineralization of low-δ13C organic carbon in the eastern basin. Inferences using other kinds of proxy data of deep Atlantic circulation are consistent with the changes inferred from δ13C, Cd/Ca and 14C of benthic foraminifera (Lynch-Steiglitz et al. 2007).

Carbon isotope and Cd data from the western South Atlantic indicate that like today, AAIW was centered at ~1000 meters water depth (Curry & Oppo 2005, Makou et al. 2010), but data defining how far north into the Atlantic it flowed are still lacking. Defining the northward extent of AAIW is an area of active investigation, as doing so will help scientists understand whether AAIW was still an important return flow for NADW during the LGM. If not, it implies even larger differences between glacial and modern circulation than currently appreciated.
Figure 5: Modern, Holocene, and Glacial western Atlantic transects.
(a) Modern δ13C (Kroopnick 1985), (b) Holocene, and (c) LGM δ13C (Curry & Oppo 2005 and Supplementary Information), and (d) LGM CdW (Makou et al. 2010, including data compiled by Marchitto & Broecker 2008) transects for the western Atlantic. White dots indicate latitude and depths of cores used to make the glacial transects. The low δ13C values and high CdW values in the glacial deep North Atlantic mark the penetration of southern ocean waters to the subpolar North Atlantic.
© 2012 Nature Education All rights reserved.
Abrupt Changes in Ocean Circulation During the Last Glacial-to-Interglacial Transition
The melting of the vast continental ice sheets, which began ~20,000 years ago due to gradual changes in the seasonal and spatial distribution of the Sun's energy (Broecker & Von Donk 1970), was interrupted by several abrupt cold climate events. The two largest deglacial events in the North Atlantic — known as Heinrich Stadial 1 and the Younger Dryas — occurred approximately 17,500–14,600 and 13,000–11,500 years ago respectively (Figure 6) (Heinrich 1988, Bond et al. 1992, Grootes et al. 1993).

Figure 6: Deglacial Time Series.
(a) top-to-bottom: Greenland Ice Sheet Project (GISP2) δ18O (Grootes et al. 1993), average CdW from Florida Current (24 °N, 83 °W, 751 m; Came et al. 2008) and from the deep western North Atlantic (33.7 °N, 57.6 °W, 4450 m, Boyle & Keigwin 1987). (b) top-to-bottom: Greenland Ice Sheet Project (GISP2) δ18O (Grootes et al. 1993), δ13C from the Florida Current (16.9°N; 16.2°W, 648 m, Lynch-Stieglitz et al. 2011), and from the deep eastern North Atlantic (37.8°N, 10.2 °W, 3166m, Skinner & Shackleton 2004). Time scales for the ice core records are from Blunier & Brooks 2001). Generally high CdW and low δ13C in the deep Atlantic (bottom panels) indicate a relatively small contribution of NADW during the Heinrich Stadial and Younger Dryas. Low CdW values in the shallow North Atlantic suggest reduced northward flow of AAIW at the same time. The Heinrich Stadial (HS1), the Younger Dryas (YD), and the intervening warm period, the Bølling-Allerød (BA) are identified by shading. Note there is some debate about the timing of the Heinrich Stadial.
© 2012 Nature Education All rights reserved.
Deglacial deepwater evolution based on δ13C exhibits some similarities to the CdW records, but also some important differences (Figure 6b). Like CdW, the δ13C records suggest that both the contribution of NADW to the deep Atlantic and northward AAIW penetration decreased during the Heinrich Stadial. Although δ13C records suggest that the contribution of NADW to the deep Atlantic was reduced during the Younger Dryas, δ13C records do not provide clear evidence for an associated reduced northward penetration of AAIW. The AMOC recovery following the Heinrich Stadial weakening is recorded ~ 16,000 years ago in the intermediate-depth δ13C record and both CdW records, but ~1,000 years later in the deepwater δ13C record.
Other proxies, including Benthic-Planktic 14C records also suggest that the contribution of NADW to the deep Atlantic decreased during these events (e.g., Boyle & Keigiwn 1987, Thornalley et al. 2011, Lynch-Stieglitz et al. 2007, Robinson et al. 2005) whereas the response of AAIW during these events is more controversial (e.g., Pahnke et al. 2008). Resolving why differences occur between proxy records is necessary in order to fully understand the link between deep ocean circulation and climate.
The prevailing view of the Heinrich Stadial is that instabilities in the Northern Hemisphere ice sheets resulted in catastrophic iceberg discharges into the North Atlantic Ocean (Bond et al. 1992). These freshened and reduced the density of North Atlantic surface waters, significantly curtailing surface-to-deepwater transformation and reducing northward transport of heat to the region. Expanded sea ice may have amplified cooling in the North Atlantic region. Once warming began at the end of the events, quick northward displacement of sea ice may have triggered an abrupt end of the cold events (Dansgaard et al. 1989, Li et al. 2005).
It is generally believed that freshening of the surface North Atlantic also initiated the Younger Dryas cooling. Fresh water from ice sheets melting into the North Atlantic, perhaps by way of the Arctic Ocean (e.g., Murton et al. 2010), reduced surface-to-deepwater transformation, and the associated northward heat transport. Expanded sea ice and meltwater from iceberg discharge may also have sustained the event.
Although there are fewer data than for the LGM, compilations of δ13C data from the western Atlantic during the Heinrich Stadial highlight significant differences in deepwater mass geometry relative to both the modern and the LGM transects (Figure 7). While the modern and glacial transects clearly show the core of nutrient-poor, high-δ13C NADW at 3000m and 2000m respectively, the high-δ13C North Atlantic waters were restricted to depths shallower than 1000 m during the Heinrich Stadial. In addition, modern and glacial NADW can be traced to the South Atlantic by their high δ13C values, but during the Heinrich Stadial high-δ13C northern source water may not have reached the equatorial Atlantic. These data strongly suggest that vigorous surface-to-deepwater transformation akin to modern or glacial NADW did not occur during this portion of the Heinrich Stadial. As in the glacial ocean, lowest δ13C values, suggesting the presence of AABW, were found below 4000m. Decreasing δ13C values below 1000m suggest a progressive increase in the proportion of nutrient-rich southern ocean waters relative to nutrient-poor upper ocean waters. Given the water mass distributions and properties in the subpolar North Atlantic at the time, the higher nutrient waters observed at shallow depths during the Heinrich Stadial must have originated in the southern ocean. Shoaling of southern ocean waters already present in the glacial deep Atlantic provides a simple way to explain these low δ13C values, but without additional data, we cannot rule out the alternative possibility of enhanced advection of low-δ13C, southern intermediate waters to the high-latitude North Atlantic (Rickaby & Elderfield 2005, Thornalley et al. 2011).
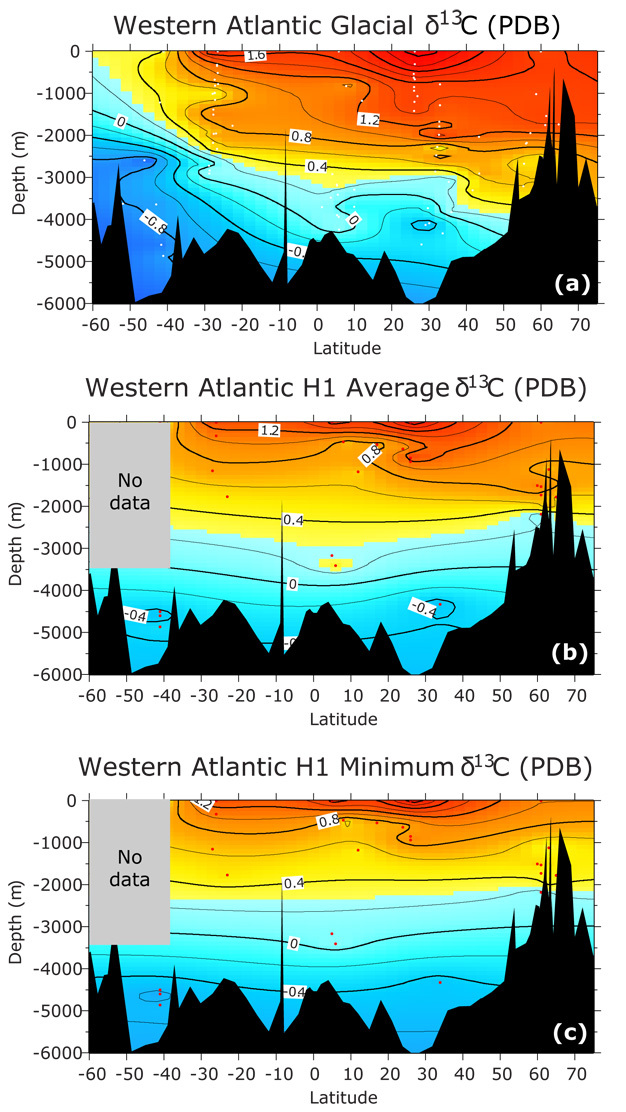
Figure 7: LGM and Heinrich Stadial δ13C transects.
(a) LGM δ13C (Curry & Oppo 2005 and Supplementary Information), (b, c) Heinrich δ13C transects for the western Atlantic (this paper). For (b) δ13C data were averaged over the interval from 15,700-14,500 years ago, whereas (c) includes δ13C values from within the δ13C minimum late in the Heinrich Stadial (see Supplementary Information). The transect shown in (b) assumes that all δ13C records are on the same time scale. The transect shown in (c) assumes that a δ13C minimum that occurs at many sites is coeval, regardless of the time interval suggested by the chronology, given in Table S1. Although neither of these assumptions is likely to be completely correct, the two figures are similar, and differences between the two figures provide a sense of the uncertainties. White (a) or red (b,c,) dots indicate latitude and depths of cores used to make these transects. For each transect, changes in past surface water δ13C were estimated using downcore differences observed in select planktonic δ13C records, then applying the difference from the core-top to the modern observed values from GEOSECS (e.g., Curry & Oppo 2005). Data used to make the Heinrich transects are documented in Supplementary Information and archived at NCDC.
© 2012 Nature Education All rights reserved.
The Bipolar Seesaw
One of the most exciting and important discoveries relating to abrupt climate changes is the finding that when the North Atlantic region cooled during abrupt events, the southern hemisphere warmed (Figure 8) (Blunier et al. 1998). The reason for the opposite temperature response is related to changes in heat transport associated with deepwater variability. The decrease in surface-to-deepwater transformation in the North Atlantic during Heinrich Stadial 1 and the Younger Dryas caused a decrease in the northward flow of warm tropical surface water, cooling the North Atlantic region. Less heat was transported from the tropics to the North Atlantic in the upper ocean to renew NADW, so the heat accumulated in the southern hemisphere and tropical Atlantic. The simultaneous cooling in one hemisphere and warming in the other, due to deepwater variability and associated changes in upper ocean heat transport, has been named "The Bipolar Seesaw" (Broecker 1998). Ice core evidence suggests that the bipolar seesaw also operated during earlier stadial events during the glacial period (Figure 9). Simulations with numerical models of the ocean-atmosphere system show that a reduction in the AMOC would cool the high latitudes of the North Atlantic while warming the South Atlantic, consistent with the bipolar seesaw mechanism (e.g., Manabe & Stouffer 1988).
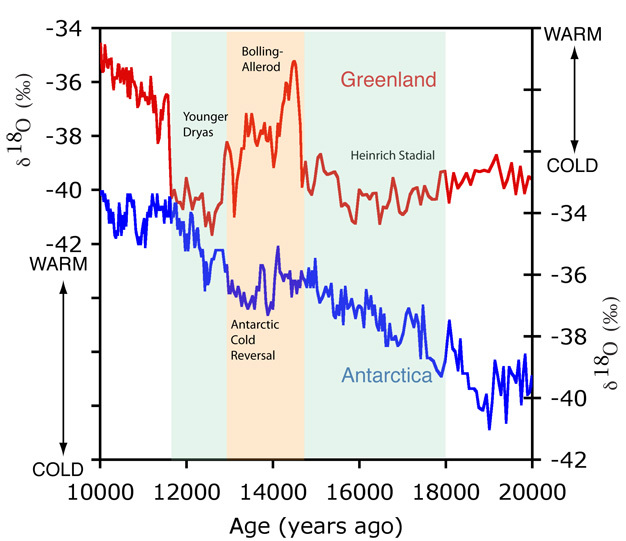
Figure 8: The Bipolar Seesaw.
Greenland (GISP2) and Antarctic (Byrd) δ18O of ice put on a common time scale using methane, which varies synchronously in both hemispheres (Blunier & Brook 2001; see also Figure 9). The δ18O varies in large part due to temperature over the ice sheets. The figure shows that while Greenland was cold between 19,000 and 15,500 years ago, and during the Younger Dryas, Antarctica was warming. Likewise, when Greenland was warm during the so-called Bølling-Allerød period, Antarctica experienced a cold reversal. These records were put on the same time scale using the records of methane abundance trapped in bubbles in the same ice cores - methane is mixed rapidly through the atmosphere and varies synchronously between hemispheres (Blunier et al. 1998; see Figure 9).
© 2012 Nature Education All rights reserved.
Rapid Climate Oscillations During the Last Glacial Period
The discovery of rapid and abrupt climate oscillations in Greenland ice cores in the 1980s changed the way researchers thought about climate changes on longer time scales. At the time, the prevailing view was that slow changes in the earth's orbit around the sun (the Milankovitch hypothesis) altered the seasonal and latitudinal distribution of the sun's energy, which forced the slow growth and somewhat more rapid decay of the ice sheets during the ice ages (Broecker & van Donk 1970). While this orbital theory is still generally accepted to explain climate variations on 10,000 to 100,000-yr time scales, the records of climate found in the ice cores showed that the climate system, at least in the North Atlantic region, exhibited much more rapid and frequent changes than could be accounted for by external orbital forcing (Figure 9). These short-term, rapid changes in climate occurred during the glacial phase of the ice ages. They reflected millennial-scale oscillations in air temperature, with some of the warmings occurring in as few as ten years. The oscillations became known as Dansgaard-Oeschger (D-O) Events, in honor of the two distinguished ice core researchers who were most responsible for discovering them (Dansgaard et al. 1982, 1984, Oeschger et al. 1984). 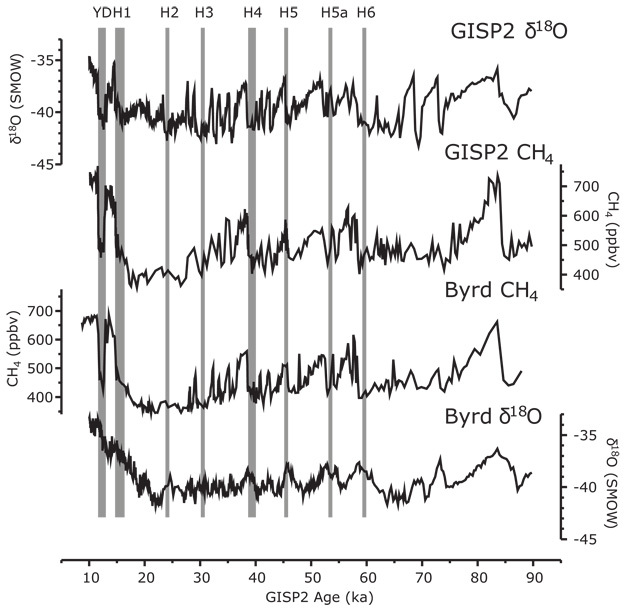
At nearly the same time, studies of marine sediments in the subpolar North Atlantic revealed evidence of several events of massive discharge of the land-based ice sheets into the North Atlantic Ocean. At times during the last glacial period, large numbers of icebergs calved from the surrounding glacier systems, leaving in the underlying sediments a telltale signature of ice-rafted minerals with a North American origin. The ice-rafted sediments were the undeniable record of large-scale calving of the ice sheets and as a result, the rapid, large-scale addition of fresh water into the entire subpolar North Atlantic. These ice-rafting events were less common than the D-O events, and appeared to occur after a series of increasingly colder D-O events (Bond et al. 1993). Referred to as Heinrich Events (after their discoverer Hartmut Heinrich), their occurrence was often associated with evidence for major reductions in the production of deep water in the North Atlantic. The two most recent events, Heinrich Event (Stadial) 1 and the Younger Dryas (although technically not a Heinrich event, it is sometimes referred to as "Heinrich Event 0") occurred during the last deglaciation and were each responsible for a major change in North Atlantic circulation and climate (Figure 6).
Figure 9: Records of Greenland and Antarctic ice core δ18O and CH4.
(a) Greenland δ18O, (b) Greenland CH4, (c) Antarctic CH4, and (d) Antarctic δ18O. These records were placed on a common time scale through the correlation of the methane (CH4) content of gas bubbles trapped in the respective ice cores (Blunier & Brook 2001). The D-O events are the short-term oscillations seen in the Greenland ice core (a). The shaded bars show the occurrence of the Heinrich Events. Note very cold intervals in Greenland were most often associated with short-term warming in Antarctica. The out-of-phase behavior is called the Bipolar Seesaw (Broecker 1998) and it reflects the changes in heat transport associated with variations in the Atlantic overturning circulation (Crowley 1992).
© 2012 Nature Education All rights reserved.
Climate Impacts
We know from modern observations that rainfall migrates north and south with the seasons, towards the warmer hemisphere (Waliser & Gautier 1993). There is evidence to suggest that this was also true on longer time scales, for example during the Heinrich Stadial, when the warming of the South Atlantic relative to the North Atlantic caused a southward shift in South American rainfall (Figure 10). Evidence from many sources suggests that changes in the hydrologic cycle occurred throughout the tropics, including large drying in the Asian monsoon region. The spatial distribution of the increased aridity and moisture, however, suggests that, in addition to the southward migration of the Intertropical Convergence Zone and monsoon systems, another mechanism, possibly a generally weaker hydrologic cycle due to cooler sea surface temperatures, is needed to explain anomalies over Asia and Africa (Stager et al. 2011). Climate simulations with computer models suggest ways that a reduction in North Atlantic overturning and the related sea surface temperature changes could have influenced global tropical climate (Zhang & Delworth 2005). However, there are still many uncertainties, and an important role for the tropics in abrupt climate change is also possible (Seager & Battisti 2007).
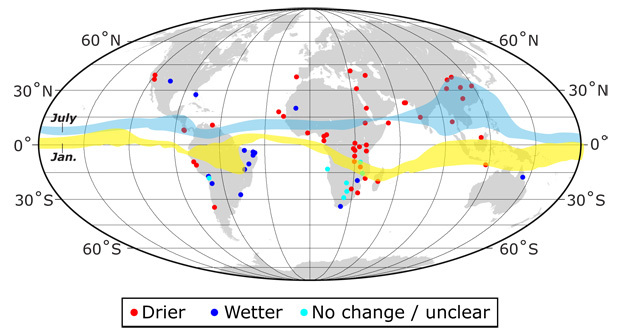
Figure 10: Map showing areas that became drier (red) or wetter (blue) during Heinrich Stadial 1.
Areas with no trend or an unclear trend are marked with cyan. Precipitation associated with seasonal migration of the Intertropical Convergence Zone and tropical monsoons are also shown, with broader swaths indicating monsoon rainfall. Data include those previously compiled by Stager et al. (2011) and Wang et al. (2007), and additional data (Baker et al. 2001, Cruz et al. 2009, Sifeddine et al. 2003, Jaeschke et al. 2007, Valero-Garcés et al. 2005, Vidal et al. 2007, Asmeron et al. 2010, Grimm et al. 2006, Benson et al. 1999).
© 2012 Nature Education All rights reserved.
Although Although beyond the scope of this article, geologic data suggest that deep ocean circulation changes we describe above played an important role in raising atmospheric CO2 from glacial levels of ~ 200 parts per million to pre-industrial interglacial values of ~ 280 parts per million (e.g., Sigman et al. 2007).
How Does Reconstructing Past Deepwater Variability Advance Climate Science?
The instrumental record is short, and only spans a very limited range of climate states. Deep ocean circulation operates on much longer time scales. The ability to understand ocean and climate connections over a larger range of climate states is especially important in the context of predicting future climate. Complex computer climate models are based on the laws of physics, but there are many processes that are not specifically modeled because, for example, they occur on spatial scales smaller than a model grid box (e.g., cloud formation processes, mixing in the ocean). Because modelers use relationships based on modern observations to parameterize these processes, there is some risk that the models are tuned to remain close to the modern climate. On the other hand, if a computer model can simulate ocean and climate conditions for the LGM or the Heinrich Stadial, for example, then scientists have more confidence that its predictions for a greenhouse world are reliable.
Acknowledgements
The authors thank R. Curry for producing Figure 1 and for providing the salinity section for Figure 4. J. Lynch-Stieglitz, F. Mekik, O. Marchal, and two anonymous reviewers provided very helpful suggestions and comments on the manuscript. This contribution was funded by a grant from the National Science Foundation.
Supplementary Information
|
Core |
Location | (°N °E) | Depth (m) |
δ13C (‰) 15.7-14.5KA |
δ13C (‰) H1 MIN |
δ13C (‰) H MIN AGE |
| RC11-831 | -41 | 10 | 4718 | -0.47 | -0.69 | 14.1-14.7 |
| ODP 10892 | -41 | 10 | 4981 | -0.44 | -0.58 | 15.2-15.0 |
| TTN057-211 | -41 | 8 | 4981 | -0.33 | -0.56 | 15.1* |
| KNR159-5-36GGC3 | -27 | -47 | 1268 | 0.76 | NA | |
| CAM-614 | -23 | -40 | 1890 | 0.52 | 0.54 | 16.2-14.9 |
| JPC35 | 5 | -44 | 3288 | 0.25 | 0.07 | 15.5-14.0 |
| JPC25 | 6 | -44 | 3528 | 0.38 | 0.1 | 15.8-15.4 |
| P6903-64 | 8 | -54 | 588 | 0.66 | 0.54 | 16.4-16.0 |
| M350036 | 12 | -61 | 1299 | 0.6 | 0.5 | 15.1-14.6 |
| KNR166-2-29JPC7 | 17 | -83 | 648 | 0.69 | 0.69 | 15.7-15.0 |
| KNR166-2-31JPC8 | 24 | -84 | 751 | 0.89 | 0.69 | 15.1 |
|
OCE205-1008
|
26 |
-78 |
1057 |
1.21 |
0.99 |
15.9* |
|
OCE205-1038
|
26 |
-78 |
965 |
1.44 |
NA | |
|
EN120-1GGC9
|
34 |
-58 |
4450 |
-0.52 |
-0.556 |
15.7-14.2 |
|
NEAP4K10
|
60 |
-24 |
1627 |
0.96 |
0.56 |
16.78-16.11 |
|
RAPiD-17-5P11
|
61 |
-17 |
2303 |
0.12 |
0.12 |
15.7-14.5 |
|
ODP 98412
|
61 |
-25 |
1648 |
0.69 |
NA |
|
|
V29-20413
|
61 |
-23 |
1849 |
0.77 |
0.4 | 15.74* |
|
RAPiD-15-4P11
|
62 |
-23 |
2133 |
0.67 |
0.4 |
16.8-16.1 |
|
SU90-2414
|
62 |
-37 |
2100 |
0.7 |
0.2 |
16.9-15.4 |
|
RAPiD-10-1P11
|
63 |
-18 |
1237 |
0.67 |
0.39 |
15.5-15.2 |
|
G1K2519-51115
|
65 |
-27 |
1893 |
0.54 |
0.48 |
15.5-14.6 |
*Only one data point was used.
The first δ13C value on Table S1 is the average value in the interval between 15.7 and 14.5 ka, the age of a late Heinrich Stadial NADW reduction from ref. 11. The second δ13C value is the average value of the last δ13C minimum in the early deglaciation, typically coincident with a deglacial decrease in δ18O values. The first value assumes that all δ13C records are on the same time scale. The second value assumes that the last δ13C minimum at all sites where it occurs is coeval, regardless of the time interval suggested by the chronology, given in the last column. Although neither of these assumptions is likely to be correct, the two figures are similar, and differences between the two figures provide a sense of the uncertainties. This approach makes the values in the lower panel lower than or equal to those in the middle panel. Thus contours of δ13C on the lower panel are generally a few hundred meters shallower in the water column than the same contours in the middle panel.
LGM and Holocene δ13C Transects: These transects are as in ref. 16, with addition of unpublished data from KNR197-3-46CDH (8°N, 53°W, 967 m). Values of 0.8‰ and 0.9‰ were observed for the Holocene and LGM respectively, with the chronology based on benthic δ18O stratigraphy.
Age Models: Age models are taken from the publications referenced except as follows. The age model for EN120-GGC1 was taken from ref. 8. We have converted the radiocarbon-based chronology for SU90-2414 to calendar age 17.References and Recommended Reading
Adkins, J. F. & Boyle, E. A. Changing atmospheric Δ14C and the record of deep water paleo-ventilation ages. Paleoceanography 12, 337–344 (1997).
Asmerom, Y., Polyak, V. J. & Burns, S. J. Variable winter moisture in the southwestern United States linked to rapid glacial climate shifts. Nature Geoscience 3, 114–117 (2010).
Bainbridge, A. ed. GEOSECS Atlantic Expedition, Hydrographic data volume 1. Washington, DC: US Government Printing Office, 1981.
Baker, P. A. et al. Tropical climate changes at millennial and orbital timescales on the Bolivian Altiplano. Nature 409, 698–700 (2001).
Bard, E. et al. The North-Atlantic atmosphere-sea surface 14C gradient during the Younger Dryas climatic event. Earth and Planetary Science Letters 126, 275–287 (1994).
Benson, L. "Records of millennial-scale climate change from the great basin of the western United States," in Mechanisms of Global Climate Change at Millennial Time Scales, eds. P. U. Clark, R. S. Webb & L. D. Keigwin, Geophysical Monograph Series (Washington, DC: American Geophysical Union, 1999) 203–225.
Bond, G. et al. Evidence for massive discharges of icebergs into the North Atlantic ocean during the last glacial period. Nature 360, 245–249 (1992).
Bond, G. et al. Correlations between climate records from North Atlantic sediments and Greenland ice. Nature 365, 143–147 (1993).
Boyle, E. A. Cadmium: Chemical tracer of deep-water paleoceanography. Paleoceanography 3, 471–490 (1988).
Boyle, E. A. & Keigwin, L. D. Comparison of Atlantic and Pacific paleochemical records for the last 215,000 years: Changes in deep ocean circulation and chemical inventories. Earth and Planetary Science Letters 76, 135–150 (1985).
Blunier, T. & Brook, E. Timing of millennial-scale climate change in Antarctica and Greenland during the last glacial period. Science 291, 109–112 (2001).
Blunier, T. et al. Asynchrony of Antarctic and Greenland climate change during the last glacial period. Nature 394, 739–743 (1998).
Broecker, W. S. A Revised Estimate for the radiocarbon age of North Atlantic Deep Water. Journal of Geophysical Research 84 (C6), 3218–3226 (1979).
Broecker, W. S. The biggest chill. Natural History Magazine 97, 74–82 (1987).
Broecker, W. S. Paleocean circulation during the Last Deglaciation: A bipolar seesaw? Paleoceanography 13, 119–121 (1998).
Broecker W. S. & van Donk, J. Insolation changes, ice-volumes, and the 18O record in deep-sea cores. Review of Geophysics and Space Physics 8, 169–198 (1970).
Broecker, W. S. et al. The magnitude of global fresh-water transports of importance to ocean circulation. Climate Dynamics 4, 73–79 (1990a).
Broecker, W. S. et al. A salt oscillator in the glacial north Atlantic? 1. The concept. Paleoceanography 5, 469–477 (1990b).
Broecker, W. S. & Peng, T. H. Tracers in the Sea. Palisades, NY: Lamont-Doherty Geological Observatory, 1982.
Came, R. E. et al. Variability in the influence of Antarctic Intermediate Water in the Florida Current over the last 20,000 years. Paleoceanography 23, PA1217 (2008). doi:10.1029/2007PA001450
Cruz, F. et al. Insolation-driven changes in atmospheric circulation over the past 116,000 years in subtropical Brazil. Nature 434, 63–66 (2005).
Crowley, T. J. North Atlantic Deep Water cools the northern hemisphere. Paleoceanography 7, 489–487 (1992).
Curry, R. G. HydroBase: A database of hydrographic stations and tools for climatologic analysis. WHOI Technical Report 96–01, 1996.
Curry, W. B. et al. Changes in the distribution of δ13C of ΣCO2 between the last glaciation and the Holocene. Paleoceanography 3, 317–341 (1988).
Curry, W. B. & Oppo, D. W. Glacial water mass geometry and the distribution of δ13C of ΣCO2 in the Western Atlantic Ocean. Paleoceanography 20, PA1017 (2005). doi:10.1029/2004PA001021
Dansgaard, W., White, J. & Johnsen, S. The abrupt termination of the Younger Dryas climate event. Nature 339, 532-534 (1989).
Dansgaard W. et al. "North Atlantic oscillations revealed by deep Greenland ice cores," in Climate Processes and Climate Sensitivity, American Geophysical Union Monographs, Volume 29, eds. J. H. Hansen & T. Takahashi (Washington, DC: American Geophysical Union, 1984) 288–298.
Dansgaard, W. et al. A new Greenland deep ice core. Science 24, 1273–1277 (1982).
Dickson, R. et al. Long term coordinated changes in the convective activity of the North Atlantic. Progress in Oceanography 38, 241-295 (1996).
Duplessy, J. C. et al. Deepwater source variations during the last climatic cycle and their impact on global deepwater circulation. Paleoceanography 3, 343–360 (1988).
Emile-Geay, J. et al. Warren revisited: Atmospheric freshwater fluxes and why is no deep water formed in the North Pacific. Journal of Geophysical Research 108, 3178 (2003). doi:10.1029/2001JC001058
Gordon, A. L. Indian-Atlantic transfer of thermocline water at the Agulhas retroflection. Science 227, 1030–1033 (1985).
Gordon, A. L. Interocean exchange of thermocline water. Journal of Geophysical Research 91, 5037–5046 (1986).
Grootes, P. et al. Comparison of oxygen-isotope records from the GISP2 and GRIP Greenland ice cores. Nature 366, 552–554 (1993).
Heinrich, H. Origin and consequences of cyclic ice rafting in the Northeast Atlantic Ocean during the past 130,000 years. Quaternary Research 29, 142–152 (1988).
Jaeschke, A. et al. Coupling of millennial-scale changes in sea surface temperature and precipitation off northeastern Brazil with high-latitude climate shifts during the last glacial period. Paleoceanography 22, PA4206 (2007). doi:10.1029/2006PA001391
Keigwin, L. D. & Schlegel, M. A. Ocean ventilation and sedimentation since the glacial maximum at 3 km in the western North Atlantic. Geochemistry, Geophysics, Geosystems 3, 1034 (2002). doi:10.1029/2001GC000283
Kroopnick, P. M. The distribution of δ13C of ΣCO2 in the world oceans. Deep-Sea Research 32, 57-84 (1985).
Li, C. et al. Abrupt climate shifts in Greenland due to displacements of the sea ice edge, Geophysical Research Letters 32, L19702 (2005). doi:10.1029/2005GL023492
Lumpkin R. & Speer, K. Global ocean meridional overturning. Journal of Physical Oceanography 37, 2550–2562 (2007).
Lynch-Stieglitz J. et al. Atlantic meridional overturning circulation during the Last Glacial Maximum. Science 316, 66–69 (2007).
Lynch‐Stieglitz, J., Schmidt, M. W. & Curry, W. B. Evidence from the Florida Straits for Younger Dryas ocean circulation changes. Paleoceanography 26, PA1205 (2011). doi:10.1029/2010PA002032
Makou, M. C., Oppo, D. W. & Curry, W. B. South Atlantic intermediate water mass geometry for the last glacial maximum from foraminiferal Cd/Ca. Paleoceanography 25, PA4101 (2010). doi:10.1029/2010PA001962
Manabe, S. & Stouffer, R. J. Two stable equilibria of a coupled ocean-atmosphere model. Journal of Climate 1, 841–866 (1988).
Marchal, O. & Curry, W. G. On the abyssal circulation in the Glacial Atlantic. Journal of Physical Oceanography 38, 2014–2037 (2008).
Marchitto, T. M. & Broecker, W. S. Deep water mass geometry in the glacial Atlantic Ocean: A review of constraints from the paleonutrient proxy Cd/Ca. Geochemistry, Geophysics, Geosystems 7, Q12003 (2006).
Murton, J. B. et al. Identification of Younger Dryas outburst flood path from Lake Agassiz to the Arctic Ocean. Nature 464, 740–743 (2010).
Ninnemann, U. S. & Charles, C. D. Changes in the mode of Southern Ocean circulation over the last glacial cycle revealed by foraminiferal stable isotope variability. Earth and Planetary Science Letters 201, 383–396 (2002).
Oeschger, H. J. et al. "Late glacial climate history from ice cores," in Climate Processes and Climate Sensitivity, Geophysical Monograph Series, Volume 29, eds. J. E. Hansen & T. Takahashi (Washington, DC: American Geophysical Union, 1984) 299–306.
Pahnke, K., Goldstein S. L. & Hemming, S. R. Abrupt changes in Antarctic Intermediate Water circulation over the past 25,000 years. Nature Geoscience 1, 870–874 (2008).
Rickaby, R. E. M. & Elderfield, H. Evidence from the high-latitude North Atlantic for variations in Antarctic Intermediate Water flow during the last deglaciation. Geochemistry, Geophysics, Geosystems 6, Q05001 (2005). doi:10.1029/2004GC000858
Robinson L. F. et al. Radiocarbon variability in the Western North Atlantic during the last deglaciation. Science 310, 1469–1473 (2005).
Sarnthein, M. et al. Changes in East Atlantic deepwater circulation over the last 30,000 years — 8 time slice reconstructions. Paleoceanography 9, 209–267 (1994).
Seager, R. & Battisti, D. S. "Challenges to our understanding of the general circulation: Abrupt climate change," in Global Circulation of the Atmosphere, eds. T. Schneider & A. H. Sobel (Princeton, NJ: Princeton University Press, 2007) 331–371.
Sifeddine, A. et al. A 21,000 cal years paleoclimatic record from Caço Lake, Northern, Brazil: Evidence from sedimentary and pollen analyses. Palaeogeography, Palaeoclimatology, Palaeoecology 189, 25–34 (2003).
Skinner, L. C. & Shackleton, N. J. Rapid transient changes in northeast Atlantic deep water ventilation age across Termination I. Paleoceanography 19, PA2005 (2004). doi:10.1029/2003PA000983
Schmitt, R. W. The ocean component of the global water cycle. U.S. National Report to International Union of Geodesy and Geophysics, 1991–1994, Reviews of Geophysics Supplement, 1395–1409 (1995).
Sigman, D. M., de Boer, A. M. & Haug, G. H. "Antarctic stratification, atmospheric water vapor, and Heinrich events: A hypothesis for late Pleistocene deglaciations," in Past and Future Changes of the Oceanic Meridional Overturning Circulation: Mechanisms and Impacts, AGU Geophysical Monograph Series, Volume 173, eds. A. Schmittner, J. H. Chiang & S. R. Hemming (Washington, DC: American Geophysical Union, 2007) 335–350.
Speich, S. et al. Tasman leakage: A new route for the global conveyer belt. Geophysical Research Letters 29, 10–13 (2002).
Speich, S., Blanke, B. & Cai, W. Atlantic meridional overturning circulation and the Southern Hemisphere supergyre. Geophysical Research Letters 34, L23614 (2007). doi:10.1029/2007GL031583
Stager, J. C. et al. Catastrophic drought in the Afro-Asian monsoon region during Heinrich Event 1. Science 331, 129–132 (2011).
Stuiver, M. & Ostlund, H. G. GEOSECS Atlantic radiocarbon. Radiocarbon 22, 1–24, (1980).
Thornalley, D. J. R., Elderfield, H. & McCave, I. N. Intermediate and deep water paleoceanography of the northern North Atlantic over the past 21,000 years. Paleoceanography 25, PA1211 (2010). doi:10.1029/2009PA001833
Thornalley, D. J. R. et al. The deglacial evolution of North Atlantic deep convection. Science 331, 202–204 (2011).
Valero-Garcés, J. B. L. et al. Palaeohydrology of Laguna de Tagua Tagua (34° 30′ S) and moisture fluctuations in Central Chile for the last 46,000 yr. Journal of Quaternary Science 20, 625–641 (2005).
Vidal, L. et al. Moisture transport across Central America as a positive feedback on abrupt climatic changes. Nature 445, 908–911 (2007).
Waliser, D. E. & Gautier, C. A satellite-derived climatology of the ITCZ. Journal of Climate 6, 2162–2174 (1993).
Wang, X. et al. "Millennial-scale interhemispheric asymmetry of low-latitude precipitation: Speleothem evidence and possible high-latitude forcing," in Ocean Circulation: Mechanisms and Impacts: Past and Future Changes of Meridional Overturning, eds. A. Schmittner, J. C. Chiang & S. R. Hemming (Washington, DC: American Geophysical Union, 2007) 279–295.
Warren, B. A., Why is no deep water formed in the North Pacific? Journal of Marine Research 41, 327–347 (1983).
Zhang, R. & Delworth, T. L. Simulated tropical response to a substantial weakening of the Atlantic thermohaline circulation. Journal of Climate 18, 1853–1860 (2005).
Zhang, R. Anticorrelated multidecadal variations between surface and subsurface tropical North Atlantic. Geophysical Research Letters 34, L12713 (2007). doi:10.1029/2007GL030225
Supplementary References
S1. Ninnemann, U. S. & Charles C. D. Changes in the mode of Southern Ocean circulation over the last glacial cycle revealed by foraminiferal stable isotope variability. Earth and Planetary Science Letters 201, 383–396 (2002).
S2. Hodell, D. A., Charles, C. D. & Sierro, F. J. Late Pleistocene evolution of the ocean's carbonate system. Earth and Planetary Science Letters 192, 109–124 (2001).
S3. Came, R. E., Oppo, D. W. & Curry, W. B. Atlantic Ocean circulation during the Younger Dryas: Insights from a new Cd/Ca record from the western subtropical South Atlantic. Paleoceanography 18, 1086 (2003). doi:1010.1029/2003PA000888
S4. Unpublished data
S5. Curry, W. B. "Late Quaternary deep circulation in the western equatorial Atlantic," in The South Atlantic: Present and Past Circulation, eds. G. Wefer et al. (Berlin, Germany: Springer-Verlag, 1996) 577–598.
S6. Zahn, R. & Stüber, A. Suborbital intermediate water variability inferred from paired benthic foraminiferal Cd/Ca and δ13C in the tropical West Atlantic and linking with North Atlantic climates. Earth and Planetary Science Letters 200, 191–205 (2002).
S7. Lynch-Stieglitz, J., Schmidt, M. W. & Curry W. B. Evidence from the Florida Straits for Younger Dryas ocean circulation changes. Paleoceanography 26, PA1205 (2011). doi:10.1029/2010PA002032
S8. Came, R. E. et al. Variability in the influence of southern source water in the Florida Current since the last glacial. Paleoceanography 23, PA1217 (2008). doi:10.1029/2007PA001450
S9. Boyle, E. A. & Keigwin, L. D. Comparison of Atlantic and Pacific paleochemical records for the last 215,000 years: Changes in deep ocean circulation and chemical inventories. Earth and Planetary Science Letters 76, 135–150 (1985).
S10. Rickaby, R. E. M. & Elderfield, H. Evidence from the high-latitude North Atlantic for variations in Antarctic Intermediate water flow during the last deglaciation. Geochemistry, Geophysics, Geosystems 6, Q05001 (2005). doi:10.1029/2004GC000858
S11. Thornalley, D. J. R., Elderfield, H. & McCave, I. N. Intermediate and deep water paleoceanography of the northern North Atlantic over the past 21,000 years. Paleoceanography 25, PA1211 (2010). doi:10.1029/2009PA001833
S12. Praetorius, S. K. et al. Episodic reductions in bottom-water currents since the last ice age. Nature Geosciences 1, 449–452 (2008).
S13. Curry, W. B. et al. "Millennial-scale changes in ventilation of the thermocline, intermediate and deep waters of the glacial North Atlantic," in Mechanisms of Global Climate Change at Millennial Time Scales, Geophysical Monograph Series, Volume 112, eds. P. U. Clark, R. S. Webb & L. D. Keigwin (Washington, DC: American Geophysical Union, 1999) 59-76.
S14. Elliot M., Labeyrie, L. & Duplessy, J. C. Changes in North Atlantic Deep-Water formation associated with the Dansgaard-Oeschger temperature oscillations (10–60ka). Quaternary Science Reviews 21, 1153–1165 (2002).
S15. Millo, C. et al. Variability of the Denmark Strait Overflow during the Last Glacial Maximum. Boreas 35, 50–60 (2006).
S16. Curry, W. B. & Oppo, D. W. Glacial water mass geometry and the distribution of δ13C of ΣCO2 in the Western Atlantic Ocean. Paleoceanography 20, PA1017 (2005). doi:10.1029/2004PA001021
S17. Fairbanks, R. G. et al. Marine radiocarbon calibration curve spanning 0 to 50,000 years B.P. based on paired 230Th/234U/238U and 14C dates on pristine corals. Quaternary Science Reviews 24, 1781–1796 (2005).


