


« Prev Next »
Introduction
What can the canary in the coal mine tell us? Historically, canaries accompanied coal miners deep underground. Their small lung capacity and unidirectional lung ventilation system made them more vulnerable to small concentrations of carbon monoxide and methane gas than their human companions. As late as 1986, the acute sensitivity of these birds served as a biological indicator of unsafe conditions in underground coal mines in the United Kingdom. Since human health concerns continue to drive the development and application of bioindicators, the loss of ecosystem services (e.g., clean air, drinking water, plant pollinators) has increasingly focused our attention on the health of natural ecosystems. All species (or species assemblages) tolerate a limited range of chemical, physical, and biological conditions, which we can use to evaluate environmental quality. Despite many technological advances, we find ourselves turning to the biota of natural ecosystems to tell us the story of our world.
What Is a Bioindicator?

Figure 1: Comparison of environmental tolerances of (a) bioindicators, (b) rare species, and (c) ubiquitous species
Red areas represent portions of an environmental gradient (e.g., light availability, nitrogen levels) where an individual, species, or community, has fitness or abundance greater than zero. The dashed line represents the peak performance along this particular environmental gradient, while yellow boxes include the optimum range or tolerance. Bioindicators possess a moderate tolerance to environmental variability, compared to rare and ubiquitous species. This tolerance affords them sensitivity to indicate environmental change, yet endurance to withstand some variability and reflect the general biotic response.
© 2010 Nature Education All rights reserved. 
However, not all biological processes, species, or communities can serve as successful bioindicators. Physical, chemical, and biological factors (e.g., substrate, light, temperature, competition) vary among environments. Over time, populations evolve strategies to maximize growth and reproduction (i.e., fitness) within a specific range of environmental factors. Outside an individual's environmental optima, or tolerance range, its physiology and/or behavior may be negatively affected, reducing its overall fitness (Figure 1). Reduced fitness can subsequently disrupt population dynamics and alter the community as a whole (Figure 2). Bioindicator species effectively indicate the condition of the environment because of their moderate tolerance to environmental variability (Figure 1). In contrast, rare species (or species assemblages) with narrow tolerances are often too sensitive to environmental change, or too infrequently encountered, to reflect the general biotic response. Likewise, ubiquitous species (or species assemblages) with very broad tolerances are less sensitive to environmental changes which otherwise disturb the rest of the community. The use of bioindicators, however, is not just restricted to a single species with a limited environmental tolerance. Entire communities, encompassing a broad range of environmental tolerances, can serve as bioindicators and represent multiple sources of data to assess environmental condition in a "biotic index" or "multimetric" approach.
Furthermore, biological processes within an individual can act as bioindicators. For example, cutthroat trout inhabit coldwater streams of the western United States. Most individuals have an upper thermal tolerance of 20°–25°C; thus, their temperature sensitivity can be used as a bioindicator of water temperature. Livestock grazing, burning, and logging are examples of human-related disturbances that can increase water temperature in these streams and be detected by cutthroat trout at various biological scales (Figure 2). An immediate response of cutthroat to thermal pollution occurs at the cellular level. Specifically, heat shock protein (hsp) synthesis increases to protect vital cellular functions from thermal stress. We can quantify hsp levels to measure thermal stress in cutthroat trout and assess how the environment has been altered. If thermal stress persists, such physiological changes are generally tractable at the individual level through behavioral changes and subsequent reductions in growth and development. In the most extreme instances, however, large and persistent thermal alterations can reduce population numbers and even lead to local extinctions, causing compositional shifts to warmwater fisheries.
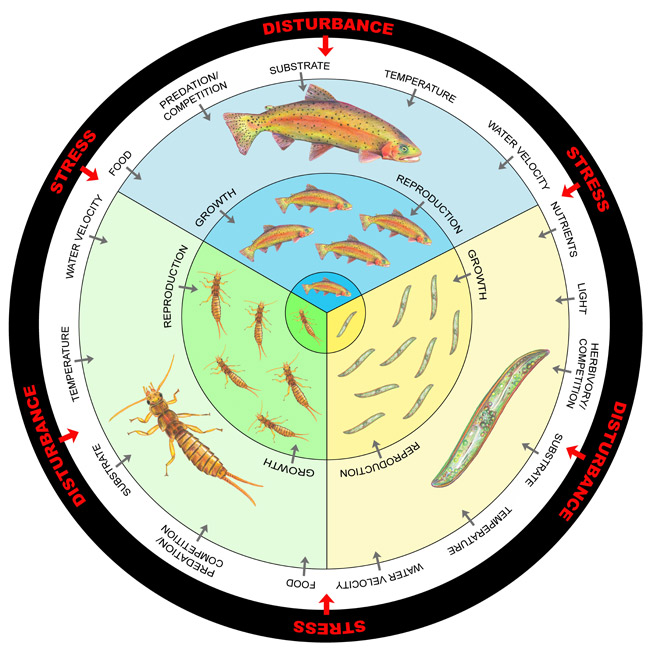
Figure 2: Diagram of the hierarchical levels of an ecosystem that respond to anthropogenic disturbances or natural stress
The white ring of environmental variables includes factors that may be directly altered by disturbance or stress. These alterations may subsequently affect individual organisms, populations, or the community as a whole. The outermost colored ring represents individual organisms (cutthroat trout, Pteronarcys Salmonfly, Phaedoactylum diatom), the middle colored ring represents populations of those organisms, and the innermost colored ring represents the community in which all three species coexist. Disturbance and stress may positively or negatively affect energy resources (e.g., food, light), biotic interactions (e.g., competition, predation, herbivory), and the physical (e.g., water velocity, substrate upon which an organism attaches, uses for refugia, lays eggs), or chemical (e.g., nutrients) environment. These environmental changes may increase or decrease growth and reproduction of an organism, consequently impacting the size and productivity of the population and interactions with other species in the community.
© 2010 Nature Education Illustrations by Summers Scholl. All rights reserved.
Isn't it Called Biomonitoring?
In common usage, the terms "biomonitoring" and "bioindication" are interchangeable, but in the scientific community these terms have more specific meanings. Bioindicators qualitatively assesses biotic responses to environmental stress (e.g., presence of the lichen, Lecanora conizaeoides, indicates poor air quality) while biomonitors quantitatively determine a response (e.g., reductions in lichen chlorophyll content or diversity indicates the presence and severity of air pollution). Hereafter, the term "bioindicator" is used as a collective term to refer to all terms relating to the detection of biotic responses to environmental stress. Within this framework, there are three main functions of bioindicators: 1. to monitor the environment (i.e., physical and/or chemical changes), 2. to monitor ecological processes, or 3. to monitor biodiversity.
Examples of environmental, ecological, and biodiversity indicators can be found in many different organisms inhabiting many different environments. Lichens (a symbiosis among fungi, algae, and/or cyanobacteria) and bryophytes (mosses and liverworts) are often used to assess air pollution. Lichens and bryophytes serve as effective bioindicators of air quality because they have no roots, no cuticle, and acquire all their nutrients from direct exposure to the atmosphere. Their high surface area to volume ratio further encourages the interception and accumulation of contaminants from the air.
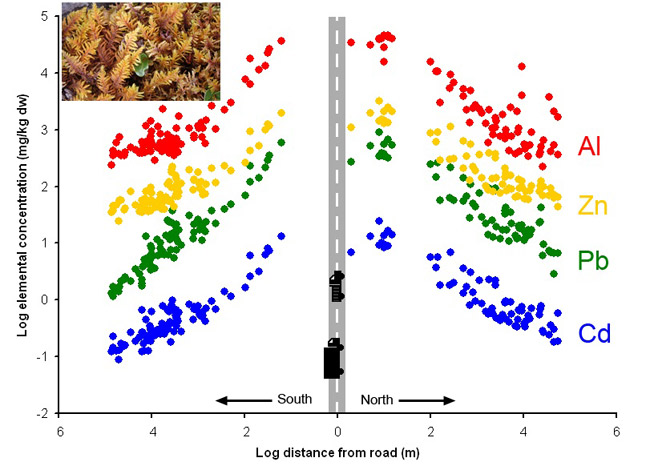
Figure 3: Relationship of elemental concentration within moss tissue (inset is Hylocomium splendens) to distance from the road in Alaska, USA
Each element is represented by a different set of colored dots (red, Aluminum; yellow, Zinc; green, Lead; blue, Cadmium). The greatest concentration of each element occurred close to the road and declined with distance from the road, demonstrating a marked impact of overland transport of mined ore on the biota.
© 2010 Nature Education Modified from Hasselbach et al. 2005. All rights reserved.
As an example, Hasselbach et al. (2005) used the moss Hylocomium splendens as an environmental indicator of heavy metals in the remote tundra ecosystem of northwestern Alaska. Here, mineral ore is mined from Red Dog Mine, the world's largest producer of zinc (Zn), and is trucked along a solitary road (~75 km in length) to storage facilities on the Chukchi Sea. Hasselbach and her colleagues examined whether this overland transport was affecting the surrounding terrestrial biota. Heavy metal content within moss tissue was compared at varying distances from the road (Figure 3). Metal concentrations in moss tissue were greatest adjacent to the haul road and decreased with distance, thus validating the hypothesis that overland transport was indeed altering the surrounding environment. In this example, lichens were used as biomonitors, using the quantitative measurement of metal concentrations within individual lichens.
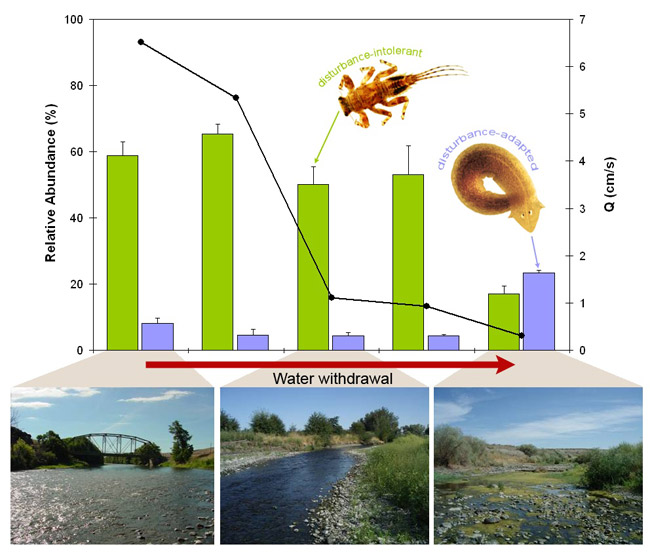
Figure 4: Aquatic macroinvertebrates document a shift in community composition related to human-induced water withdrawals.
Bars represent the relative abundance of disturbance-intolerant taxa (green, EPT or Ephemeroptera-Plecoptera-Trichoptera), and disturbance-adapted taxa (blue, non-insects). Line represents water discharge (Q) at each site, which significantly reduces along an intensively managed 36-km section of the Umatilla River, Oregon, USA. Disturbance-intolerant EPT taxa markedly decline following an 85% reduction of stream flow (far right bar). Accordingly, disturbance-adapted non-insects thrive and increase under stressed conditions.
© 2010 Nature Education Modified from Miller et al. (2007). All rights reserved.
Similar to lichens and bryophytes, aquatic macroinvertebrates possess many of the hallmark traits of good bioindicators (Table 1). The most common application of macroinvertebrates as bioindicators, due to their speciose nature, is at the community scale. An unimpaired stream or river commonly contains more than 40 identifiable taxa, representing a range of habitat preferences and life history strategies. This taxonomic and functional diversity can capture the myriad responses to different stressors and disturbances, including the presence of fine sediment, metals, nutrients, and hydrologic alterations. Accordingly, macroinvertebrate communities have been frequently used as environmental, ecological, and biodiversity indicators. Currently, all 50 states of the United States use aquatic macroinvertebrates to assess the biological health of streams and rivers. For example, Miller et al. (2007) quantified aquatic macroinvertebrates to identify a threshold separating irrigation water withdrawals, which adversely affected the biota of river systems, from withdrawal levels that did not influence the community. Water withdrawals exceeding 85% of ambient levels, combined with elevated water temperatures, reduced the proportion of disturbance-intolerant taxa, consequently shifting the community toward more disturbance-adapted species (Figure 4). Resource managers can use the integrated response of the entire macroinvertebrate community to relate how much water can be taken for irrigation before negative biological responses are seen, while also using the responses of individual taxa, or groups of taxa, to indicate the mechanism(s) of environmental degradation (e.g., increased temperature or fine sediment levels) by which water withdrawals adversely impact aquatic ecosystems. Thus macroinvertebrate populations can be used as biodiversity and ecological indicators at the community scale and environmental indicators at the population scale.
|
Good indicator ability
|
Provide measurable response (sensitive to the disturbance or stress but does not experience mortality or accummulate pollutants directly from their environment) | |
|
Response reflects the whole population/community/ecosystem response | ||
|
Respond in proportion to the degree of contamination or degradation | ||
|
Abundant and common |
Adequate local population density (rare species are not optimal) | |
| Common, including distribution within area of question | ||
| Relatively stable despite moderate climatic and environmental variability | ||
|
Well-studied
|
Ecology and life history well understood | |
|
Taxonomically well documented and stable | ||
|
Easy and cheap to survey | ||
|
Economically/commercially important
|
Species already being harvested for other purposes | |
|
Public interest in or awareness of the speces | ||
| Table 1: Regardless of the geographic region, type of disturbance, environment, or organism, good bioindicators often share several characteristics. | ||
Why Are Bioindicators Better Than Traditional Methods?
Scientists have traditionally conducted chemical assays and directly measured physical parameters of the environment (e.g., ambient temperature, salinity, nutrients, pollutants, available light and gas levels), whereas the use of bioindicators uses the biota to assess the cumulative impacts of both chemical pollutants and habitat alterations over time. Consequently, the use of bioindicators is fundamentally different from classic measures of environmental quality and offers numerous advantages. First, bioindicators add a temporal component corresponding to the life span or residence time of an organism in a particular system, allowing the integration of current, past, or future environmental conditions. In contrast, many chemical and physical measurements only characterize conditions at the time of sampling, increasing the probability of missing sporadic pulses of pollutants. In addition, contaminants can occur in exceedingly low concentrations. Tedious analyses with highly sensitive technologies, at a prohibitive cost, are required to detect such low concentrations. Once identified, scientists must link any potential biological hazard with these trace amounts of contaminants, when such links are largely unknown. Alternatively, the tolerance range of bioindicators provides a picture of biologically meaningful levels of pollutants, no matter how small.
Another benefit of the use of bioindicators is their ability to indicate indirect biotic effects of pollutants when many physical or chemical measurements cannot. Clearly, a pipe dumping phosphorus-rich sewage into a lake will adversely impact the ecosystem. Phosphorous commonly limits primary production in freshwater ecosystems; therefore, we may predict that elevated phosphorus concentrations will increase the growth and reproduction of some species. Chemical measurements, however, may not accurately reflect a reduction in species diversity or how the growth and reproduction of other species may decline due to competitive exclusion. Indirect contaminant effects are especially difficult to glean from chemical or physical measurements in the case of bioaccumulation. Metals, among other contaminants, accumulate in biological organisms, causing metal concentrations to amplify through food webs. Thus, contaminant levels at higher trophic levels may be underrepresented by physical or chemical measurements.
Lastly, given the thousands of substances and factors to monitor, scientists now understand that the biota itself is the best predictor of how ecosystems respond to disturbance or the presence of a stressor. While the use of whole communities (and all species' responses within them) can be informative, problems can arise in especially speciose habitats. An average tropical rainforest may contain approximately 300 tree species per hectare and enumerating the response of each individual species to a disturbance is clearly unrealistic. Furthermore, a clear bioindication signal can be obscured by an excessive number of divergent species' responses (e.g., some species may increase while others decrease). In these cases, to integrate all the direct and indirect effects of a disturbance scientists focus only on a subset of the biota or single species to tell the story. This narrowed approach makes monitoring more biologically relevant and cost-effective. Moreover, a common problem with chemical and physical measurements is that they simplify a complicated response inherent in these species-rich habitats. Bioindicators rely upon the complicated intricacies of ecosystems and use a representative or aggregated response to convey a dynamic picture of the condition of the environment.
What Makes a Good Bioindicator?
Considering the 1.7 million species that currently documented on Earth, how do we chose just one as a bioindicator? The answer is simple: No single species can adequately indicate every type of disturbance or stress in all environments. Depending upon the specific environment, the species present, and local disturbances, appropriate bioindicator species or groups of species need to be selected. Ecologists have established a broad set of criteria that species must exhibit to be considered good bioindicators (see Table 1).
Benefits and Disadvantages of Bioindicators
The numerous benefits of bioindicators have spurred legislative mandates for their use in countries around the world and their inclusion in several international accords. Yet bioindicators are not without their problems. Like the canaries in the coal mine, we rely upon the sensitivity of some bioindicators to function as early-warning signals. In some instances, we cannot discriminate natural variability from changes due to human impacts, thus limiting the applicability of bioindicators in heterogeneous environments. Accordingly, populations of indicator species may be influenced by factors other than the disturbance or stress (e.g., disease, parasitism, competition, predation), complicating our picture of the causal mechanisms of change. A second criticism of the use of bioindicators is that their indicator ability is scale-dependent. For example, a large vertebrate indicator (e.g., a fish) may fail to indicate the biodiversity of the local insect community. Third, bioindicator species invariably have differing habitat requirements than other species in their ecosystem. Managing an ecosystem according to the habitat requirements of a particular bioindicator may fail to protect rare species with different requirements. Finally, the overall objective of bioindicators is to use a single species, or a small group of species, to assess the quality of an environment and how it changes over time, but this can represent a gross oversimplification of a complex system.
Like all management tools, we must be conscious of its flaws. However, the limitations of bioindicators are clearly overshadowed by their benefits. Bioindicators can be employed at a range of scales, from the cellular to the ecosystem level, to evaluate the health of a particular ecosystem. They bring together information from the biological, physical, and chemical components of our world that manifest themselves as changes in individual fitness, population density, community composition, and ecosystem processes. From a management perspective, bioindicators inform our actions as to what is and is not biologically sustainable. Without the moss in the tundra, the cutthroat in the mountain stream, and the canary in the coal mine, we may not recognize the impact of our disturbances before it is too late to do anything to prevent them.
References and Recommended Reading
"1986: Coal mine canaries made redundant." BBC News. December 12, 1986.
Carignan, V. & M.-C. Villard. Selecting indicator species to monitor ecological integrity: A review. Environmental Monitoring and Assessment 78, 45–61 (2002).
Hasselbach, L. et al. Spatial patterns of cadmium and lead deposition on and adjacent to National Park Service lands in the vicinity of Red Dog Mine, Alaska. Science of the Total Environment 348, 211–230 (2005).
Iwama, G. K. et al. Heat shock protein expression in fish. Reviews in Fish Biology and Fisheries 8, 35–56 (1998).
Miller, S. W. et al. Resistance and resilience of macroinvertebrates to irrigation water withdrawals. Freshwater Biology 52, 2494–2510 (2007).
Rainio, J. & Niemelä, J. Ground beetles (Coleoptera: Carabidae) as bioindicators. Biodiversity and Conservation 12, 487–506 (2003).
Rosenberg, D. M. & Resh, V. H. Freshwater Biomonitoring and Benthic Macroinvertebrates. New York, NY: Chapman and Hall, 1992.
Tanabe, S. & Subramanian, A. Bioindicators of POPs: Monitoring in Developing Countries. Kyoto, Japan: Kyoto University Press, 2006.


