


To compare all the genes of one organism to those of another organism, we must first know how to define the entire gene sequence of each organism. However, looking at all of an organism's genes can be quite daunting. Sometimes, a better option is to consider only those genes expressed by an organism, because these genes may represent just a portion of all the genetic material that the organism contains. That is, an organism may only use a small fraction of its entire genetic sequence, otherwise known as its genome.
What is the genome? What is genomics?
What is a DNA microarray?
Whereas Northern blots allow scientists to measure the expression of one or several genes at a time, DNA microarrays permit gene expression analysis on a massive scale. In fact, microarray analysis enables researchers to look at expression patterns across all of the genes in an entire genome — and to do so in a single procedure. As a result, it is now possible to monitor the activity of tens of thousands of genes simultaneously.
Microarrays are particularly useful when researchers know that certain genes are being transcribed into mRNA, but they aren't sure exactly what those genes are. For example, scientists know that the expression of certain genes differs depending on environmental conditions, but how can they directly observe which genes vary under which conditions? In short, they can use microarray analysis.
How does microarray analysis work?
In order to conduct microarray analysis (and therefore determine which genes in a sample are active), researchers must first isolate mRNA from a target sample, convert it into complementary DNA (cDNA), and label the cDNA with a fluorescent dye. The fluorescently labeled cDNA is then added to a glass slide or silicon chip upon which thousands of tiny dots of single-stranded DNA have been arranged in a grid pattern. No bigger than the period at the end of this sentence, each dot of DNA in the grid corresponds to a different gene. If any fluorescent cDNA binds to any one of these dots, researchers know that the corresponding genes are active in the sample. But how, exactly, does this process work? To better understand how microarray analysis is carried out, consider the example experiment described in the following sections.
Growing bacteria under two different conditions
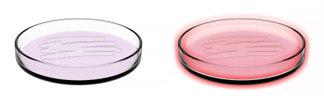
Gene expression in colonies of E. coli bacteria can change when these colonies are exposed to short periods of intense heat. But exactly how do the patterns of gene expression differ? What genes are expressed under one condition, and not the other? The best way to go about answering this question is to do a microarray analysis of the genomes in each experimental condition: normal temperature and heat-exposed. The first step is to create the two conditions by exposing one colony of E. coli to normal temperatures and the other colony to a short burst of high temperature (Figure 1).
Converting RNA
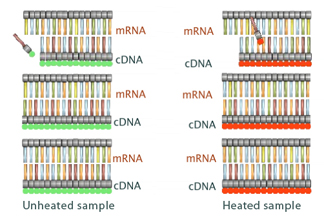
After this treatment is complete, the bacterial cells are removed from both culture plates and mRNA is extracted from them. Reverse transcriptase and fluorescently-labeled nucleotides are then added to the two test tubes containing the extracted mRNA. Specifically, each tube receives nucleotides marked with a particular fluorescent color: red or green. By using one fluorescent color for the tube of normal RNA and another color for the heat-exposed RNA, researchers can follow the genetic material from each colony during later stages of analysis.
Within each test tube, the newly synthesized, fluorescently-labeled cDNA strands form complementary DNA strands with the original mRNA strands (Figure 2). Next, the mRNA is specifically degraded so that only the cDNA copy of the mRNA message is left behind. At this point, the cDNA that was synthesized in each tube is associated with its corresponding color (red or green). Remember, this sample-specific labeling means that the scientists will easily be able to track which cDNA came from normal cells and which cDNA came from heat-exposed cells during later phases of the microarray process.
Applying solution to the DNA chip
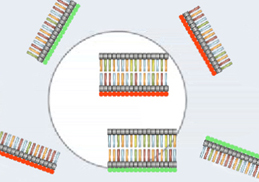
Figure 3: Fluorescently-labeled cDNAs from the normal and high temperature samples bind to complementary DNA strands on the DNA chip.
After the cDNA is applied to the microarray chip, the cDNA molecules will bind to any complementary strands that exist on the chip (Figure 3). As different genes are on different dots, some of the cDNA in the sample binds to certain dots, some binds to other dots, and some does not bind to any dots whatsoever. This binding identifies which genes were expressed in the original bacterial colonies, because the bound cDNA is joining with partner strands that are already preprogrammed onto the microarray chip. Then, any unbound cDNA is washed away from the chip with a careful rinse, so the only cDNA molecules left on the chip are those that found complementary partners on the chip and bound with them.
Imaging the chip
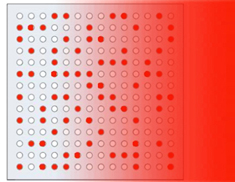
Figure 4: Scanning the microarray chip.
Analyzing the imaged data
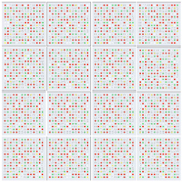
Figure 5: Multiple gene chips are needed to scan the entire genome for expression patterns.
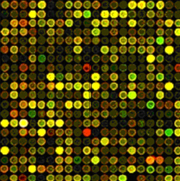
Consequently, the raw data generated from multiple microarray chips look like sparkling patterns of red, green, and yellow dots. For the above experiment with bacterial colonies, these data tell a story of gene expression across the entire E. coli genome under two different environmental temperatures (Figure 6).
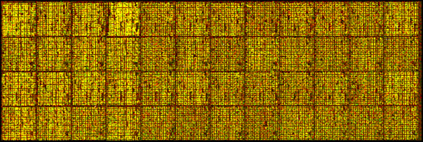
Figure 6: A photograph of real microarray chip data, arranged in a grid. Multiple chips, such as the ones shown here, reveal expression data for an entire genome.


