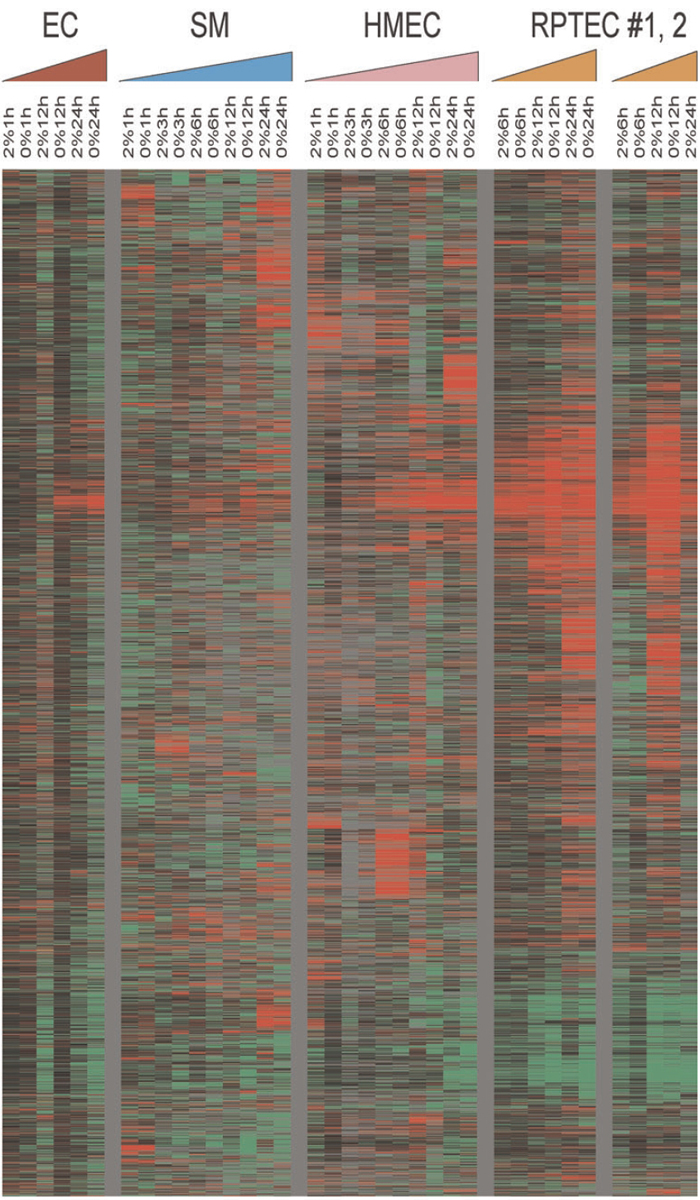
Data from individual elements or genes are represented as single rows, and different time points in the time courses (triangles) are shown as columns. Red and green denote expression levels of samples cultured under hypoxia (2% O2) or anoxia (0% O2) greater or lower, respectively, than baseline values of samples cultured under ambient air (;21% O2). The intensity of the color reflects the magnitude of the change from baseline. The color of the triangles represents the time course of the different cell types (red, ECs; blue, SMCs; pink, HMECs; orange, RPTECs). The vertical red bar marks a cluster of genes induced in all cells, termed the ‘‘common hypoxia genes’’
This image is linked to the following Scitable pages:
How can low oxygen levels lead to developmental abnormality and disease? It seems that proteins called hypoxia-inducible factors (HIFs) can affect gene expression in low-oxygen conditions.


Comments
CloseComments
Please Post Your Comment