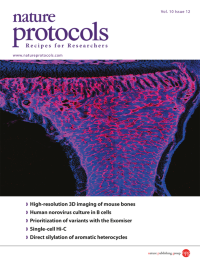
Volume 10
-
No. 12 December 2015
A tile scan confocal microscopic image of a tibial longitudinal section showing the organization of blood vessels in a mouse long bone. Immunofluorescence staining for the endothelial marker endomucin is shown in red. Fluorescently stained nuclei are shown in blue (DAPI). Taken from the protocol by Kusumbe et al. doi:10.1038/nprot.2015.125. Cover design by Jamel Wooten.
-
No. 11 November 2015
Visualization of a cell-lineage reconstruction of early nervous system development in Drosophila. The reconstruction was performed with TGMM and CATMAID, using SiMView light-sheet microscopy images. Imaged cell nuclei are shown in grey (200 min after egg laying (AEL)). Tracks and endpoints of progenitor cells are shown as colored lines (purple to yellow: 170–320 min AEL) and green spheres, respectively. Taken from the protocol by Fernando Amat et al. DOI: 10.1038/nprot.2015.111. Cover design by Jamel Wooten.
-
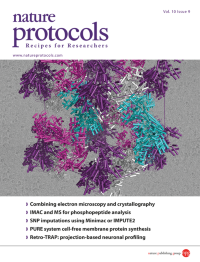
No. 10 October 2015
The cover image is reproduced from a mixed oil and acrylic on canvas painting by Jestin George. The image depicts the artist's interpretation of the immunostained microvascular network generated during the metatarsal angiogenesis assay. Jestin George is a research technician working on the LRG1 project in the Department of Cell Biology, University College London Institute of Ophthalmology, London, UK. Based on the Protocol by Weihua Song et al. doi: 10.1038/nprot.2015.097.
-
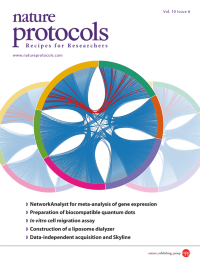
No. 9 September 2015
The X-ray crystal structure of Cascade (CRISPR-associated complex for antiviral defense) was determined using a hybrid approach that integrates data from electron microscopy. Cascade assemblies, colored purple, pink, gray, and cyan, are packed into the crystallographic unit cell, and are displayed over the top of an electron micrograph. Based on the protocol by Ryan N. Jackson et al. DOI: 10.1038/nprot.2015.069. Cover design by Jamel Wooten.
-
No. 8 August 2015
Single-cell time traces of fluorescent gene expression reporters. This protocol takes advantage of high-throughput microfluidics and automated fluid handling, combined with quantitative time-lapse microscopy, to follow the dynamics of gene activation in single yeast cells. Taken from the protocol by Anders S. Hansen et al. DOI: 10.1038/nprot.2015.079. Cover design by Jamel Wooten.
-
No. 7 July 2015
Shown are multinucleated skeletal myotubes derived from human induced pluripotent stem cells generated from a person with Duchenne muscular dystrophy and assessed by immunofluorescence staining for myosin heavy chain (red). Nuclei are shown in blue. Taken from the protocol by Maffioletti et al. doi: 10.1038/nprot.2015.057. Cover design by Jamel Wooten.
-
No. 5 May 2015
Average DNA methylation levels across gene bodies and the 15-kb flanking regions in scRRBS datasets from human single sperm cells and single male pronuclei at different time points after ICSI, showing general features of DNA methylation distributions along the intra- and intergenic regions. Taken from the protocol by Guo et al. doi: 10.1038/nprot.2015.039. Cover design by Jamel Wooten.
-
No. 4 April 2015
A tiling confocal microscopic image of brain coronal section shows blockage of downstream cerebral microvascular perfusion supplied by the middle cerebral artery (MCA) in a rat subjected to embolic MCA occlusion. Taken from the protocol by Zhang et al. doi: 10.1038/nprot.2015.036. Cover design by Jamel Wooten.
-
No. 3 March 2015
Neurolucida reconstruction of eight simultaneously recorded cortical neurons with double-colored dots indicating the putative synaptic contacts. Taken from the protocol by Wang et al. doi: 10.1038/nprot.2015.019. Cover design by Jamel Wooten.
-
No. 2 February 2015
Pseudocolored mask image obtained after segmentation of DAPI-stained cell nuclei. Individual nuclear stencils are used to measure the integrated DAPI intensity, which is then used to determine the cell cycle stage of each individual cell in the population. Taken from the protocol by Roukos et al. doi: 10.1038/nprot.2015.016. Cover design by Jamel Wooten.
-
No. 1 January 2015
The protocol by Wälchli et al. describes how to monitor newly forming, and established, functional blood vessels in the postnatal mouse brain. An isolectin B4positive (IB4+, red) endothelial tip cell of a sprouting blood vessel extends multiple filopodia opposite to an Evans blue–positive (EB+, cyan)/IB4+ functional, perfused blood vessel in an 8-day-old mouse brain cortex. Cells are stained so that IB4+ blood vessel endothelial cells are red, GFAP+ astrocytes and GFAP+ radial glia are green and DAPI+ cell nuclei are blue.