A set of troubling charts shows how little progress nations have made toward limiting greenhouse-gas emissions.
By Jeff Tollefson
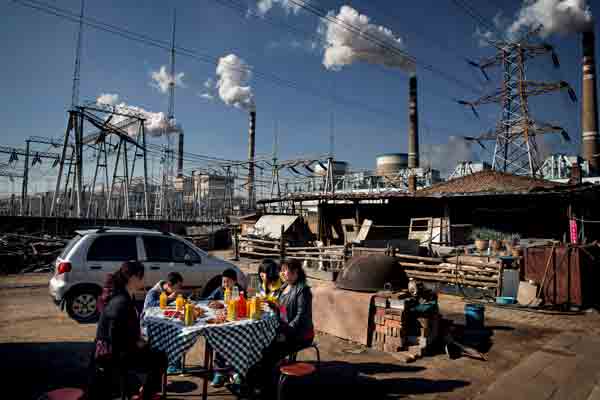
Bruno Rodriguez is only 18, but he has seen enough in his time on Earth to know that he must to do something for the planet. Inspired by the student climate strikes in Europe, he founded Youth for Climate Argentina in his home country. The group drew more than 8,000 demonstrators to the national congress in May, and its leaders worked with senators to pass a resolution on 17 July, declaring a climate emergency.
Argentina is responsible for less than 1% of annual global emissions, but Rodriguez says the science is clear: everyone must take aggressive action if the world is to avoid a massive environmental and humanitarian crisis. “There is no middle ground,” says Rodriguez. “We need radical industrial transformation.”
Rodriguez is part of a grass-roots climate movement that is gaining momentum across the globe. It is driven in part by a new generation of young activists, and by mounting evidence that global warming is accelerating, which is increasing the odds of severe heatwaves in Europe, deadly fires in the western United States and massive tropical storms fuelled by increasingly warm oceans, among other things. With greenhouse-gas emissions still rising, frustrated activists are taking to the streets to pressure politicians to keep their promises.
This new activism will be on full display as groups in 150 countries stage strikes around next week’s global climate summit in New York City, convened by United Nations secretary-general António Guterres. The meeting comes nearly four years after the Paris climate agreement, which seeks to limit global temperatures to 1.5–2 °C above pre-industrial levels. Guterres’s goal is to build momentum as countries prepare to submit new commitments next year.
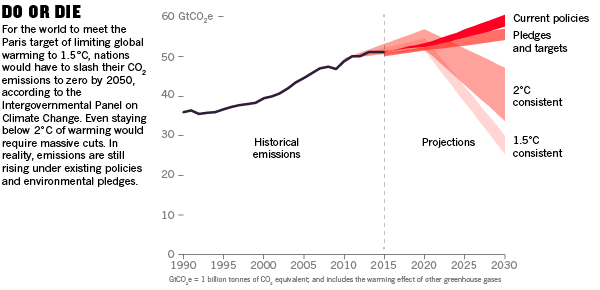
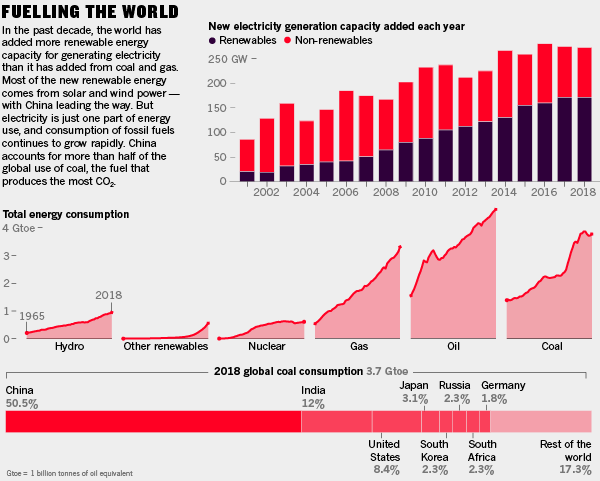
Whatever they decide, nations will have to reckon with some difficult numbers that will ultimately determine whether the world can avoid the rapidly approaching climate meltdown. Nature documents the scale of the challenge in an infographic that explores energy use, carbon dioxide pollution and issues of climate justice. At a time when countries have pledged to curb greenhouse gases sharply, the data show that annual emissions spiked by 2.1% in 2018 — owing in part to increased demand for coal in places such as China and India.

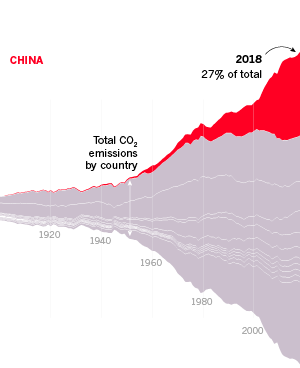
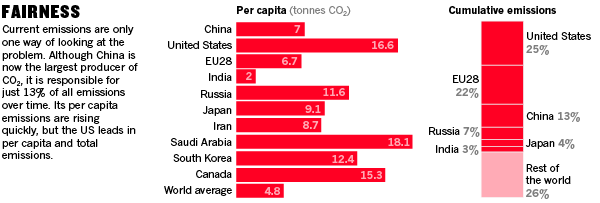
China: Where China goes, the world goes. The country is the largest source of CO2 and its emissions are growing while other big emitters are turning the corner. CAT says China is on track to see its emissions peak by 2030 — in line with its Paris pledges — but that is not consistent with keeping global warming below 2 °C.
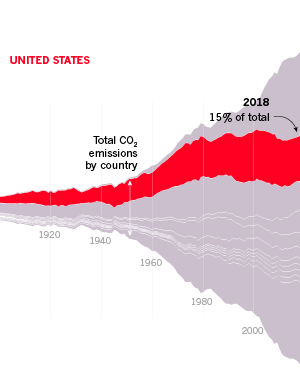
United States: US emissions surged in 2018, but they have been declining generally over the past decade because coal use has fallen, in favour of natural gas and renewables. However, President Donald Trump is rolling back provisions to curb greenhouse-gas pollution and wants to pull the country out of the Paris accord.
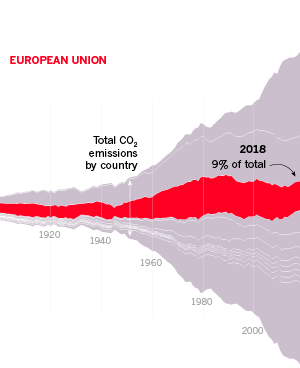
European Union: The 28 EU nations account for more than one-fifth of CO2 emissions over time, but their collective annual emissions have dropped by more than 20% since 1990. Some estimates suggest the EU is on track to meet its Paris targets. Coal use is dropping but remains a major source of emissions.
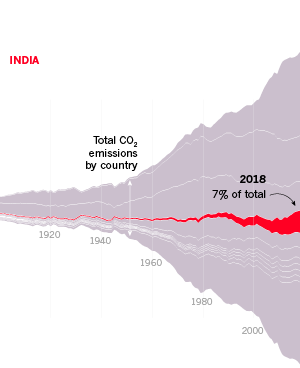
India: India has contributed much less to global warming than have other large countries, on a per capita basis. Although its energy use and coal consumption are growing rapidly, the country is also emerging as a leader in renewable energy.
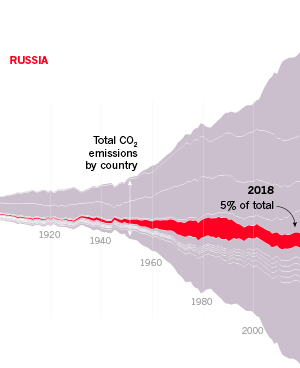
Russia: The collapse of industry after the break-up of the Soviet Union caused CO2 emissions to plunge, but they have been rising since. Russia has invested little in renewables such as solar and wind and the CAT gives Russia its lowest rating.
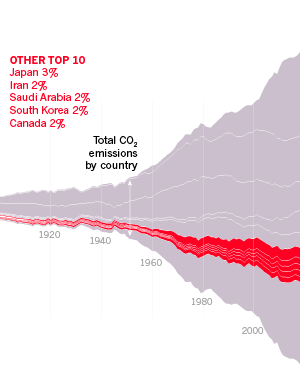
Other top ten: Japan, Iran, Saudi Arabia, South Korea and Canada.
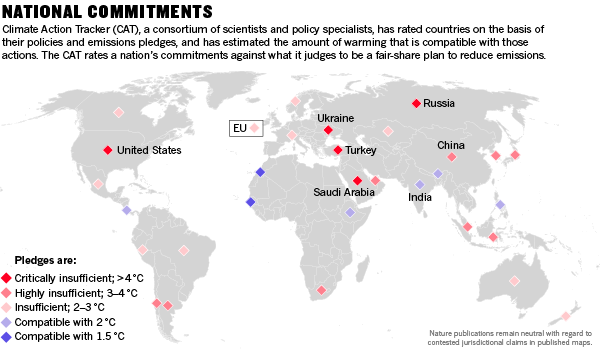
“Global progress is stalling at a time when it is supposed to be accelerating,” says Paola Yanguas Parra, a climate-policy analyst at the environmental think tank Climate Analytics, based in Berlin.
So far, there is little evidence that political leaders are willing or able to meet their collective Paris targets. Even so, some veteran climate experts see hope in the strikes, marches and other protests that are taking place around the world. “Civil disobedience erupts when injustice has been collectively determined to be unbearable,” says Christiana Figueres, who helped to usher in the Paris agreement as head of the UN climate convention in 2015. “And that is where we are today.”
Many scientists consider the Paris thresholds to be unattainable. Greenhouse-gas emissions have already driven up average global temperatures by around 1 °C, and limiting further warming to 0.5 °C would require roughly halving global emissions within the next decade, then cutting them to zero by mid-century, according to the Intergovernmental Panel on Climate Change. Even under the most optimistic assumptions, current national commitments have put the world on a path to more than 3 °C of warming compared with pre-industrial times.
But questions about the political — and even technological — feasibility of meeting the Paris thresholds have not deterred the new generation of activists, many of whom are inspired by the Swedish teenager Greta Thunberg. They have drawn attention to issues of moral responsibility and social justice, by focusing on evidence that climate disruptions will most harm the people who have contributed least to the problem. Such concerns led Philip Alston, the UN special rapporteur on extreme poverty and human rights, to declare that climate change is “an unconscionable assault on the poor” in a report to the Human Rights Council in June.
Figueres says the youth activists are absolutely correct and totally justified in their anger. The question is whether righteous anger can push society to make immensely difficult and urgent decisions. “This transformation needs to happen in the next ten years,” she says, “and it has to involve everyone.”
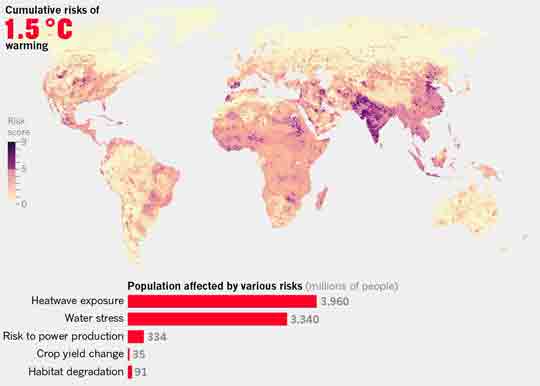
As global temperatures rise, they put billions of people at risk of heatwaves, water shortages and a range of other problems. And these impacts fall hardest on the poorest and most vulnerable people. The map below shows the cumulative risks from major climate impacts with 2 °C of warming; the chart estimates how many people would be affected by a selection of those risks.
This article is part of Covering Climate Now, a global collaboration of more than 250 media outlets to highlight the issue of climate change.
Sign up for the daily Nature Briefing email newsletter
Stay up to date with what matters in science and why, handpicked from Nature and other publications worldwide.
Sign Up