

Key Points
- Recent technical developments have complemented catheter-based pH monitoring for diagnosing gastroesophageal reflux.
- Wireless pH monitoring improves patient comfort during monitoring and allows monitoring gastroesophageal reflux over extended (i.e., 48 to 72 hours) periods of time. Still, the information gathered by these systems is limited to pH data only.
- Combined multichannel intraluminal impedance and pH (MII-pH) represents a change in the reflux testing paradigm. Reflux is detected by changes in intraluminal resistance determined by the presence of liquid or gas inside the esophagus, and pH data are used to classify reflux as acid or nonacid.
- Combined MII-pH is the preferred method of testing patients with persistent symptoms on acid suppressive therapy, as it can clarify whether symptoms are associated with acid or nonacid reflux or not associated with reflux.
Introduction
Gastroesophageal reflux disease (GERD) is a highly prevalent disease in the United States, where 40% of the adult population frequently complains of heartburn, one of the cardinal symptoms of GERD.1 Sandler et al. have estimated the total (i.e., direct and indirect) cost of treating GERD as $9.8 billion (in 1998 dollars), ranking is as the fourth most prevalent gastrointestinal disease in the U.S. (19 million cases/year) and the most expensive disease of the alimentary tract.2 Around the world the prevalence of GERD symptoms varies from South America (e.g., frequent GERD symptoms are reported by 21% of the adult Argentinean population)3 to Asia (e.g., 4.7% of the Korean population and 12.1% of the Japanese population reports heartburn at least once a month)4, 5 and to Europe (e.g., 21% of the Finnish population reports at least monthly heartburn, whereas the prevalence of reflux symptoms in the Norwegian population is around 31%)6, 7.
Ever since Alison8 described reflux esophagitis in 1946, the armamentarium of clinically available tools to diagnose GERD has become more sophisticated as new technologies and approaches have been introduced. This has been fueled by the need to investigate the nature of esophageal symptoms (heartburn, regurgitation, dysphagia, chest pain, etc.) in the absence of endoscopic evidence of esophageal mucosal lesions and more recently to understand the causes of persistent esophageal symptoms in patients on potent acid suppressive therapy.
This review discusses the role of esophageal pH monitoring and combined multichannel intraluminal impedance and pH monitoring (MII-pH monitoring) in the diagnosis of GERD.
Esophageal pH Monitoring
Spencer9 in 1969 published the first report on the use of prolonged intraesophageal pH monitoring to study GERD, but it was not until the mid-1970s that Johnson and DeMeester10 established the first normal values for this technique. Intraesophageal pH monitoring facilitates the study of the role of acidic gastroesophageal reflux in patients with esophageal symptoms in the absence of endoscopically visible lesions (i.e., endoscopy negative reflux disease). Over the years many experts have accepted this technique as the gold standard in diagnosing GERD. Esophageal pH can be monitored over extended periods of time using either conventional, catheter-based systems or more recently wireless, pH capsules attached to the distal esophagus.
Conventional, Catheter-Based pH Monitoring
The principal components of catheter-based pH monitoring systems are (1) flexible catheter with pH-sensor(s) and (2) a data logger. Esophageal pH catheters use either a glass or antimony pH sensor, and the reference electrode can be placed either outside the esophagus (external reference) or built into the esophageal catheter (i.e., built-in internal reference). Laboratory studies suggest that the more expensive glass electrodes are superior to monocrystalline antimony electrodes, as they respond much quicker to changes in pH, and have less drift and a better linear response.11 However, in clinical settings the less expensive antimony electrodes provide similar results and better insertion comfort compared to the larger (up to 4.5 mm) glass-electrodes.12 Although catheters with built-in internal reference are technically more challenging to make, they are more reliable than catheters using external cutaneous reference electrodes for which losing skin contact or perspiration-induced changes in the ionic composition surrounding the reference electrode can lead to artifactual pH values.
In preparation for esophageal pH monitoring, the sensors are calibrated in buffer solutions with distinct pH values chosen by the manufacturer of the equipment. Esophageal pH monitoring is usually an ambulatory procedure, and patients are asked to fast for at least 4 hours prior to placing the pH probe. The catheter is typically inserted transnasally, and the pH sensor is placed in the distal esophagus. In the adult population the distal esophageal pH sensor is positioned 5 cm above the manometrically located proximal border of the lower esophageal sphincter.3 As manometry is difficult or impossible to perform in children and infants, pediatric gastroenterologists frequently use the height-based Strobel formula to determine the depth of placement of the esophageal pH sensor in this group of patients.13 On occasion, more consistent placement of the distal esophageal pH sensor in children and infants can be accomplished under fluoroscopic guidance in reference to the diaphragm. The position in adults was reached by global consensus and is considered at an optimal depth in order to monitor distal esophageal acid exposure while preventing accidental slipping into the stomach. Although virtually all laboratories use 5 cm above the lower esophageal sphincter (LES) location (Figure 1), individual groups prefer also using a second proximal esophageal site (15 or 20 cm above the LES) to better characterize reflux episodes. In other circumstances (e.g., on acid suppressive therapy) a second pH sensor is placed in the stomach, 10 cm below the LES in order to monitor intragastric acidity. Once the catheter is positioned and taped to the nose to limit its movement, the recording of pH data is initiated. Most commercially available systems sample data points every 4 to 5 seconds. During the monitoring period patients are instructed to reproduce as much as possible the daily scenarios during which they experience symptoms. Patients are provided with diaries and asked to record the timing and content of ingested meals, periods of upright and recumbent position, and the time of symptoms. Typically ambulatory pH data are recorded over 24 hours, although recent data suggest that 16-hour studies provide accurate information and improve patient tolerance.14 The discomfort experienced by some patients due to the presence of the pH catheter during the day of monitoring limits the clinical applicability of catheter-based ambulatory pH monitoring. Even though telemetric intragastric pH recordings (using the Heidelberg capsule) were first reported in mid-1960s,15, 16 it was not until recently that the U.S. Food and Drug Administration approved catheter-free pH monitoring systems for clinical use.17 The Bravo® system (Medtronic Inc. Minneapolis, MN) includes a 26 mm  5.5 mm 6.5 mm capsule containing an antimony pH electrode with internal reference, miniaturized electronics with radiofrequency transmitter and battery, a capsule delivery system, and an external receiver to monitor intraesophageal pH (Figure 2). The capsule delivery system is passed transorally and the capsule is positioned 6 cm above the endoscopic determined gastroesophageal mucosal separation ("Z-line"). Once the capsule is "pierced" to the esophageal mucosa, the delivery system is removed and pH data are recorded from the distal esophagus every 5 seconds. The pH measurements are transmitted to an external receiver that stores these data. In addition to improved patient comfort, this system has the advantage of a fixed placement of the pH electrode, eliminating the risk of "slipping" into the stomach, and also prolonged (48- to 72-hour) recording. These advantages are unfortunately offset by the high cost of the pH capsule, the need of endoscopy for accurate placement, the risk of data loss during the wireless transmitting/receiving process, and the impracticality of having multiple recording sites. The elimination of the catheter, not surprisingly, has led to an improved acceptance for ambulatory pH monitoring. A study interviewing a group of patients who underwent both catheter-based and catheter-free pH monitoring reported that, if given the choice, patients certainly would prefer the wireless over the catheter-based system. For patients who experience severe discomfort from the capsule attached to the distal esophagus, a second endoscopy is required to detach the capsule. In contrast, excessive discomfort experienced from the pH catheter can be much easier alleviated by simply instructing the patient to withdraw the catheter.
Figure 1: Ambulatory pH catheter placement.
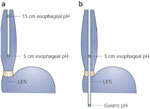
a: Dual-channel proximal and distal esophageal pH monitoring is used to monitor patients with reflux symptoms off therapy. b: Dual channel distal esophageal and gastric pH monitoring is used to monitor patients with reflux symptoms on acid suppressive therapy.
Figure 2: Catheter free pH monitoring system (Bravo system).
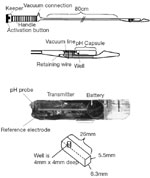
(Source: Adapted from Pandolfino et al.17 with permission from Blackwell Publishing)
Esophageal pH Data Interpretation
Both catheter-based and catheter-free pH monitoring systems provide information on the presence of acid in the esophagus. The main questions to which esophageal pH monitoring can provide data are the following: (1) Is the patients' distal esophageal acid exposure in excess of that noted in normal individuals? (2) Are the symptoms reported by the patient during pH monitoring temporally associated with gastroesophageal reflux?
Quantifying Gastroesophageal Reflux
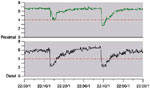
Normal esophageal pH is considered to be close to pH 7.0. The most accepted definition of gastroesophageal reflux during pH monitoring is a sudden decrease in intraesophageal pH to below 4.0, with the nadir pH being reached within 30 seconds from the beginning of the drop (Figure 3). Reasons for choosing this cutoff value include observations that pepsin, the main proteolytic enzyme of the gastric secretions, is inactive above this value,18 and because GERD patients are more likely to report heartburn at an intraesophageal pH below 4.0.19 Over the years, this cutoff value has been challenged by investigators arguing for pH threshold above or below 4. There are studies suggesting that a better discrimination between healthy volunteers and patients with reflux symptoms could be achieved at a pH threshold of 5.0,20 studies suggesting that the best discrimination between patients with reflux symptoms and healthy volunteers occurred within the full range between pH 3.0 and 6.0 rather than a single pH value,21 and studies proposing different pH threshold values for different positions based on pH distribution curves.22 Although these different thresholds are frequently reported in clinical trials, the original cutoff pH value of 4.0 to identify gastroesophageal reflux has prevailed for routine clinical testing.
Once establishing a specific cutoff value (i.e., pH 4.0) to identify gastroesophageal reflux episodes, several parameters can be defined to quantify the amount of reflux: number of episodes with a drop in pH below 4.0, number of episodes of certain duration (e.g., 5 minutes) of pH below 4.0, and duration of intraesophageal pH below 4.0.
The most frequently used parameter to quantify esophageal acid exposure is the percent of time that the pH is less than 4.0 (i.e., time during which esophageal pH is less than 4.0 divided by the total recording time expressed in percentage).
Changes in body position, activity, and state of consciousness (i.e., awake vs. asleep) influence intragastric pressure, LES resting pressure, bolus clearance, and salivary acid neutralization that lead to differences in the physiologic amount of gastroesophageal reflux in various body positions. Therefore, esophageal acid exposure is frequently reported separately for different body positions (upright vs. recumbent). A further argument to "normalize" esophageal acid exposure time by calculating the percent of time that pH is less than 4.0 are observations that individual subjects spent different amounts of time in the upright and recumbent position. A final detail in reporting acid exposure time (percent time pH less than 4.0) relates to excluding meal periods from the recording time. The reason for this correction is based on observations that some foods, especially drinks (carbonated beverages, wine, juices), have pH values below 4.0 and, if not excluded, will artifactually increase reflux episodes and esophageal acid exposure time. Excluding meal periods from analysis is preferred over limiting meals to the ingestion of only "neutral" foods, as the latter approach would contradict the instructions given to patients during pH monitoring to try to reproduce situations (including meals) that may generate symptoms.
Normal values for the percent of time the pH is less than 4.0 have been established for both catheter-based and wireless systems based on studies in healthy volunteers (Table 1). Separate values for each method are necessary as there is a difference in the location of the sensor used by each method, and studies by Weusten et al.23 have shown that intraesophageal acid exposure differs based on the level at which it is measured. Intraesophageal pH data from individual patients are compared against these values, and esophageal acid exposure times are reported as normal or abnormal (Figure 4).
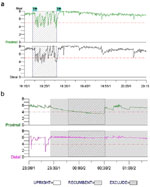
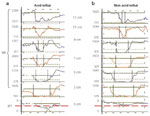
Figure 4: Ambulatory pH monitoring tracings.
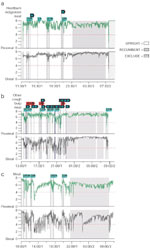
a: Normal proximal and distal esophageal acid exposure. b: Abnormal distal esophageal acid exposure during upright position. c: Abnormal distal esophageal acid exposure during upright and recumbent position.

Another method of presenting esophageal acid exposure data is a cumulative score originally established by Johnson and DeMeester (JD score).5 The JD score has been more recently replaced by the DeMeester score, which is widely used in the surgical literature and takes into account and weights six different parameters: (1) total percent time pH less than 4.0, (2) percent time pH less than 4.0 in the upright period, (3) percent time pH less than 4.0 in the recumbent period, (4) the total number of reflux episodes, (5) the total number of reflux episodes longer than 5 minutes, and (6) the duration of the longest reflux episode. The score is automatically calculated and reported by most commercially available pH software programs along with individual exposure times. Studies comparing the composite score against time pH less than 4.0 have indicated that the later discriminates at least as well as the score between healthy volunteers and GERD patients.24, 25 Regardless of whether one uses the composite score or individual acid exposure times, a detailed evaluations of the pH tracing is of pivotal importance to recognize and exclude artifacts (Figure 5). A further weakness of the score is that it does not include any information on symptom/reflux association.
Figure 5: Artifacts during pH monitoring.
a: Meal artifact. b: Pseudoreflux (slow drift in proximal pH channel only).
Evaluating the Relationship Between Symptoms and Acid Reflux
In our experience evaluating the relationship between symptoms and acid reflux is as important as quantifying esophageal acid exposure. There are different ways to assess the association between symptoms and reflux episodes.
The simplest way to evaluate this association is by reporting the symptom index. First described by Wiener et al.,26 the symptom index is the percentage of symptoms preceded by a drop in esophageal pH below 4.0 within a 5-minute time window divided by the total number of symptoms. The symptom index should be determined separately for different symptoms, and a positive symptom association is declared if the symptom index is greater than or equal to 50% (i.e., at least half of the reported symptoms are preceded within a 5-minute time window by an intraesophageal pH below 4.0). Over the years the definition and use of the symptom index have been challenged. Based on a sensitivity analysis in patients with chest pain, Lam et al.27 have proposed using a shorter, 2-minute time window after the onset of a reflux episode in which a symptom has to occur in order for it to be consider associated with reflux.
Recognizing that in patients with multiple reflux episodes and few symptoms the association may occur by chance, other authors have advocated using, in addition to the symptom index, a symptom sensitivity index. The symptom sensitivity index is defined as the percentage of reflux episodes associated with symptoms out of the total number of reflux episodes. A symptom sensitivity index greater than 10% would further strengthen the symptom association with reflux.
Using a complex probability approach, Weusten et al.28 have proposed the symptom association probability (SAP), arguing that this parameter overcomes some of the limitations of the symptom index and symptom sensitivity index. The SAP tries to evaluate if, from a statistical approach, the pattern of reflux and symptoms during the monitoring period may have occurred by chance, or if the association of symptoms and reflux episodes is not by chance. Commercially available software programs have the ability to report the SAP in percentage based on the original methodology described by Weusten et al. When interpreting the SAP, it is important to remember that this parameter indicates the statistical probability with which symptoms and reflux episodes are associated. Therefore, only a SAP greater than 95% (i.e., the probability of this association having occurred by chance is less than 5%) is considered positive.
Combined Multichannel Intraluminal Impedance and pH (MII-pH) Monitoring
Even though many clinicians and investigators consider esophageal pH monitoring (catheter-based or catheter-free) the "gold standard" for measuring gastroesophageal reflux, this method has some inherent limitations. The methods of detecting gastroesophageal reflux limit esophageal pH monitoring to identifying only reflux episodes during which the pH drops below 4.0, therefore providing limited information on reflux episodes during which the pH doesn't drop below 4.0 (i.e., nonacid reflux). This limitation has become even more important as primary care providers routinely employ proton pump inhibitor (PPI) trials in clinical practice, leading to a change in pattern of GERD patients referred for consultation. Gastroenterologists and gastrointestinal surgeons more often receive consultations to evaluate patients with persistent GERD symptoms on acid-suppressive therapy. Recent reports emphasize the limitation of conventional esophageal pH monitoring in detecting reflux episodes in patients taking acid-suppressive therapy.29 This is most likely the result of the limitation of conventional pH monitoring to separate patients in whom persistent symptoms are associated with reflux episodes with a pH above 4.0 (i.e., nonacid reflux) from those patients in whom symptoms are not associated with any type of reflux.
Principles of MII-pH Testing
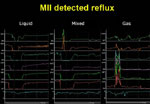
In 1991 Silny30 was the first to describe multichannel intraluminal impedance (MII), a novel method of detecting intraesophageal bolus movement. This method is based on measuring the resistance to alternating current (i.e., impedance) of the content of the esophageal lumen. When a pair of electrodes, separated by an isolator (i.e., catheter), is placed inside the esophagus, the electrical circuit is closed by electrical charges (i.e., ions) present in the esophageal mucosa that surround the catheter. The conductivity of the empty esophageal lumen is relatively stable, with the electrical circuit registering values around 2000 to 4000 ohm. The appearance of a liquid bolus in the impedance-measuring segment is recognized as a rapid drop in impedance as the increased ionic content of the bolus improves the electrical conductivity between the two electrodes. The impedance will remain low as long as the bolus is present between the two electrodes and will start rising once the bolus is cleared from the segment by a contraction. The presence of gas in the impedance-measuring segment is recognized by a rise in impedance typically above 5000 ohm, as there are no electrical charges to close the circuit when the two electrodes are suspended in air. Impedance will return to the baseline values once the air bolus has passed and the electrodes are back in contact with the esophageal mucosa. The presence of a mixed (i.e., gas–liquid, liquid–gas) bolus is recognized by impedance changes indicating air and liquid presence (Figure 6).
Mounting a series of impedance-measuring segments on a catheter (i.e., multichannel impedance) allows not only detecting the bolus presence at various levels but also determining the direction of bolus movement. Swallows are detected as impedance changes, progressing proximally to distally indicating an aboral bolus movement. Reflux episodes are detected as impedance changes progressing distally to proximally indicating an oral bolus movement (Figure 7). These changes in impedance are very sensitive as studies by Srinivasan et al.31 in normal volunteers showed the ability of impedance to detect swallows as small as 1 mL. This high sensitivity has drawbacks because impedance changes do not accurately determine the volume of swallows or refluxate.
Figure 7: Direction of intraluminal bolus movement as detected by multichannel intraluminal impedance.
a: Drops in impedance starting proximally and moving distally are indicative of antegrade bolus movement as seen during swallowing. b: Drops n impedance starting distally and moving proximally are indicative of retrograde bolus movement as seen during reflux.
Multichannel intraluminal impedance can be added to conventional pH catheters (combined MII-pH), allowing a more comprehensive characterization of reflux episodes, including physical properties (i.e., liquid, gas, mixed), chemical properties (i.e., acid or nonacid), height of the refluxate, bolus presence, and clearance and acid presence and clearance.
Gastroesophageal Reflux Monitoring Using Combined MII-pH
From a patient perspective combined MII-pH monitoring is no different than catheter-based pH monitoring. The 2.1-mm diameter combined MII-pH catheter (Figure 8) is passed transnasally into the esophagus and stomach and then positioned so that the esophageal pH electrode is located 5 cm above the proximal border of the LES. The most frequently used catheter design in adults (6MII-2pH with gastric sensor) collects pH data from 5 cm above the LES, gastric pH data from 10 cm below the LES, and impedance data from 3, 5, 7, 9, 15, and 17 cm above the LES. Although this catheter is currently the most frequently used to monitor patients on acid-suppressive therapy, other designs are available and have been used in studies monitoring proximal and hypopharyngeal reflux.32 Data are recorded with a sample frequency of 50 Hz and stored on the flash card of a data logger (Sleuth System, Sandhill Scientific Inc., Highland Ranch, CO). During the monitoring period patients are instructed to reproduce as much as possible the daily scenarios during which they experience symptoms. Patients are provided with diaries and asked to record the timing and consistency of ingested meals, timing of the intake of acid-suppressive medication, periods of upright and recumbent position, and the time of symptoms. Upon completion of the study, the catheter is removed, and the data are downloaded and analyzed using dedicated software (Bioview Analysis, Sandhill Scientific Inc.).
Figure 8: Combined multichannel intraluminal impedance and pH catheter.
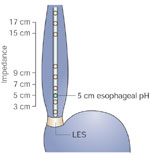
LES, lower esophageal sphincter.
Analyzing Combined MII-pH Data
Combined MII-pH represents a shift in the GERD testing paradigm. Gastroesophageal reflux episodes are detected by the characteristic impedance changes (i.e., distal to proximal progressing drops in intraluminal impedance), and data from the esophageal pH sensor are simply used to categorize the gastroesophageal reflux into acid or nonacid. Traditionally, a MII-detected gastroesophageal reflux episode with a concomitant drop in pH below 4.0 has been classified as acid and a MII-detected reflux episode where the pH remains above 4.0 has been classified as nonacid (Figure 9).33 Critics have argued that, in compliance with the chemical definition of acid and nonacid based on the dissolution equation of water, any solution with pH below 7.0 should be considered acid. In a recent consensus statement a group of leading esophageal experts have proposed a new classification of GER episodes.34 A new (Porto) classification separates gastroesophageal reflux detected by MII into acid, if the pH drops from above to below 4.0, weakly acidic if the pH is between 4.0 and 7.0, and weakly alkaline if the intraesophageal pH during an MII-detected reflux episode remains above 7.0. Although this new classification offers a better compromise for the chemical and classic gastrointestinal physiology definition of acid and nonacid, the traditional classification using the pH 4.0 cutoff underscores better the concept that for the detection of reflux episodes with a pH above 4.0 a method other than conventional pH monitoring is required.
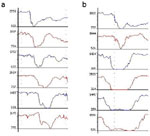
Figure 9: Gastroesophageal reflux detected by combined multichannel intraluminal impedance and pH (MII-pH) monitoring.
Impedance-detected reflux episodes during which the intraesophageal pH drops from above to below 4.0 are considered acid (a), whereas impedance-detected reflux episodes during which the intraesophageal pH remains above 4.0 are considered nonacid (b).
In addition to the pH information, combined MII-pH allows reflux episodes to be classified into liquid only, if only drops in impedance are noticed in all channels; gas only, if only rises in impedance are noticed in all channels; or mixed (liquid–gas, gas–liquid) if a combination of the two patterns are noted.
Furthermore, measuring impedance at multiple levels in the esophagus allows determining the height of the reflux, and GER episodes are considered to extend into the proximal esophagus if impedance changes indicative of liquid presence are identified at 15 cm above the LES.
The impedance data quantifies the number of gastroesophageal reflux episodes, bolus presence time at various levels in the esophagus, and esophageal acid exposure time (i.e., time pH less than 4.0).
Interpreting Combined MII-pH Data
Although combined MII-pH monitoring represents a shift in the reflux-testing paradigm it is important to recognize that the traditional pH information is still present. Data from the pH sensor allows reporting esophageal acid exposure time (i.e., percent time pH less than 4.0). The impedance data simply expand the acquired information.
Similar to the interpretation of conventional pH monitoring data, combined MII-pH data can be used to quantify the amount of reflux and evaluate the relationship between symptoms and reflux episodes. The main advantage of combined MII-pH over conventional pH monitoring is that it facilitates analysis of the relationship between symptoms and all types of reflux events, both acid and nonacid. A negative combined MII-pH study is therefore more powerful in excluding reflux compared to regular pH monitoring.
A multicenter study in 60 healthy volunteers off acid-suppressive therapy quantified several impedance and pH parameters and established normal values for this technique.35 Studies in healthy volunteers on acid-suppressive therapy are currently being conducted in order to establish normal values for impedance and pH parameters that can be used to evaluate more accurately the amount of reflux in symptomatic patients on acid-suppressive therapy. Until these results are available, we recommend using the total (acid and nonacid) parameters established in healthy volunteers off therapy to interpret the amount of reflux on therapy. The rationale of this approach is based on previous observations that acid-suppressive therapy primarily changes the composition of the gastroesophageal reflux and to a lesser extent the number of reflux episodes.36 In our opinion, the more important parameter in interpreting the results of MII-pH monitoring on acid suppression is evaluating the relationship between symptoms and acid and nonacid reflux. Although acid-suppressive therapy is highly successful in healing esophageal lesions, daily PPI therapy controls reflux symptoms in only 60% to 65% of patients.37 Using the symptom index based on a 5-minute time window, we recently found that approximately half of the patients on twice-daily PPI therapy referred to a tertiary center have a positive association between symptoms and persistent reflux.38 The majority of patients with a positive symptom index have their symptoms temporally associated with nonacid reflux. Preliminary outcome data suggest that this association is clinically meaningful, as patients who underwent laparoscopic Nissen fundoplication for persistent symptoms on acid-suppressive therapy associated with ongoing reflux appear to benefit from the surgical intervention.39
Conclusion
Gastroesophageal reflux disease is a common condition encountered in clinical practice. Gastroesophageal reflux monitoring using pH electrodes is an important tool in evaluating patients with GERD symptoms not taking acid-suppressive therapy, and the wireless pH capsule improves patient and physician acceptance of this test.
On the other hand, current clinical practice guidelines favor empiric trials of PPI over pH testing to diagnose GERD. Esophageal pH testing is then recommended primarily in patients with persistent symptoms despite acid-suppressive therapy. In these circumstances the decision to test the patient on or off therapy becomes difficult because, on the one hand, esophageal pH testing is more accurate when performed off therapy, but, on the other hand, esophageal pH testing cannot exclude nonacid reflux in patients. In our opinion combined MII-pH will overcome this impasse using the algorithm depicted in Figure 10 in evaluating patients with GERD symptoms.

