
Figures, tables and video
From the following article
Anatomy and development and physiology of the larynx
Clarence T. Sasaki
GI Motility online (2006)
doi:10.1038/gimo7

Figure 1
Structure and function of the larynx viewed phylogenetically (according to Negus)
Full size figure and legend (49K)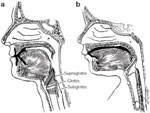


Figure 4
Frontal section through the human larynx demonstrating the valvular structure of the false and true cords.
Full size figure and legend (108K)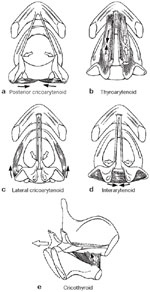
Figure 5
Laryngoscopic view of the intrinsic muscles responsible for activating vocal cord position.
Full size figure and legend (100K)

Figure 7
Stimulation of right internal branch of superior laryngeal nerve.
Full size figure and legend (45K)
Figure 8
Intrathoracic pressure is plotted with respect to time (t) in the spontaneously breathing animal.
Full size figure and legend (37K)
Figure 9
Threshold of the adductor reflex is plotted with respect to respiratory phase.
Full size figure and legend (41K)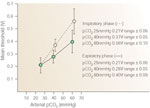
Figure 10
Threshold of the adductor reflex is plotted with respect to arterial pCO2.
Full size figure and legend (43K)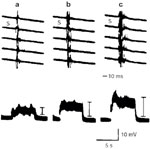
Figure 11
The increasing pattern of adductor responses (upper) and integrated responses (lower) by 8-Hz stimulation of the superior laryngeal nerve (SLN) (0.6 V, 0.1 msec) under conditions of (a) pCO2 60 mmHg; (b) pCO2 40 mmHg; and (c) pCO2 25 mmHg.
Full size figure and legend (34K)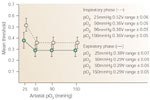
Figure 12
Threshold of the adductor reflex is plotted with respect to arterial pO2.
Full size figure and legend (46K)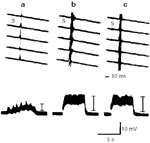
Figure 13
The pattern of adductor responses (upper) and integrated responses (lower) by 8-Hz stimulation of SLN (0.6 V, 0.1 msec) under conditions of (a) pO2 25 mmHg; (b) pO2 100 mmHg; and (c) pO2 150 mmHg.
Full size figure and legend (34K)
Figure 14
Threshold of the adductor reflex is plotted with respect to intrathoracic pressure.
Full size figure and legend (28K)
Figure 15
Influence of body temperature on threshold and latency in (a) 3-week-old puppies; (b) 6-week-old puppies; (c) 12-week-old puppies; (d) adult dogs.
Full size figure and legend (48K)
Figure 16
Influence of body temperature on threshold in four age groups.
Full size figure and legend (37K)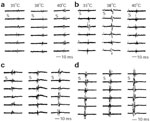
Figure 17
Evoked adductor responses elicited by single-shock stimulation of SLN in (a) 3-week-old puppies; (b) 6-week-old puppies; (c) 12-week-old puppies; (d) adult dogs. S, stimulus artifact.
Full size figure and legend (65K)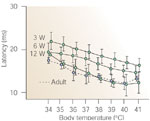
Figure 18
Influence of body temperature on latency in four age groups.
Full size figure and legend (31K)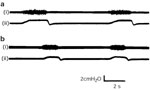
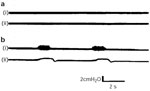

Figure 21
Cricothyroid EMG (upper tracing) and phrenic EMG (lower tracing).
Full size figure and legend (37K)
Figure 22
Glottic alteration produced by cricothyroid (CT) and posterior cricoarytenoid action (PCA) alone and in combination.
Full size figure and legend (18K)
Figure 23
Cricothyroid response to mechanical ventilation at rates of (a) 20 per minute, (b) 30 per minute, (c) 40 per minute.
Full size figure and legend (35K)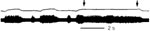
Figure 24
Duration of positive pressure stimulation determines duration of cricothyroid-evoked activity.
Full size figure and legend (13K)
Figure 25
a: Vagotomy produces spontaneous inspiratory hyperactivity of cricothyroid motoneurons.
Full size figure and legend (23K)
Figure 26
The threshold of cricothyroid elicitation in response to rate of tracheal pressure change measures 30 cmH2O/sec in normocapnia.
Full size figure and legend (23K)
Figure 27
Thyroarytenoid action potentials elicited by single-shock stimuli applied to the ipsilateral superior laryngeal nerve.
Full size figure and legend (25K)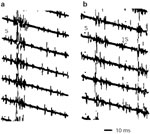
Figure 28
Thyroarytenoid action potentials elicited by repetitive stimulation of ipsilateral superior laryngeal nerve in control dogs.
Full size figure and legend (50K)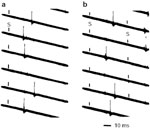
Figure 29
Thyroarytenoid action potentials elicited by superior laryngeal stimulation in tracheostomized dogs.
Full size figure and legend (34K)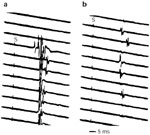
Figure 30
Thyroarytenoid action potentials produced by 16-Hz superior laryngeal stimulation in chronically tracheostomized dogs.
Full size figure and legend (44K)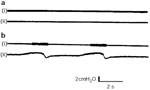
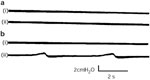

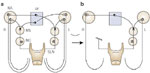
Figure 34
Organizational model of the glottic closure reflex pathway demonstrating the effect of a unilateral SLN section.
Full size figure and legend (27K)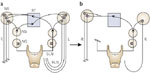
Figure 35
Organizational model demonstrating the effect of converting a unilateral recurrent laryngeal nerve (RLN) section (a) to a combined unilateral RLN-superior laryngeal nerve (SLN) section (b) when motor neurons involved ipsilaterally are exceeded by those contralaterally.
Full size figure and legend (28K)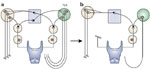
Figure 36
Organizational model demonstrating the effect of converting a unilateral RLN section (a) to a combined unilateral RLN-SLN section (b) when motor neurons involved ipsilaterally are exceeded by those contralaterally.
Full size figure and legend (45K)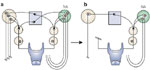
Figure 37
Organizational model demonstrating the effect of converting a unilateral RLN section (a) to a combined unilateral RLN-SLN section (b) when motor neurons involved ipsilaterally outnumber those contralaterally.
Full size figure and legend (46K)
Table 3
Efficiency and latency of responses to stimulation of branches of the superior laryngeal nerves
Full size table and legendTable 4
Effect of core temperature and age on threshold of the adductor reflex in beagles*
Full size table and legendTable 5
Effect of core temperature and age on latency of the adductor reflex in beagles*
Full size table and legendTable 6
Effect of section of different laryngeal nerves on glottic closure force in man (glottic closing force in mmHg)
Full size table and legendTable 7
Percent reduction in glottic closing force by section of different laryngeal nerves*
Full size table and legend