
Figures, tables and video
From the following article
Physiology of esophageal motility
Hiroshi Mashimo and Raj K. Goyal
GI Motility online (2006)
doi:10.1038/gimo3
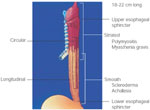
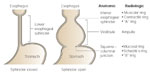
Figure 2
Anatomic radiographic landmarks of the lower esophageal sphincter (LES).
Full size figure and legend (41K)
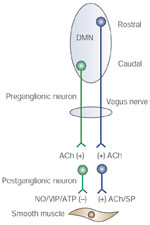
Figure 5
Parallel inhibitory and excitatory innervation of the esophageal smooth muscle.
Full size figure and legend (17K)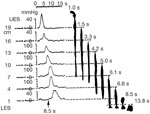
Figure 6
Simultaneous manometry and fluoroscopy of barium swallow in a normal subject.
Full size figure and legend (43K)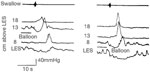
Figure 7
Demonstration of deglutitive inhibition in human esophagus.
Full size figure and legend (26K)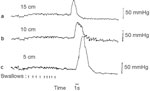
Figure 8
Diagramatic representation of manometric tracing demonstrating deglutitive inhibition.
Full size figure and legend (24K)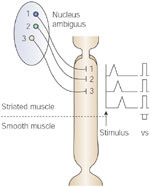
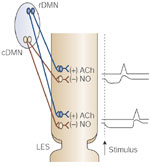
Figure 10
Central control of peristalsis in the smooth muscle portion of the esophagus.
Full size figure and legend (32K)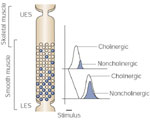
Figure 11
Gradient of cholinergic excitatory and noncholinergic inhibitory nerves in the smooth muscle portion of the esophagus.
Full size figure and legend (33K)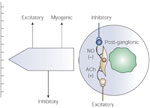
Figure 12
Three mechanisms involved in the regulation of basal LES tone.
Full size figure and legend (30K)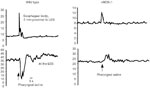
Figure 13
Lower esophageal sphincter (LES) relaxation is lost in neuronal nitric oxide synthase (nNOS)-deficient mice.
Full size figure and legend (32K)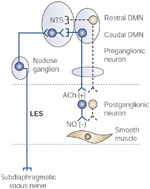
Figure 14
Neural circuit for transient lower esophageal sphincter relaxation (TLESR) elicited by stimulation of subdiaphragmatic vagal afferents.
Full size figure and legend (20K)