
Abstract
The aggregation of the intrinsically disordered protein alpha-synuclein (αS) into amyloid fibrils is thought to play a central role in the pathology of Parkinson’s disease. Using a combination of techniques (AFM, UV-CD, XRD, and amide-I 1D- and 2D-IR spectroscopy) we show that the structure of αS fibrils varies as a function of ionic strength: fibrils aggregated in low ionic-strength buffers ([NaCl] ≤ 25 mM) have a significantly different structure than fibrils grown in higher ionic-strength buffers. The observations for fibrils aggregated in low-salt buffers are consistent with an extended conformation of αS molecules, forming hydrogen-bonded intermolecular β-sheets that are loosely packed in a parallel fashion. For fibrils aggregated in high-salt buffers (including those prepared in buffers with a physiological salt concentration) the measurements are consistent with αS molecules in a more tightly-packed, antiparallel intramolecular conformation, and suggest a structure characterized by two twisting stacks of approximately five hydrogen-bonded intermolecular β-sheets each. We find evidence that the high-frequency peak in the amide-I spectrum of αS fibrils involves a normal mode that differs fundamentally from the canonical high-frequency antiparallel β-sheet mode. The high sensitivity of the fibril structure to the ionic strength might form the basis of differences in αS-related pathologies.
Introduction
The formation of amyloid fibrils (characterized by a so-called cross-β structure1,2 that is stabilized by an intra- and intermolecular hydrogen-bonding network) is currently known to be related to approximately fifty disorders, including Alzheimer’s and Parkinson’s disease, and type-II diabetes3. In the case of Parkinson’s disease, amyloid aggregates of alpha-synuclein (αS) are found in the Lewy bodies, that are an import hallmark for the disease4,5. Although physiochemical conditions that influence the conversion of monomeric αS to amyloid fibrils have been investigated before6,7,8,9,10,11,12, the structural characterization of αS amyloid fibrils is yet incomplete. Elucidation of the molecular details of the αS fibril structure is essential to understanding the mechanism of self-assembly of αS into fibrils, which is thought to play a role in the pathogenesis of PD. It is known that both the conformation of monomeric αS6 and the structure of its amyloids12 depend strongly on the ionic strength of the buffer solution. This is probably related to the long-range interactions within the protein13,14,15,16,17 that are a result of the charges present in αS: at neutral pH the C-terminus (residues 100–140) is highly negatively charged (−13), whereas the rest of the protein has a net charge of +4. To investigate how ionic strength influences αS-fibril structure and the conformation of the monomeric subunits within the fibrils, we have studied the aggregation of the full-length αS protein at different salt concentrations using a combination of atomic force microscopy (AFM), circular dichroism (UV-CD), X-ray diffraction (XRD) and 1D- and 2D-infrared spectroscopy (1D-IR and 2D-IR).
Previous ss-NMR studies: αS fibrils are “in-register”
There is considerable evidence from solid-state NMR7,10,18,19,20,21,22,23 and EPR24,25 suggesting that αS fibrils independent of the ionic strength of the buffer solution in which they are aggregated, have in-register monomers along the fibril axis (i.e. the residues of one monomer are next to the same residues in the neighboring monomers in the hydrogen-bonded fibrillar intermolecular β-sheet; see Methods section for a detailed description of the nomenclature used to describe the fibril morphology). Although fibrils aggregated in high- and low-salt buffer solutions both are in-register, the structure of the fibrils does change dramatically if the protein is aggregated in a low-ionic strength buffer solution (5 mM Tris-HCl), compared to aggregation in a high-ionic strength buffer solution (50 mM Tris-HCl and 150 mM KCl)7,10.
Previous FTIR studies on the structure of αS fibrils
Vibrational spectroscopy in the amide-I region (1600–1700 cm−1) can be used to gain more insight into the conformation of αS molecules within the fibril. Due to the strong vibrational coupling between the amide groups in backbones of proteins, amide-I IR spectra exhibit distinct features for different secondary and quaternary structures26,27,28,29,30,31,32. Many groups have used conventional IR techniques (the KBr pellet method, solution FTIR or ATR-FTIR) to investigate the structure of αS fibrils aggregated under different conditions. The β-sheet structure in fibrils prepared in 10 mM HEPES without any additional salt was reported to be fully parallel33, but it is still unclear which type of β-sheet structure occurs in fibrils prepared at higher salt concentration: many reports assign their IR spectra of high-salt fibrils (aggregated with 137–200 mM NaCl present in the buffer) to an antiparallel β-sheet structure34,35,36,37,38,39, but other studies7,40 report spectral assignments to fully parallel β-sheets for αS fibrils aggregated in 50 mM Tris-HCl and 150 mM KCl-, and in PBS-buffer, respectively.
2D-IR on amyloid fibrils
2D-IR spectra are less ambiguous in the assignment of secondary structure than 1D-IR spectra, as they contain a secondary-structure dependent cross peak pattern, and because highly ordered secondary-structure elements give stronger signals than less-ordered structures32. The comparison of the 1D-IR spectrum (in which the total oscillator strength is to a good approximation conserved) and the 2D-IR spectrum (in which the signal is nonlinearly dependent on the transition dipole of the IR modes41,42) provides a measure of the excitonic delocalization of each structural component, making a combination of the techniques exceptionally useful to study amyloid systems, as has been shown by the work of the Zanni group43,44,45,46.
Results
Comparison with other studies using conventional techniques
To investigate the effect of ionic strength on the amyloid formation, we aggregate monomeric αS in 10 mM Tris buffer (pD = 7.4) with increasing concentrations of NaCl (0–300 mM). AFM images show that αS fibrils prepared in up to 25 mM NaCl (henceforth ‘low-salt aggregation conditions’) have a ribbon-like morphology, while those prepared in more than 25 mM NaCl (henceforth ‘high-salt aggregation conditions’) are twisted and rod-like (Fig. 1A,B), similar to those observed recently in ref. 7 (see Fig. S1 for AFM images at all investigated salt concentrations). The UV-CD spectra (Fig. 1C) show a typical negative peak at ~218 nm irrespective of the ionic strength, and a positive peak that is blue-shifted from ~200 to ~195 nm for high-salt as compared to low-salt fibrils, in line with previously published UV-CD spectra of αS fibrils prepared in various salt concentrations47,48,49. Our XRD results (Fig. 1D) also indicate that we have fibrils similar to those studied in refs 7 and 50. To investigate the changes in molecular structure caused by differences in the ionic strength we employ 1D- and 2D-IR spectroscopy.

(A,B) AFM images (scale bar = 10 μm in main image and 100 nm in the inset), (C) UV-CD spectra, and (D) XRD spectra of αS fibrils aggregated in the presence of varying concentrations of NaCl.
1D- and 2D-IR spectra of αS fibrils as a function of ionic strength: significant changes around [NaCl] = 25 mM
For all investigated fibrils, the IR spectra are dominated by a fibrillar β-sheet peak around 1620 cm−131,51,52, and a peak at ~1657 cm−1, which is generally assigned to turns51,53 (see Fig. 2). However, the spectra of fibrils formed with [NaCl] > 25 mM are significantly different from those formed in [NaCl] < 25 mM, mainly by the appearance of a small peak at ~1685 cm−1 (see arrow in Fig. 2A, and the corresponding 2D-IR peak at (νprobe, νpump) = (1685,1685) cm−1 peak in Fig. 2D), and by the disappearance of the ~1617 cm−1 shoulder superimposed on the broad 1623 cm−1 peak observed for low-salt fibrils. For high-salt fibrils this broad peak changes into two sharper peaks at ~1620 and ~1632 cm−1 (see also Fig. 2E). The spectral change is not gradual but discrete (as can be seen in Fig. 2B where the ratio between the absorption at 1685 and 1620 cm−1 is plotted), occurring at an onset NaCl concentration between 25 and 50 mM.

(A) 1D-IR (FTIR) spectra, (B) the 1685 cm−1 to 1620 cm−1 absorbance peak ratio, (C,D) 2D-IR spectra, (E) diagonal slices (along the yellow lines in (C) and (D)), and (F) slices at νpump = 1620 cm−1 (along the blue lines in (C) and (D)) for αS fibrils aggregated with different concentrations of NaCl. Lines through the points in (E,F) are Catmull-Rom splines.
Assignment of the IR spectra: evidence for a novel β-sheet normal mode
The 1685 cm−1 peak is fundamentally different from the commonly observed54,55 high-frequency mode of antiparallel β-sheets. This becomes clear from the polarization dependence of the cross peak between the low- and high-frequency peak in the 2D-IR spectrum. The polarization dependence can be described by the anisotropy 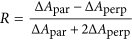 , with ΔApar,perp the cross-peak intensity for parallel and perpendicular pump versus probe polarization, respectively. In a canonical antiparallel β-sheet the transition dipole moment (TDM) of the high-frequency mode is perpendicular to the TDM of the low-frequency (<1640 cm−1) β-sheet mode, which corresponds to
  ,32 which we also measure for the hexapeptide VEALYL (R = −0.21 ± 0.03) that forms fibrils composed of antiparallel intermolecular β-sheets (Fig. 3), similar to what previous studies56,57,58 found for antiparallel β-sheets. Surprisingly, for high-salt αS fibrils we find R = −0.06 ± 0.09, indicating that the conventional antiparallel β-sheet assignment does not apply for αS, in line with the ss-NMR findings7,10,18,19,20,21,22,23 that αS are in-register (i.e. not composed of antiparallel intermolecular β-sheets).

(A) 2D-IR spectrum, with (on top) the 1D-IR spectrum and (on the right side) the diagonal slice of the fibril formed by the hexapeptide VEALYL, that has an antiparallel orientation of β-strand monomers along the fibril axis, showing a canonical antiparallel β-sheet peak pattern with a perpendicular orientation of the low- with respect to the high-frequency modes, and (B) the slice at νpump = 1620 cm−1. The cross peak at (νprobe, νpump) = (1680, 1620) cm−1 with an anisotropy R = −0.21 ± 0.03 reveals that there is a 90 ± 11° angle between the modes that the low- and the high-frequency peaks are composed of.
The high-frequency mode of high-salt αS fibrils can neither be assigned to in-register turns nor to loop regions, as was the case for the ~1685 cm−1 peak observed for amyloid fibrils formed by hIAPP43. αS Fibrils have a similar number of residues in turns for low- and high-salt fibrils, according to the UV-CD spectra59 (Fig. 1C) and the NMR spectra measured on similar fibrils7,10, so it is unlikely that the appearance of the extra peak is due to a change in the amount of residues in loop regions. Also, proton-assisted insensitive nuclei (PAIN) cross-polarization spectra of αS fibrils show that the loop regions have few contacts with the loops in neighboring αS molecules10, so it is also unlikely that high-salt αS fibrils would contain the highly-ordered loop regions that are required to absorb at such high frequencies: if only because the PAIN spectra show that they are definitely not more ordered than the loop region in low-salt fibrils.
Structural interpretation of the change in the IR spectra with the novel assignment of the high-frequency mode from spectral calculations: αS forms parallel, extended fibrils in low-salt buffers, and antiparallel, tightly packed fibrils in high-salt buffers
More probably, the spectral differences for varying salt concentrations reflect a difference in the intramolecular structure of α-synuclein within the fibril, from a more extended form for low-salt fibrils, to a more tightly-packed, probably antiparallel intramolecular conformation for the high-salt fibrils (see Fig. 4).

By adding ions to the solution of αS monomers the conformational equilibrium is changed from a situation where most αS molecules are in a conformation in which the oppositely charged C- and N-terminus shield the hydrophobic NAC region, to a situation in which the charge interaction is screened due to the ions6,13,14,16,17. This leads to a more exposed NAC region, in which αS can transiently adopt intramolecular β-sheet structure15, with a potential high fibrillization propensity after a 90° rotation of the hydrogen bonds that has been observed before in aggregating proteins69. The width of the low-salt fibrils, as observed with AFM, is similar to the length of an extended αS monomer, and the low-frequency shoulder (~1617 cm−1) in the IR spectra is only observed for a parallel orientation of hydrogen-bonded β-sheets. We therefore hypothesize that in a low-salt buffer the C- and N-terminus shielded monomer conformation is in equilibrium with an extended conformation that has a stronger fibrillization propensity than the shielded conformation (albeit much less strong as compared to the intramolecular β-sheet conformation that is populated in a high-salt buffer, as judged from the much slower aggregation rate of low-salt fibrils). The extended monomer conformation leads to an extended and parallel fibril structure. This hypothesis also explains the fact that the low-salt fibrils exhibit no twist, whilst the high-salt fibrils are composed of two entwined twisting protofibrils (as also observed with cryo-electron microscopy83), as both charge84 and size85 are known to influence the twisting properties of protofibrils.
Spectral calculations show that a new high-frequency normal mode appears when hydrogen-bonded fibrillar intermolecular β-sheets are stacked in the direction perpendicular to the fibril axis. In the case of a single parallel sheet (see Fig. S2A for the structure, Fig. S3A for the calculated spectrum and Fig. S4A for the normal mode analysis), almost all intensity goes into low-frequency modes that have TDMs parallel to the hydrogen bonds between the backbone amide groups54; in the case of a single antiparallel sheet (see Figs S2B, S3A and S4B,C) almost all intensity goes into one low-frequency mode with a TDM in the direction of the backbone hydrogen-bonds, and into a high-frequency mode with a TDM that is perpendicular to this mode, in the direction of the β-strands54,55. However, when the in-register intermolecular β-sheets are stacked closely enough, a different high-frequency mode appears, that absorbs at approximately the same frequency as the high-frequency mode of β-sheets composed of β-strands that are oriented in an antiparallel fashion. This high-frequency mode is of a fundamentally different nature than the canonical high-frequency mode of an antiparallel β-sheet: the TDM of the high-frequency mode of stacked β-sheets is parallel to the fibril axis (rather than perpendicular to the fibril axis; see Figs S3B and S4D). In addition, besides this mode and the canonical low-frequency parallel β-sheet mode (Fig. S4E), new intense low-frequency modes appear with TDMs either parallel to the β-strands (Fig. S4F), or in the direction in which the intermolecular β-sheets are stacked (Fig. S4G).
The above-mentioned cross-peak anisotropy of −0.06 ± 0.09 in the spectrum of high-salt αS fibrils can be well explained by the presence of multiple orthogonal modes contributing to the low-frequency peak. If each of the two diagonal peaks giving rise to the cross peaks were due to a single normal mode, the cross-peak anisotropy would be −0.2 or 0.4 for perpendicular and parallel TDMs, respectively, while modes at intermediate TDM angles would give rise to intermediate R values. Because it is unlikely that modes at intermediate angles are present in the highly symmetric fibril structure (which we also see in the spectral calculations), we think that the observed cross-peak anisotropy reflects the fact that the contributing absorption peaks are composed of multiple modes with orthogonal TDMs as this also results in an intermediate R value.
Spectral calculations on in silico constructed αS-like fibrils reproduce the experimentally observed normal modes
Such a low-frequency peak composed of modes with multiple orthogonal TDMs is observed in spectral calculations on an in silico constructed αS-like fibril based on the unit cell of the fibril formed by the 69–77 segment of wild-type αS that contains intermolecular β-sheets that have an antiparallel orientation with respect to each other22 (see Fig. S2C,D). Assuming such a structure, the high-frequency mode visible in the spectra of high-salt fibrils can be well reproduced (see Fig. 5). In this calculation, the unit cell of the 69–77 segment fibril (PDB ID: 4RIK) has been extended into 10 stacked intermolecular β-sheets60, and 15 peptides long in the fibril direction (for more than ~15 peptides in this direction, the spectra converge, see Fig. S5). The main distances found in the XRD-spectra are present in the structure thus obtained (see Fig. S2E,F). The underestimation of the calculated frequency splitting with respect to the experimentally observed splitting has been noted before for the transition dipole coupling (TDC) approximation we employ here61,62,63, but for a qualitative understanding of IR spectra this poses no problems51,54,64,65,66.

Calculated IR spectra for two in silico constructed αS-like fibril structures: (red) a fibril composed of 10 intermolecular β-sheets laterally stacked in an antiparallel fashion with an inter-sheet distance of 7.4 and 9.0 Å, and (black) a fibril composed of 10 intermolecular β-sheets laterally stacked in a parallel fashion with an inter-sheet distance of 8.3 and 10.5 Å.
If we slightly expand the structure in order to match the distances in the low-salt XRD spectrum (inter-sheet distances of 8.3 and 10.5 Å) and stack the hydrogen-bonded sheets in a parallel fashion, we obtain a calculated IR spectrum that, like the experimental low-salt IR spectrum, does not show the ~1685 cm−1 peak (see Fig. 5). The low-frequency region of the experimental low-salt fibril spectra (most clearly visible in the diagonal slices of the 2D-IR spectra in Fig. 2E) is best also reproduced for a parallel orientation of the intermolecular β-sheets: for such structures a weak low-frequency shoulder appears in the calculations, at ~5 cm−1 below the main fibrillar peak. If such parallel intermolecular β-sheets align as depicted in Fig. 4, the width of the fibril is close to that observed with AFM (see Fig. S1). We therefore hypothesize that the low-salt fibrils are composed of intermolecular β-sheets with a parallel orientation.
An investigation of the influence of the orientation, distance and number of laterally stacked intermolecular β-sheets on the calculated spectra of fibrils formed by three model hexapeptides (GGVVIA, NNQQNY and SNQNNF, see Supporting Information) shows that these effects are not unique for the in silico constructed αS-like fibrils, but that generally for in-register amyloid fibrils (I) a high-frequency peak appears when they are composed of hydrogen-bonded β-sheets that are closely packed, and (II) a low-frequency shoulder appears when they are composed of hydrogen-bonded β-sheets stacked in a parallel fashion (in the direction perpendicular to the fibril axis).
Interestingly, for fibrils composed of laterally stacked antiparallel intermolecular β-sheets (i.e. not in-register sheets) all the low-frequency modes remain parallel to the fibril axis, while the high-frequency mode remains in the direction of the β-strands; normal-mode orientations similar as for isolated antiparallel (intermolecular) β-sheets (Fig. S8). This explains why the fibril formed by VEALYL (composed of such laterally stacked antiparallel intermolecular β-sheets) has a similar 2D-IR spectrum and cross peak anisotropy (Fig. 3) as an isolated antiparallel β-sheet56,57,58 (Figs S2B, S3A and S4B,C).
Because we observed a strong spectral influence of the number of stacked intermolecular β-sheets in the spectral calculations of the in-register fibrils (in line with previous studies51), we varied this parameter for the αS-like constructs described before, and found that the 4 peaks observed in the experimental high-salt fibrils could be best reproduced by stacking only 5 intermolecular β-sheets instead of 10 (see Fig. S8), suggesting that the most-pronounced peaks in the IR spectrum of fibrils may all originate from the β-sheets present in the αS fibrils (random-coil and turn peaks being too broad to observe), and that the two protofibrils that twist around each other (each composed of 5 intermolecular β-sheets) to form the 7 nm-thick fibril (Fig. 1) are vibrationally uncoupled, either because of the comparatively large distance separating them, or because they twist around each other without a well-defined phase relation.
Discussion
From IR measurements (see Fig. S9) we find that the fibril structure does not change if we exchange the buffers of the fibrils with a different salt concentration after the fibrillization process is finished, in agreement with previous studies7. This implies that the effect of salt on the fibril structure must involve an influence on the monomeric (or oligomeric) conformational distribution during the nucleation and/or growth phase. The fact that we find evidence for more tightly packed intramolecular antiparallel β-sheet regions in fibrils grown under high-salt conditions may be related to the influence of charge on the conformation of αS monomers. In a low ionic strength solution αS is mainly in a conformation in which the hydrophobic non-Aβ component (NAC) region is shielded by the negatively charged C-terminus region that folds onto positively charged parts of the protein16,17. This presumably counteracts spontaneous aggregation67. Upon the addition of polycations αS unfolds and the NAC region is exposed16,68 (see Fig. 4). An increased exposure of the NAC region due to changes in pH 14,17, addition of polycations14,16, or changes in ionic strength (see Fig. 4) can increase the aggregation propensity of αS. The fact that the NAC region is predominantly shielded in low-salt conditions will probably result in amyloid aggregation via a different pathway than the aggregation pathway of monomers with an exposed NAC region: the high-salt conformer might promote an intramolecular hydrophobic collapse and subsequently the formation of antiparallel β-sheets, similar to the β-sheet formation observed in monomeric αS upon C-terminus binding of polyamines15. These antiparallel β-sheet conformers are likely to have a higher fibrillation propensity, possibly leading to full-grown fibrils consisting of intramolecular antiparallel β-sheets after a 90° rotation of the hydrogen bonds in the direction of the fibril axis, similar to the conformational transition that has been simulated and experimentally observed in the self-assembly of other proteins69.
Conclusion
Our finding that even small variations in ionic strength (25 instead of 50 mM NaCl) can result in very different fibril structures could have significant physiological implications. The strong salt dependency described here is another example of the high sensitivity of αS fibrillization to aggregation conditions, besides previously described factors such as pH70, temperature6, and the presence and type of surface71 or phospholipid membrane72. The high sensitivity of αS to the aggregation conditions might contribute to the relatively frequent occurrence of contradicting findings in this field73. The mechanism proposed here should also be relevant for other amyloid forming proteins, since changes in ionic strength are known to affect the kinetics74,75 and structure76,77 of other amyloid forming proteins as well.
Methods
Terminology regarding the morphology
We use the following nomenclature to describe the different parts of the fibril structures: β-strands are covalently connected amino acids, that, by hydrogen bonding between backbone atoms of neighboring β-strands, can form hydrogen-bonded (fibrillar) intermolecular β-sheets. A protofibril is formed when multiple intermolecular β-sheets are connected via the backbones of the monomers that they are composed of, or (like in the right top panel of Fig. 4) when only a single intermolecular β-sheet is formed by the aggregated monomers. A fibril is formed when multiple protofibrils interact, e.g. by coiling around each other (like in the lower right panel of Fig. 4), to form a higher-order structure.
Computational methods
The calculations have been performed using the Transition Dipole Coupling (TDC) model. This model is based on Coulomb-like coupling between the transition dipole moments of the local modes of the amide groups, according to

with ε0 the dielectric constant,  the transition-dipole of peptide bond i, and
  the vector connecting dipole i and j. The model has extensively been described before64,65,78,79.
From the calculated normal modes we calculate the IR spectrum as follows (assuming homogeneous line broadening for the individual normal modes):

with  the transition dipole moment of mode v, ωv the eigenvalues of the Hamiltonian (that give the normal-mode frequencies), ωIR the frequency of the IR field, and Γ the linewidth. For all calculated spectra (unless noted differently) Γ = 5 cm−1 and the gas phase amide-I frequency is set to 1660 cm−1.
Sample preparation
Expression, purification and labeling of αS variants
The αS used in this study was expressed in Escherichia coli strain BL21(DE3) using the pT7-7 expression plasmid as previously reported80.
Preparation of αS fibrils
Prior to aggregation, samples of αS in 10 mM Tris buffered at pH 7.4 were freeze-dried overnight in a ScanVac Coolsafe (Labogene) to remove H2O and subsequently, phosphate buffered saline (PBS; 137 mM NaCl, 3 mM KCl, 10 mM phosphate) or appropriate amounts of NaCl prepared in D2O was added to the dried protein in separate tubes to vary ionic strength in 10 mM Tris buffer. Thereafter, all protein samples were purified using a Nanosep® 100 kDa molecular weight cut-off filter (Pall Corporation) to remove any pre-existing aggregates. The concentration of the resulting monomeric αS was measured in a NanoDrop 2000 UV-Vis spectrophotometer (Thermo Scientific) at 276 nm by using a molar extinction coefficient of 5600 cm−1M−1. The resulting purified samples did not show any absorbance beyond 320 nm (typically indicative of scattering) confirming the absence of any residual higher ordered aggregates. Finally, 150 μM of purified αS monomers were shaken continuously in a Eppendorf Thermomixer® at 1000 rpm, 37 °C until 90% conversion of monomers. For measurement of the percentage of monomer conversion, the aggregated suspensions were periodically aliquoted every 24 hours, ultracentrifuged at 10000 g to spin down aggregates, and the residual monomer concentration was estimated.
Atomic Force Microscopy (AFM)
For the AFM measurements, 20 μl of 10 μM fibril suspensions obtained after aggregation were incubated on freshly cleaved mica (15 × 15 mm) for 5 minutes. Samples were then washed with pure D2O to remove salts and dried using a slow stream of N2 gas. Thereafter samples were kept in 37 °C for 1 hour to remove any residual D2O. AFM images were acquired in tapping mode on a Dimension 3100 Scanning Probe Microscope (Bruker) using NSG01 gold probes with a resonant frequency between 87–230 kHz and a tip radius <10 nm. Fibril heights and widths were determined using NanoScope Analysis v1.5 software.
UV-Circular dichroism (UV-CD) spectroscopy
A Chirascan CD spectrometer was used to obtain UV-CD spectra of fibrils at a protein concentration of 10 μM. Fibril samples were first purified using a 100 kDa cut-off filter to remove monomeric protein that can potentially affect the spectra. The UV-CD spectra were recorded between 200 to 250 nm with a step size of 1 nm and a scanning speed of 10 nm/min, using a 1-mm path-length cuvette at room temperature.
X-ray diffraction (XRD)
A Philips X’Pert-MPD system with a Cu Kα wavelength of 1.5418 Å in reflection θ-θ mode was used to analyze the structure of the fibrils. The samples (prepared in appropriate buffers) were deposited on a monocrystal substrate cut at an angle non-parallel to surface, with a beam stop mounted on top of the sample. During the measurements the sample was rotated at a speed of 4 s/revolution. The diffractometer was operated at 40 kV and 40 mA at a 2θ range of 2–40°, employing a step size of 0.025°.
IR spectroscopy
The IR cells were prepared by pipetting 7.5 μL of fibril solution in between two CaF2 windows that are separated by a 50 μm teflon spacer. The 1D-IR spectra have been measured on a Bruker Vertex 70, with 32 scans and a resolution of 1 cm−1. The 2D-IR spectra have been measured on a setup described in detail before81. Briefly, at a repetition rate of 1 KHz, 3 mJ pulses with a central wavelength of 794 nm are converted in an optical parametric amplifier into mid-IR (~20 μJ, ~6100 nm) pulses with a spectral full width at half max (FWHM) of 150 cm−1. This beam is split into a probe and reference beam (each 5%), and a pump beam (90%) that is aligned through a Fabry-Pérot interferometer by which it is narrowed to a FWHM of 10 cm−1. The pump and probe beam are overlapped in the sample with a 1.5 ps delay in a ~200 μm focus, and the Δabsorption (Δα) is recorded after dispersion by a OrielMS260i spectrograph onto a 32 pixel MCT array with a resolution of 3.9 cm−1. The background is subtracted by comparing the Δα at (tprobe − tpump) = 1.5 and −10 ps. All IR spectra were measured at room temperature, and all presented 2D-IR spectra are (unless noted differently) measured with a perpendicular orientation of pump versus probe beam (obtained by putting the probe beam at a 45° degree angle with the pump beam, and selecting the probe beam component that is either perpendicular or parallel to the pump beam using a polarizer after the sample, in order to avoid beam pointing differences for the two polarizations). The anisotropy  of the cross peaks is correlated with the relative orientation of the transition dipole moments θ of the peaks with R = (3cos(θ)2 − 1)/5. The 2D-IR spectra were typically recorded by measuring 10 scans of each approximately 1 hour; the standard deviations σR and σθ were calculated by determining R and θ for each scan individually. In order to minimize scattering contributions the average of 2 PEM-induced pump delays was measured such that the interference between the scattered pump beam and the probe beam has a 180° phase in one delay with respect to the other delay (analogous to the scatter reduction presented in ref. 82 where a wobbler is used for the same purpose).
Supplementary information
See Supplementary information for additional information on: (S1) the AFM results, (S2) the αS-like structures used for the spectral calculations, (S3) additional calculated spectra, (S4) normal mode analyses of the modes discussed in the main text, (S5) calculated spectra as a function of fibril length, (S6) the structures used to determine whether the effects found for the αS-like structures are also found back in other fibrillar structures, (S7) the corresponding calculated spectra as a function of the (anti)parallel stacking, number of stacked intermolecular β-sheets and intersheet distance, (S8) the results of the spectral calculations on fibrils formed by VEALYL that are composed of antiparallel intermolecular β-sheets, (S9) the calculated spectrum of 5 stacked β-sheets stacked in an antiparallel fashion that reproduces the 4 experimentally observed peaks for high-salt fibrils, and (S10) the 1D- and 2D-IR spectra that show that the structure of αS fibrils does not change if 150 mM NaCl is added to fibrils that have been aggregated in a no-salt containing buffer.
Additional Information
How to cite this article: Roeters, S. J. et al. Evidence for Intramolecular Antiparallel Beta-Sheet Structure in Alpha-Synuclein Fibrils from a Combination of Two-Dimensional Infrared Spectroscopy and Atomic Force Microscopy. Sci. Rep. 7, 41051; doi: 10.1038/srep41051 (2017).
Publisher's note: Springer Nature remains neutral with regard to jurisdictional claims in published maps and institutional affiliations.
References
Serpell, L. C. Alzheimer’s amyloid fibrils: structure and assembly. Biochim. Biophys. Acta 1502, 16–30 (2000).
Eanes, E. D. & Glenner, G. G. X-ray diffraction studies on amyloid filaments. J. Histochem. Cytochem. 16, 673–677 (1968).
Knowles, T. P. J., Vendruscolo, M. & Dobson, C. M. The amyloid state and its association with protein misfolding diseases. Nature 15, 384–396 (2014).
Goedert, M., Spillantini, M. G., Del Tredici, K. & Braak, H. 100 years of lewy pathology. Nat. Rev. Neurol. 9, 13–24 (2013).
Lashuel, H. A., Overk, C. R., Oueslati, A. & Masliah, E. The many faces of α-synuclein: from structure and toxicity to therapeutic target. Nat. Rev. Neurosci. 14, 38–48 (2013).
Munishkina, L. A., Henriques, J., Uversky, V. N. & Fink, A. L. Role of protein-water interactions and electrostatics in α-synuclein fibril formation. Biochemistry 43, 3289–3300 (2004).
Bousset, L. et al. Structural and functional characterization of two alpha-synuclein strains. Nat. Commun. 4, 2575–2575 (2012).
Maltsev, A. S., Ying, J. & Bax, A. Impact of N-Terminal Acetylation of α-Synuclein on Its Random Coil and Lipid Binding Properties. Biochemistry 51, 5004–5013 (2012).
Theillet, F.-X. et al. Physicochemical Properties of Cells and Their Effects on Intrinsically Disordered Proteins (IDPs). Chem. Rev. 114, 6661–6714 (2014).
Gath, J. et al. Unlike Twins: An NMR Comparison of Two α-Synuclein Polymorphs Featuring Different Toxicity. PLOS ONE 9, e90659 (2014).
Buell, A. K. et al. Solution conditions determine the relative importance of nucleation and growth processes in α-synuclein aggregation. Proc. Natl. Acad. Sci. USA 111, 7671–7676 (2014).
Semerdzhiev, S. A., Dekker, D. R., Subramaniam, V. & Claessens, M. M. A. E. Self-Assembly of Protein Fibrils into Suprafibrillar Aggregates: Bridging the Nano- and Mesoscale. ACS Nano 8, 5543–5551 (2014).
Antony, T., Hoyer, W., Cherny, D., Heim, G. & Jovin, T. M. Cellular polyamines promote the aggregation of α-synuclein. J. Biol. Chem. 278, 3235–3240 (2003).
Hoyer, W., Cherny, D., Subramaniam, V. & Jovin, T. M. Impact of the acidic C-terminal region comprising amino acids 109-140 on α-synuclein aggregation in vitro . Biochemistry 43, 16233–16242 (2004).
Fernandez, C. O., Hoyer, W. & Zweckstetter, M. Nmr of α-synuclein-polyamine complexes elucidates the mechanism and kinetics of induced aggregation. EMBO J. 23, 2039–2046 (2004).
Bertoncini, C. W. et al. Release of long-range tertiary interactions potentiates aggregation of natively unstructured alpha-synuclein. Proc. Natl. Acad. Sci. USA 102, 1430–1435 (2005).
Wu, K.-P. & Baum, J. Detection of Transient Interchain Interactions in the Intrinsically Disordered Protein α-Synuclein by NMR Paramagnetic Relaxation Enhancement. J. Am. Chem. Soc. 132, 5546–5547 (2010).
Heise, H. et al. Molecular-level secondary structure, polymorphism, and dynamics of full-length alpha-synuclein fibrils studied by solid-state NMR. Proc. Natl. Acad. Sci. USA 102, 15871–15876 (2005).
Vilar, M. et al. The fold of α-synuclein fibrils. Proc. Natl. Acad. Sci. USA 105, 8637–8642 (2008).
Comellas, G. et al. Structured Regions of α-Synuclein Fibrils Include the Early-Onset Parkinson’s Disease Mutation Sites. J. Mol. Biol. 411, 881–895 (2011).
Lv, G. et al. Structural Comparison of Mouse and Human α-Synuclein Amyloid Fibrils by Solid-State NMR. J. Mol. Biol. 420, 99–111 (2012).
Rodriguez, J. A. et al. Structure of the toxic core of α-synuclein from invisible crystals. Nature 525, 486–490 (2015).
Tuttle, M. D. et al. Solid-state NMR structure of a pathogenic fibril. Nat. Struct. Mol. Biol. 1–9 (2016).
Der-Sarkissian, A., Jao, C. C., Chen, J. & Langen, R. Structural organization of α-synuclein fibrils studied by site-directed spin labeling. J. Biol. Chem. 278, 37530–37535 (2003).
Chen, M., Margittai, M., Chen, J. & Langen, R. Investigation of alpha-synuclein fibril structure by site-directed spin labeling. J. Biol. Chem. 282, 24970–24979 (2007).
Higgs, P. W. The Vibration Spectra of Helical Molecules: Infra-Red and Raman Selection Rules, Intensities and Approximate Frequencies. Proc. R. Soc. A 220, 472–485 (1953).
Moffitt, W. Optical Rotatory Dispersion of Helical Polymers. J. Chem. Phys. 25, 467 (1956).
Surewicz, W. K. & Mantsch, H. H. New insight into protein secondary structure from resolution-enhanced infrared spectra. Biochim. Biophys. Acta 952, 115–130 (1988).
Surewicz, W. K., Mantsch, H. H. & Chapman, D. Determination of Protein Secondary Structure by Fourier-Transform Infrared-Spectroscopy - a Critical-Assessment. Biochemistry 32, 389–394 (1993).
Jackson, M. & Mantsch, H. H. The Use and Misuse of FTIR Spectroscopy in the Determination of Protein Structure. Crit. Rev. Biochem. Mol. Biol. 30, 95–120 (1995).
Zandomeneghi, G., Krebs, M., McCammon, M. & Fändrich, M. Ftir reveals structural differences between native β-sheet proteins and amyloid fibrils. Protein Sci 13, 3314–3321 (2004).
Hamm, P. & Zanni, M. Concepts and Methods of 2D Infrared Spectroscopy (Cambridge University Press, Cambridge, U.K., 2011).
Celej, M. S. et al. Toxic prefibrillar α-synuclein amyloid oligomers adopt a distinctive antiparallel β-sheet structure. Biochem. J. 443, 719–726 (2012).
Conway, K. A., Harper, J. D. & Lansbury, P. T. Fibrils formed in vitro from α-synuclein and two mutant forms linked to parkinson’s disease are typical amyloid. Biochemistry 39, 2552–2563 (2000).
Rochet, J.-C., Conway, K. A. & Lansbury, P. T. Inhibition of fibrillization and accumulation of prefibrillar oligomers in mixtures of human and mouse α-synuclein. Biochemistry 39, 10619–10626 (2000).
Ramakrishnan, M., Jensen, P. H. & Marsh, D. Association of α-Synuclein and Mutants with Lipid Membranes: Spin-Label ESR and Polarized IR. Biochemistry 45, 3386–3395 (2006).
Ghosh, D. et al. The Parkinson’s Disease-Associated H50Q Mutation Accelerates α-Synuclein Aggregation in Vitro . Biochemistry 52, 6925–6927 (2013).
Narhi, L., Wood, S. J., Steavenson, S. & Jiang, Y. Both familial Parkinson’s disease mutations accelerate α-synuclein aggregation. J. Biol. Chem. 274, 9843–9846 (1999).
Biere, A. L. et al. Parkinson’s Disease-associated Alpha-Synuclein Is More Fibrillogenic than Beta- and Gamma-Synuclein and Cannot Cross-seed Its Homologs. J. Biol. Chem. 275, 34574–34579 (2000).
Chen, S. W. et al. Structural characterization of toxic oligomers that are kinetically trapped during α-synuclein fibril formation. Proc. Natl. Acad. Sci. USA 112, E1994–E2003 (2015).
Khalil, M. & Tokmakoff, A. Signatures of vibrational interactions in coherent two-dimensional infrared spectroscopy. Chem. Phys. 266, 213–230 (2001).
Demirdöven, N. et al. Two-dimensional infrared spectroscopy of antiparallel β-sheet secondary structure. J. Am. Chem. Soc. 126, 7981–7990 (2004).
Strasfeld, D. B., Ling, Y. L., Gupta, R., Raleigh, D. P. & Zanni, M. T. Strategies for Extracting Structural Information from 2D IR Spectroscopy of Amyloid: Application to Islet Amyloid Polypeptide. J. Phys. Chem. B 113, 15679–15691 (2009).
Wang, L. et al. 2DIR Spectroscopy of Human Amylin Fibrils Reflects Stable β-Sheet Structure. J. Am. Chem. Soc. 133, 16062–16071 (2011).
Moran, S. D. et al. Two-dimensional IR spectroscopy and segmental 13C labeling reveals the domain structure of human γD-crystallin amyloid fibrils. Proc. Natl. Acad. Sci. USA 109, 3329–3334 (2012).
Moran, S. D. & Zanni, M. T. How to Get Insight into Amyloid Structure and Formation from Infrared Spectroscopy. J. Phys. Chem. Lett. 5, 1984–1993 (2014).
Kamiyoshihara, T., Kojima, M., Uéda, K. & Tashiro, M. Observation of multiple intermediates in α-synuclein fibril formation by singular value decomposition analysis. Biochem. Biophys. Res. Commun. 355, 398–403 (2007).
Khalife, M. et al. Alpha-Synuclein Fibrils Interact with Dopamine Reducing its Cytotoxicity on PC12 Cells. Protein J. 34, 291–303 (2015).
Ghosh, D. et al. Structure based aggregation studies reveal the presence of helix-rich intermediate during α-Synuclein aggregation. Sci. Rep. 5, 9228 (2015).
Serpell, L. C., Berriman, J., Jakes, R., Goedert, M. & Crowther, R. A. Fiber diffraction of synthetic alpha-synuclein filaments shows amyloid-like cross-beta conformation. Proc. Natl. Acad. Sci. USA 97, 4897–4902 (2000).
Karjalainen, E.-L., Ravi, H. K. & Barth, A. Simulation of the Amide I Absorption of Stacked β-Sheets. J. Phys. Chem. B. 115, 749–757 (2011).
Shivu, B. et al. Distinct β-Sheet Structure in Protein Aggregates Determined by ATR-FTIR Spectroscopy. Biochemistry 52, 5176–5183 (2013).
Barth, A. Infrared spectroscopy of proteins. BBA-Bioenergetics 1767, 1073–1101 (2007).
Barth, A. & Zscherp, C. What vibrations tell about proteins. Q. Rev. Biophys. 35, 369–430 (2002).
Ganim, Z. et al. Amide I two-dimensional infrared spectroscopy of proteins. Acc. Chem. Res. 41, 432–441 (2008).
Miyazawa, T. Perturbation Treatment of the Characteristic Vibrations of Polypeptide Chains in Various Configurations. J. Chem. Phys. 32, 1647 (1960).
Bradbury, E. & Elliott, A. Infra-red spectra and chain arrangement in some polyamides, polypeptides and fibrous proteins. Polymer 4, 47–59 (1963).
Marsh, D. Dichroic ratios in polarized Fourier transform infrared for nonaxial symmetry of beta-sheet structures. Biophys. J. 72, 2710–2718 (1997).
Bush, C. A., Sarkar, S. K. & Kopple, K. D. Circular dichroism of β turns in peptides and proteins. Biochemistry (1978).
The equivalent of two stacks of five intermolecular β-sheets, each of the two composed of monomers in an antiparallel intramolecular β-sheet configuration similar to the intramolecular structure suggested previously in the literature19, together adding up to a thickness of 7 nm as observed with AFM (see Fig. S1).
Kubelka, J. & Keiderling, T. A. Differentiation of β-Sheet-Forming Structures: Ab Initio-Based Simulations of IR Absorption and Vibrational CD for Model Peptide and Protein β-Sheets. J. Am. Chem. Soc. 123, 12048–12058 (2001).
Kubelka, J., Kim, J., Bour, P. & Keiderling, T. A. Contribution of transition dipole coupling to amide coupling in IR spectra of peptide secondary structures. Vib. Spectrosc. 42, 63–73 (2006).
Perálvarez-Marn, A., Barth, A. & Gräslund, A. Time-Resolved Infrared Spectroscopy of pH-Induced Aggregation of the Alzheimer Aβ1-28 Peptide. J. Mol. Biol. 379, 589–596 (2008).
Krimm, S. & Abe, Y. Intermolecular interaction effects in the amide I vibrations of β polypeptides. Proc. Natl. Acad. Sci. USA 69, 2788 (1972).
Torii, H. & Tasumi, M. Ab initio molecular orbital study of the amide i vibrational interactions between the peptide groups in di- and tripeptides and considerations on the conformation of the extended helix. J. Raman Spectrosc. 29, 81–86 (1998).
Schweitzer-Stenner, R. Visible and UV-resonance Raman spectroscopy of model peptides. J. Raman Spectrosc. 32, 711–732 (2001).
Theillet, F.-X. et al. Structural disorder of monomeric α-synuclein persists in mammalian cells. Nature 530, 45–50 (2016).
Increasing monovalent ion concentrations probably shift the equilibrium in a similar fashion (towards the NAC-region exposed form of monomeric αS), because the conformation of αS monomers changes in a similar fashion as a function of [NaCl] as it does for polyamines, as indicated by the similar influence mono- and polycations have on the UV-CD spectrum6.
Schor, M., Martens, A. A., deWolf, F. A., Cohen Stuart, M. A. & Bolhuis, P. G. Prediction of solvent dependent β-roll formation of a self-assembling silk-like protein domain. Soft Matter 5, 2658 (2009).
Kim, T. D., Paik, S. R. & Yang, C.-H. Structural and functional implications of c-terminal regions of α-synuclein. Biochemistry 41, 13782–13790 (2002).
Burke, K. A., Yates, E. A. & Legleiter, J. Biophysical insights into how surfaces, including lipid membranes, modulate protein aggregation related to neurodegeneration. Front. Neurol. 4, 17 (2013).
Bodner, C. R., Dobson, C. M. & Bax, A. Multiple Tight Phospholipid-Binding Modes of α-Synuclein Revealed by Solution NMR Spectroscopy. J. Mol. Biol. 390, 775–790 (2009).
Tycko, R. Molecular structure of amyloid fibrils: insights from solid-state nmr. Q. Rev. Biophys. 39, 1–55 (2006).
Marek, P. J., Patsalo, V., Green, D. F. & Raleigh, D. P. Ionic Strength Effects on Amyloid Formation by Amylin Are a Complicated Interplay among Debye Screening, Ion Selectivity, and Hofmeister Effects. Biochemistry 51, 8478–8490 (2012).
Buell, A. K. et al. Electrostatic Effects in Filamentous Protein Aggregation. Biophys. J. 104, 1116–1126 (2013).
Pedersen, J. S., Flink, J. M., Dikov, D. & Otzen, D. E. Sulfates Dramatically Stabilize a Salt-Dependent Type of Glucagon Fibrils. Biophys. J. 90, 4181–4194 (2006).
Klement, K. et al. Effect of Different Salt Ions on the Propensity of Aggregation and on the Structure of Alzheimer’s Aβ(1-40) Amyloid Fibrils. J. Mol. Biol. 373, 1321–1333 (2007).
Hamm, P., Lim, M., DeGrado, W. & Hochstrasser, R. The two-dimensional IR nonlinear spectroscopy of a cyclic penta-peptide in relation to its three-dimensional structure. Proc. Natl. Acad. Sci. USA 96, 2036–2041 (1999).
Hamm, P. & Woutersen, S. Coupling of the amide I modes of the glycine di-peptide. Bull. Chem. Soc. Japan 75, 985–988 (2002).
van Raaij, M. E., Segers-Nolten, I. M. & Subramaniam, V. Quantitative morphological analysis reveals ultrastructural diversity of amyloid fibrils from alpha-synuclein mutants. Biophys. J 91 (2006).
Huerta-Viga, A., Shaw, D. & Woutersen, S. pH dependence of the conformation of small peptides investigated with two-dimensional vibrational spectroscopy. J. Phys. Chem. B 114 (2010).
Helbing, J. & Hamm, P. Compact implementation of Fourier transform two-dimensional IR spectroscopy without phase ambiguity. J. Opt. Soc. Am. B 28, 171–178 (2011).
Dearborn, A. D. et al. α-Synuclein Amyloid Fibrils with Two Entwined, Asymmetrically Associated, Protofibrils. J. Biol. Chem. 291, 2310–2318 (2015).
Bortolini, C., Jones, N. C., Hoffmann, S. V., Besenbacher, F. & Dong, M. Soft Matter. Soft Matter 12, 373–377 (2015).
Yang, Y., Meyer, R. B. & Hagan, M. F. Self-Limited Self-Assembly of Chiral Filaments. Phys. Rev. Lett. 104, 258102 (2010).
Acknowledgements
We thank Nathalie Schilderink from University of Twente for assistance with αS expression and purification, Slav Semerdzhiev from the University of Twente for discussions, and Prof. Antoinette Killian from the Utrecht University and Prof. Roberta Croce from the VU University Amsterdam, for facilitating the UV-CD spectroscopy measurements. The work presented here is part of a project titled “A Single Molecule View on Protein Aggregation” (No. 127) funded by Foundation for Fundamental Research on Matter (FOM), and it is supported by NanoNextNL, a micro- and nanotechnology consortium of the Government of the Netherlands and 130 partners. We acknowledge the European Research Council (ERC) for funding through grant 210999. This research was also financially supported by the Netherlands Organization for Scientific Research (NWO).
Author information
Authors and Affiliations
Contributions
S.J.R., A.I., V.S. and S.W. designed the research, S.J.R. measured and analyzed the IR spectra and performed the spectral calculations, A.I. measured and analyzed the AFM images (together with G.P.) and measured the UV-CD spectra, V.K. measured and analyzed the XRD spectra. All authors reviewed the manuscript.
Corresponding authors
Ethics declarations
Competing interests
The authors declare no competing financial interests.
Supplementary information
Rights and permissions
This work is licensed under a Creative Commons Attribution 4.0 International License. The images or other third party material in this article are included in the article’s Creative Commons license, unless indicated otherwise in the credit line; if the material is not included under the Creative Commons license, users will need to obtain permission from the license holder to reproduce the material. To view a copy of this license, visit http://creativecommons.org/licenses/by/4.0/
About this article

Cite this article
Roeters, S., Iyer, A., Pletikapić, G. et al. Evidence for Intramolecular Antiparallel Beta-Sheet Structure in Alpha-Synuclein Fibrils from a Combination of Two-Dimensional Infrared Spectroscopy and Atomic Force Microscopy. Sci Rep 7, 41051 (2017). https://doi.org/10.1038/srep41051
Received:
Accepted:
Published:
DOI: https://doi.org/10.1038/srep41051
This article is cited by
-
α-Synuclein emulsifies TDP-43 prion-like domain—RNA liquid droplets to promote heterotypic amyloid fibrils
Communications Biology (2023)
-
Bivalent metal ions induce formation of α-synuclein fibril polymorphs with different cytotoxicities
Scientific Reports (2022)
-
The influence of cations on α-lactalbumin amyloid aggregation
JBIC Journal of Biological Inorganic Chemistry (2022)
-
pH-controlled stacking direction of the β-strands in peptide fibrils
Scientific Reports (2020)
-
Extent of N-terminus exposure of monomeric alpha-synuclein determines its aggregation propensity
Nature Communications (2020)
Comments
By submitting a comment you agree to abide by our Terms and Community Guidelines. If you find something abusive or that does not comply with our terms or guidelines please flag it as inappropriate.
