
Abstract
Coccolithophores are single-celled photosynthesizing marine algae, responsible for half of the calcification in the surface ocean, and exert a strong influence on the distribution of carbon among global reservoirs, and thus Earth’s climate. Calcification in the surface ocean decreases the buffering capacity of seawater for CO2, whilst photosynthetic carbon fixation has the opposite effect. Experiments in culture have suggested that coccolithophore calcification decreases under high CO2 concentrations ([CO2(aq)]) constituting a negative feedback. However, the extent to which these results are representative of natural populations, and of the response over more than a few hundred generations is unclear. Here we describe and apply a novel rationale for size-normalizing the mass of the calcite plates produced by the most abundant family of coccolithophores, the Noëlaerhabdaceae. On average, ancient populations subjected to coupled gradual increases in [CO2(aq)] and temperature over a few million generations in a natural environment become relatively more highly calcified, implying a positive climatic feedback. We hypothesize that this is the result of selection manifest in natural populations over millennial timescales, so has necessarily eluded laboratory experiments.
Introduction
Coccolithophores are the modern ocean’s dominant calcifying phytoplankton and coccoliths, the distinctive calcite plates that they produce, have populated the fossil record for over 200 million years1,2. Biogenic calcification is an important climatic feedback3,4, and in most organisms is thought to be strongly affected by changes in the carbonate chemistry of seawater. In coccolithophores, calcite precipitation occurs inside the cell, so the site of calcite precipitation is buffered from the external environment and is subject to an unusually high degree of biological control. The most abundant modern species of coccolithophore are Emiliania huxleyi and Gephyrocapsa oceanica; bloom-forming members of the family Noëlaerhabdaceae (Haptophyta: Coccolithophyceae: Isochrysidales: Noëlaerhabdaceae). Laboratory culture experiments have shown that these two species tend to calcify less when carbon dioxide concentrations are higher5,6,7, although the trade off between DIC availability and pH appears to be critical8. Yet these observed responses each characterize a single genome, adapted to the modern environment and exposed to artificially manipulated conditions in the laboratory in the absence of genetic change (phenotypic plasticity). In nature, communities are genetically and phenotypically heterogeneous, and selective pressures lead to competition. Environments are dynamic, and changes in average conditions are subtle and prolonged. Sexual reproduction, which has never been observed in the laboratory in coccolithophores, genetically homogenizes a population within a biological species, whilst accelerating adaptation through propagation of the most beneficial combinations of alleles and removal of deleterious mutations via natural selection. To elucidate the role of these phytoplanktonic marine calcifiers in nature across geological history, their response must be studied on timescales of tens to tens of thousands of years, within natural populations, where evolutionarily relevant processes such as meiosis and syngamy may occur9,10, and where the rate and amplitude of environmental change is representative of the real world. Indeed a theoretical model has suggested that on such timescales the selective pressure of increasing [CO2(aq)] may have favoured the more heavily calcified forms of coccolithophore11.
An apparent dichotomy exists between the consensus view of phenotypic plasticity as observed in short-term experiments and the theoretical result of long-term evolutionary adaptation. However, experiments lasting hundreds of generations have shown that asexual coccolithophore populations have the potential to adapt in culture12,13 and large-scale surveys have revealed trends across spatial environmental gradients in nature14,15. The fossil record, by contrast, is an archive of information about ancient natural coccolithophore communities that responded to real environmental changes over geological timescales. The challenge is to extract meaningful information from this resource. Isolated coccoliths in deep-sea sediment are often the only remnants of ancient coccolithophores to survive geological time, so inferences about the physiology of coccolithophores that lived in the past must come from this evidence alone.
Results
Size-normalization of coccolith mass
Studies to date have yielded contradictory results regarding the response of calcification to environmental change on geological timescales14,16, but this disagreement is, at least in part, a result of the lack of consistency between the parameter measured, and how this is inferred to represent “calcification intensity”. Coccolith mass has been used extensively to infer calcification ability14,15,16,17,18,19, but as it is not independent of coccolith size, size-normalization is highly nontrivial and it remains a biologically abstract quantity. In order to solve this problem, we have developed a procedure for size-normalising coccolith mass, by correlating an index based on coccolith morphometry with the molar ratio of particulate inorganic to particulate organic carbon (PIC:POC) of the biomass. The PIC:POC ratio is a direct record of the ratio of integrated rates of calcification to photosynthesis3, and therefore describes an energetic and carbon budget trade off between calcification and biological (metabolic) activity that makes more sense biologically than coccolith mass in the context of physiology and adaptation, and is independent of coccolithophore size. Through size-normalising mass by consideration of a dimensionless but biologically meaningful parameter, we circumvent problems associated with allometry. The concept for size-normalising coccolith mass is based on the following arguments:
-
i
The molar PIC:POC ratio of coccolithophore biomass is proportional to the ratio of spherical volumes of calcite to organic matter (Fig. 1B).
Figure 1: Size-normalisation of coccolith mass. 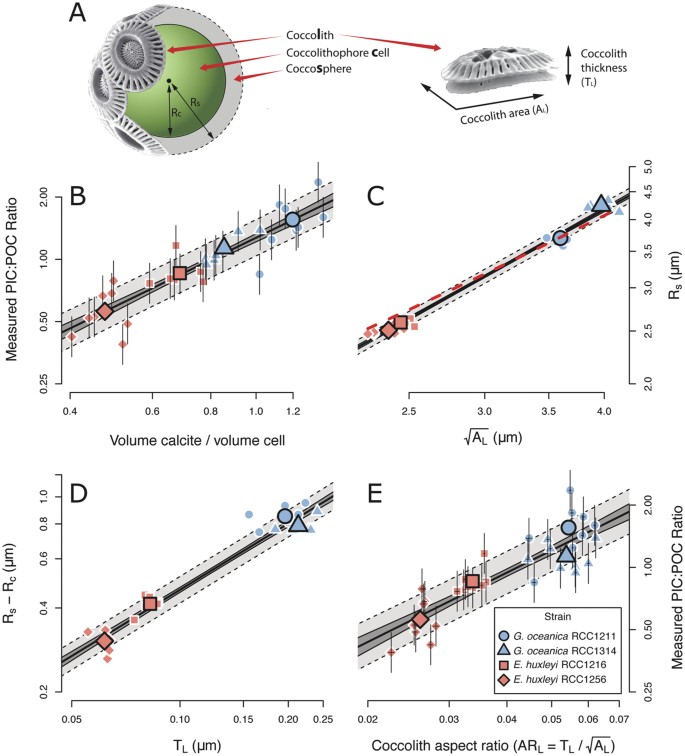
(A) Schematic representation of coccolithophore cell, with variables defined. (B) Regression of molar PIC:POC ratio against volumetric ratios of calcite to organic material (Eq. 1). (C) Regression of coccosphere radius against the square root of coccolith area. The red dashed line represents an independently derived relationship between coccolith size and coccosphere size21. (D) Regression of coccosphere thickness against coccolith thickness. (E) Regression of molar PIC:POC ratio against coccolith aspect ratio (
 ; Eq. 3). The dark region around each regression line represents the 1σ confidence interval of the regression, whilst the lighter region with the dashed border represents the 1σ prediction interval of the regression. Error bars on individual points represent the 1σ confidence interval of each measurement. SEM images courtesy of Jeremy Young, used and adapted with permission (http://ina.tmsoc.org/Nannotax3/).
 -
ii
The square root of coccolith area (
 ), which we use as a 1-dimensional measure of coccolith size, is proportional to coccosphere radius (Rs):
  (Fig. 1C).
 -
iii
Coccolith thickness (TL) is proportional to coccosphere thickness (Ts = Rs − Rc): Ts ∝ TL (Fig. 1D).
-
iv
Given (i), (ii) and (iii), a combination of coccolith mass and area can be related back to coccolithophore PIC:POC, via cell and coccosphere dimensions, thus providing a rationale for size-normalisation of mass (Fig. 1E).

 ; Eq. 3). The dark region around each regression line represents the 1σ confidence interval of the regression, whilst the lighter region with the dashed border represents the 1σ prediction interval of the regression. Error bars on individual points represent the 1σ confidence interval of each measurement. SEM images courtesy of Jeremy Young, used and adapted with permission (
 ), which we use as a 1-dimensional measure of coccolith size, is proportional to coccosphere radius (Rs):
  (
(We tested each assumption and calibrated our mass-normalisation concept using cultured coccolithophores. We grew two strains each of E. huxleyi and G. oceanica in artificial seawater, which was chemically altered to four different DIC concentrations, at constant pH, temperature and nutrient levels, in duplicate (see methods). (i) was established via in vivo measurement of coccosphere and cell volumes, and direct measurement of the molar PIC:POC ratio of the biomass:

where Vs and Vc are respectively the solid spherical volumes of the coccosphere and the cell, and Rs and Rc are respectively the radii of the coccosphere and the cell (as labelled in Fig. 1A). Equation 1 is shown in Fig. 1B.
To generate disarticulated coccoliths, the filtered culture residue was bleached to remove organic matter whilst preserving the calcite intact, emulating the effect of decomposition. We analyzed this synthetic coccolith-sediment using SYRACO20; an automated image analysis tool, which measures coccolith area and mass (see methods). Our data support assumptions (ii) and (iii) (Fig. 1C,D respectively). The relationship that we find between coccolith size and cell size agrees with the well established relationship between coccolith length and cell size in the Noëlaerhabdaceae21, which is derived from fossils (red dashed line Fig. 1C). That our strains all lie on the same line as fossil Noëlaerhabdaceae supports the theory that this family of coccolithophores are a continuum of forms14,21. Equation 1 can be simplified by approximating the cell and coccosphere as having the same radius (Rs). The volume of organic material is then the volume of a sphere of radius, Rs, and the volume of calcite in the coccosphere is that of a thin shell of thickness Ts and radius Rs. Using assumptions (ii) and (iii) gives:

where ML = coccolith mass, and AL = coccolith area are the direct output from the SYRACO analysis, and ML/AL = TL. As per (iv), an ordinary least squares linear regression incorporating an estimate of the uncertainty in PIC:POC based on the 1σ prediction interval gives:

where  is the lateral cross-sectional aspect ratio of a coccolith (ARL).
Equation 3 is derived from first principles, and is supported empirically. The calibration is shown in Fig. 1E. ARL is taken to be the most sensible way of size-normalising coccolith mass, which alone is biologically meaningless. Caveats associated with directly translating ARL to PIC:POC using Eq. 3 are discussed later.
Down-core experiment
To explore the calcification response of natural coccolithophore populations to climatic change in the form of a down-core experiment, we used this novel approach to analyze sediment-core material from two glacial terminations, which are of contrasting magnitude (Fig. 2). The larger of these terminations sees an increase in atmospheric CO2 mixing ratios (CO2atm) similar in magnitude to that since the industrial revolution, albeit two orders of magnitude slower. SYRACO analysis was performed on sediment from ODP site 1123, on Chatham rise, east of New Zealand in the southernmost Pacific (41°47.2′S, 171°29.9′W, 3290 m water depth). Depths span the penultimate and 6th most recent glacial-interglacial cycles (MIS 7-5: ~200–100 ka and MIS 15-13: ~600–500 ka, respectively), and sample resolution is higher (~1000 year) over the terminations (TII: ~140–125 ka and TVI: ~540–520 ka). Dissolution proxies22 and SEM observations of coccoliths show good preservation at this site throughout the periods of interest. ODP site 1123 exists at the northern edge of the sub tropical front (STF) in the southernmost Pacific Ocean, and may see an increased influence of sub antarctic water during glacials and subtropical water during interglacials22. We used in situ proxy reconstructions of sea surface temperature (SST) and relative nutrient concentration to infer surface ocean conditions throughout the periods of interest. We calculated [CO2(aq)] from published CO2atm records from ice cores (see methods) and from SST inferred from planktic foram Mg/Ca ratios (see methods), assuming equilibrium between the atmosphere and surface waters. [CO2(aq)] and temperature increased during each glacial termination, with no obvious change in relative nutrient concentrations (see methods and Fig. S2). pH and [DIC] were unconstrained, but on these timescales, the decrease in pH due to invasion of CO2 may be partially buffered by dissolution of carbonate sediments. For this reason, [CO2(aq)] is used to describe the carbonate system, as this is the most well constrained component.

(A) benthic δ18O49, and 5kyr interval average sea-surface temperature (from Mg/Ca ratios in planktic forams; filled triangles over TII represent an alternative size fraction - see methods) and [CO2(aq)] (calculated from CO2 atm52 and SST) at ODP site 1123 in the southern Pacific Ocean. (B–D) Coccolith morphometrics: (B) Mass, (C) Area and (D) Aspect ratio. Raw data are displayed as frequency-density contour plots. Emiliania huxley-affiliated morphotaxa (MGEmi) are hollow squares, Gephyrocapsa spp.-affiliated morphotaxa (MGGeo) are hollow diamonds and filled circles (population mean) represent the mean of the Noëlaerhabdaceae-affiliated morphotaxa in each sample. Arithmetic coefficient of variation (CV) is a measure of the mean-independent variance of log-normal data, and is shown in grey. Map was made using GMT 5.2.1 (http://gmt.soest.hawaii.edu/)58.
SYRACO analysis20 measures the mass and area of each coccolith belonging to the family Noëlaerhabdaceae in the analysed samples. ARL is calculated subsequently. Additionally, each coccolith is assigned to a morphotaxonomic group on the basis of shape. These groupings approximate species-level taxonomic classifications and provide insight into subsets of the population. Here we show morphotaxon-specific records for the groups dominated by large Gephyrocapsa spp. and by E. huxleyi (MGGeo and MGEmi respectively). These species are the most thoroughly studied in the laboratory, and their ultrastructure is suited to SYRACO analysis.
Down-core results
Over TII, mean Noëlaerhabdaceae coccolith mass and area increase transiently across the termination. This is accompanied by an increase in the mean-independent variance (arithmetic coefficient of variation; ACV) in both of these variables (Fig. 2), implying a non-uniform response within the population. Specifically, the mass and area of MGGeo transiently increase in parallel (almost doubling) over the termination, but (MGEmi) shows a subtle decrease. Over TVI, prior to the first appearance of E. huxleyi coccoliths in the fossil record at around 290 ka23, the absolute magnitude and ACV of Noëlaerhabdaceae coccolith mass is very stable, though with a large decrease in ACV during the MIS14 glacial inception. The absolute magnitude of coccolith area, however, peaks during MIS14 glacial maximum and decreases during TVI, but with little change in the area ACV. The time series of population mean ARL (size-normalised mass) exhibits an increase across both terminations. This effect is paralleled but larger in the ARL of MGGeo, which increases by ~30% across both TII and TVI. By contrast, the ARL response of MGEmi across TII is of a slight decrease. The absence of E. huxleyi explains the higher population mean ARL over TVI than over TII, and its presence and opposing response to G. oceanica, as inferred from the morphotaxa, explains the increased variance observed over TII. The parameter ARL reconciles the differing response of mass and area of MGGeo to increasing [CO2(aq)] and temperature across these two terminations.
Discussion
The ARL time series implies that coccoliths become more calcified in Noëlaerhabdaceae, and especially G.oceanica, with increasing [CO2(aq)] and temperature at site 1123 in natural populations over a timescale of thousands of years. This increase contrasts with results from the literature that describe the capacity for phenotypic plasticity in these organisms. In the laboratory, single strains of G. oceanica calcify relatively less with increasing [CO2(aq)]5,6,7,24, and there is no discernible effect of temperature7. E. huxleyi’s plastic response to increasing CO2 concentration over the reconstructed [CO2(aq)] range of our time series is of decreasing calcification when [DIC] or alkalinity (ALK) is held constant5,6,7,25,26 but the opposite at constant pH26. In E. huxleyi the plastic effect of temperature in the laboratory is large, but non-linear and poorly constrained7.
So far, our proposed method for size-normalising coccolith mass has used the PIC:POC ratio simply to justify our theoretical rationale with real biological data. It is, however, possible to use this relationship as a proxy for PIC:POC, using the coccolith aspect ratio as an input. The predictive power of Eq. 3 as a proxy for Noëlaerhabdaceae PIC:POC is dictated by the spread of the residuals about the regression line: the prediction interval - not only by the confidence interval, which describes the uncertainty in the relationship27. With due consideration of the associated caveats, and formal consideration of uncertainty, Eq. 3 can be used as a proxy to directly infer PIC:POC from Noëlaerhabdaceae coccolith morphometry (Fig. 3). If the constant of proportionality between coccolith size and cell size is systematically influenced by the environment or differences between species, this will be reflected in the estimate of PIC:POC. In our calibration, hundreds of thousands of cells, and thousands of individual coccoliths were measured for each sample, which has the effect of averaging over the potential variation in the slope of Eq. 3 due to variations in the number of coccoliths per cell, or the degree of overlap of coccoliths. Indeed, the established relationship between coccolith size and cell size in heterogeneous natural fossil populations21 agrees with ours very well (Fig. 1C), lending support to the constant relationship between cell size and coccolith size, and application to the whole Noëlaerhabdaceae family. Coccolith over-production in E. huxleyi, the only species where multiple coccolith layers are produced, will cause coccolith morphometry to underestimate net PIC:POC, and this is unavoidable. In the rare deposits where preservation is exceptional and coccospheres are intact, such as in the Lagerstätte deposits of Tanzania28,29, Eq. 1 may be used to estimate PIC:POC directly. This approach would bypass the assumptions necessary to infer PIC:POC directly from disarticulated coccoliths.

(A) The response of MGEmi in nature is within the range of uncertainty and of plasticity of E. huxleyi observed in the laboratory. (B,C) The PIC:POC of MGGeo in nature increases across both terminations, which is opposite to the equivalent plastic response as inferred from culture manipulations in G. oceanica. Error bars represent the 1σ uncertainty, which for the down-core response, is calculated using the prediction interval of Eq. 3. For culture results, details of the regressions are given in the Supplementary material.
With the aforementioned caveats in mind, changes in ARL can be used to directly estimate the PIC:POC ratio of the biomass in these ancient organisms using Eq. 3, albeit with a rather large associated uncertainty. We have compiled PIC:POC values from the literature and compared them with results inferred from our down-core record (Fig. 3 and Fig. S1). The PIC:POC of both the Noëlaerhabdaceae family mean, and of MGGeo, increases in response to [CO2(aq)] and temperature. This is opposite to results from the laboratory (Fig. 3). Any change in PIC:POC inferred from ARL of MGEmi coccoliths are well within the range of uncertainty however. Although the uncertainties in these estimates are large, these results are necessarily elusive to laboratory experiments due to the timescales involved.
Phenotypic plasticity, as observed in laboratory experiments to date, cannot explain coccoliths becoming more calcified with increasing [CO2(aq)] and temperature. Based on our down-core observations we infer, therefore, either a component of selection for more heavily calcifying forms, or that the parameter space, and thus phenotypic plasticity, has not been thoroughly explored in the laboratory. Selection may drive evolution of the population internally through differential suitability of forms to the abiotic environment, or through differential susceptibility to grazers or viral attacks30, or via propagation of differentially adapted forms introduced from elsewhere along gradients of nutrients, pH, salinity or temperature. Alternatively the apparent increase in size-normalised coccolith mass, within MGGeo in particular, may be due to a transient increase in the relative abundance of established more highly calcifying pseudo-cryptic sub lineages14,31. The increased mean-independent variance in size-normalised coccolith mass across TII may be the result of selection for different growth strategies, and/or differences in phenotypic plasticity across the population. As a substrate, low CO2 concentrations may limit growth rate32, so increasing its concentration may allow for faster growth; but elevated CO2 at constant alkalinity decreases the saturation state of calcite making it more energetically costly to calcify. Increases in CO2atm also drive increases in temperature. To explain the increased variance over TII by the differential effect of phenotypic plasticity within the population superimposed on a general selection for more highly calcified forms, the more lightly calcifying forms would need to be more susceptible to a decreasing saturation state, but this is not observed in culture. If anything, the relatively heavily calcifying G. oceanica appears to exhibit a greater plastic decrease in size-normalised coccolith mass with increasing [CO2(aq)] than the relatively lightly calcifying E. huxleyi. Alternatively, increasing [CO2(aq)] could conceivably create diverging niches; lightly calcifying forms could be selected on the basis of faster growth on a given CO2 substrate, and highly calcifying forms could be selected on the basis of reduced mortality due to the greater integrity of their calcitic (presumably defensive) structure. Whatever the mechanism, it is interesting to note that the size-normalised coccolith mass of the population is driven to a very narrow range during glacial times (Fig. 2). If this observation does indeed reflect a narrow range of PIC:POC values, it may indicate that it is universally energetically favourable, at low temperature and [CO2(aq)], to maintain a balance between the relative rate of photosynthesis to calcification, thus minimizing the effect of biomass production on intracellular carbonate chemistry (Fig. 4).

Solid line isocontours represent [CO2] (μmol/kg), and dashed isocontours represent pH. Solid arrows represent the instantaneous effect of biogenic matter formation, and shaded arrows CO2 exchange with an atmospheric carbon pool that is large relative to the perturbed sample of seawater. Depending on its ρ, biogenic material may form an instantaneous sink or source of CO2. For conditions typical of the modern ocean, when ρ is <or > 1.42, pH initially increases or decreases respectively, and when ρ is < or > 1.86 [CO2] initially decreases or increases respectively. These critical values depend on the carbonate chemistry of the surface ocean59.
From a biogeochemical viewpoint, calcification and photosynthesis alter the buffering capacity of water for CO2 in opposing ways through their respective effects on [DIC] and [ALK]. These effects are relevant on scales ranging from the sub-cellular environment in coccolithophores to global biogeochemical cycles. In the sub-cellular environment, the ratio of calcification to photosynthesis determines the steady state drift in intracellular pH, that would otherwise occur if it were not counteracted by the active pumping of protons into or out of the cell (Fig. 4). During blooms, coccolithophores constitute an instantaneous net sink or source of CO2, or drive a change in pH, depending on their PIC:POC ratio (Fig. 4). Under typical modern conditions, formation of biomass in the surface ocean with a PIC:POC of higher or lower than ~1.86 constitutes respectively an instantaneous source or sink of CO2 (Fig. 4), with this critical value varying with the carbonate chemistry of the water. This effect is not permanent however; the effect of biomass production on surface ocean seawater chemistry is often transient due to respiration and remineralization of organic matter by grazers, and dissolution of calcite causing cycling within the surface ocean. Carbon fluxes between the atmosphere and ocean are strongly influenced by export of organic matter and calcite from the surface ocean. Export has a prolonged effect on surface ocean/atmosphere partitioning of CO2 because DIC and ALK are sequestered in the deep ocean or sediments, which have residence times of respectively hundreds, and tens of thousands of years. Coccolithophores are responsible for up to half of the calcification in the surface ocean1, with members of the family Noëlaerhabdaceae typically contribute around half 33. It is through their role in pumping calcite to depth that coccolithophores constitute a significant lever on the global climate system.
In the modern ocean, phytoplankton stock is a function of light, nutrients, grazing and viral lysis34. The effect of predators and viruses cannot explain the current distribution of primary production in the surface ocean, which is dominated by nitrate and iron availability35. In coccolithophores, the PIC:POC ratio describes the amount of calcite produced per unit organic matter. As organic matter production is finite and limited by the availability of biologically accessible nitrogen and iron, the PIC:POC ratio directly corresponds to the amount of calcite produced for a given standing stock or flux of ultimately limiting nutrients. In the absence of other changes, an increase in the PIC:POC ratio of coccolithophores in the surface ocean leads to an increase in the ratio of ALK:DIC exported, and thus a decrease in the buffering capacity of the surface ocean for CO2. A confounding effect arises because cells are approximately the same density as water, and must be ballasted by heavy minerals, including calcite, in the form of aggregates or faecal pellets in order to be exported from the surface ocean before being remineralised. In terms of the net effect on seawater carbonate chemistry in the surface ocean, export of calcite may therefore constitute a trade-off between direct removal of calcite, and the effect this has on the rate of export of organic matter36.
In our down core record, coccolithophores belonging to the family Noëlaerhabdaceae appear, on average, to calcify more under increasing [CO2](aq) and temperature. Although it is impossible to decouple the effects of temperature, [CO2(aq)], salinity and nutrient availability down-core, these parameters have varied together throughout geological time. On glacial-interglacial timescales therefore, to first order, the Noëlaerhabdaceae’ may actually constitute a positive feedback to increasing CO2atm on millennial timescales.
We have shown that natural coccolithophore populations appear to adapt to rising [CO2(aq)] and temperature on a millennial timescale, dominantly via selection for an increased tendency to calcify. Thus, this work introduces a temporal dimension to the prevailing view based on the results of culture manipulation experiments. The theoretical model predicting this outcome describes a trade-off between fast growth and calcification11, confounding the implications for the total rate of calcite production in the surface ocean. We anticipate our results to be of use to biogeochemical modellers, but a more thorough understanding of the fate of biogenic material produced in the surface ocean is essential before the full implications of this work are realised.
Methods
Culture experiments
Duplicate monoclonal batch cultures of four strains of coccolithophore belonging to the family Noëlaerhabdaceae were grown in sterile filtered (0.2 μm) artificial seawater prepared according to ESAW37 adapted for a range of DIC concentrations ([DIC] = 1.380 mM, 2.147 mM, 3.067 mM and 6.135 mM) at constant pH (8.2) by varying sodium bicarbonate addition and titration with HCl and with nitrate (442 μM), phosphate (5.00 μM), vitamins, trace metals and EDTA according to K/238. Carbonate chemistry manipulation at constant pH is more analogous to changes expected in the surface ocean on a glacial-interglacial timescale than holding alkalinity constant, due to buffering by carbonate sediments. Cultures were maintained at 15 °C with an incident photon flux of 250 μE and a 12/12 light/dark cycle. Cells were acclimated for >20 generations in dilute batch culture for each experimental condition prior to inoculation. Cells were inoculated in 2.4 l polycarbonate flasks, with no headspace and sealed off to the air with teflon lined caps. Removal of medium during the experiment was unavoidable due to the need to count and measure cells, and resulted in a maximum headspace of 20 cm3 at harvest. In order to minimise the drift in culture conditions throughout the course of the experiment, cells were harvested at ~1–2% (and never greater than 4%) of maximum cell density, which was determined for each experimental condition and strain combination via preliminary experimentation. Strains were AC478 (RCC1211 Gephyrocapsa oceanica from Portuguese coast in Atlantic Ocean), AC472 (RCC1216 Emiliania huxleyi, from Tasman Sea in Pacific Ocean), AC448 (RCC1256 Emiliania huxleyi, Icelandic coast in Atlantic Ocean) and AC279 (RCC1314 Gephyrocapsa oceanica, French coast in Atlantic Ocean) from the Roscoff culture collection (RCC). Particulate material was harvested by dry filtration onto pre-weighed membranes with 0.2 μm pore-size, and rinsed of salt with a minimal amount of deionised water (adjusted to pH 7). Coccolithophore size and concentration were obtained using a Beckman Z2 Coulter Counter (see ref. 39 for description of Coulter principle). Coccosphere and cell size were measured three times each respectively pre- and post-decalcification both morning and evening on the harvest day and the preceding day. Cells were decalcified by reducing the pH of the suspension with HCl addition to 5.0 with for around 20 minutes. The Coulter counter was calibrated to use ESAW + K/2 medium as an electrolyte, and for use with the acidified electrolyte, to accommodate for the difference in ionic strength. Cell division is synchronized under the light/dark cycle and cell size was assumed to increase linearly throughout the day40. By measuring cell and coccosphere size morning and evening, the bias introduced due to the time of day of measurement can be removed by interpolation to the same time of day. This also removes the daily variation in the slope of Eq. 3 which is a function of cell size40 and number of coccoliths per cell. Culture health was monitored by cell counts and microscope inspection on alternate days. Molar PIC and POC were measured with a Rock Eval analyser, which is preferable to making assumptions about carbon density of biogenic material. An aliquot of culture residue was bleached with dilute sodium hyperchlorite solution (4% available chlorine for 20 minutes) to remove the organic matter, and washed three times in deionised water to remove the bleach. The resultant “pseudo-sediment” was subsequently analysed using the computational software, SYRACO20,41,42.
Stable isotope and Mg/Ca measurements on planktonic foraminifera
Paired stable isotope (δ18O and δ13C) and Mg/Ca analyses were performed on typically 60 individual shells of Globigerina inflata (MIS 15-13) and Globigerina bulloides (MIS 7-5), picked from the 300–355 μm size fraction. In Fig. 2, the alternative filled points are temperatures inferred from the 250–300 μ size fraction, which captures the glacial termination more clearly than the larger fraction, but has little effect on [CO2(aq)]. Prior to isotopic analyses, samples were crushed, cleaned in 3% hydrogen peroxide solution to remove any possible organic contaminants, rinsed with acetone and dried overnight in an oven at 60 °C. Measurements of the isotopic composition of carbon dioxide, released from the foraminiferal carbonate using a MULTIPREP system, were performed on a VG SIRA mass spectrometer at the Univ. Cambridge. Calibration to the Vienna Peedee Belemnite standard was through the NBS19 standard43, and the analytical precision was better than 0.08 for δ18O and 0.06 for δ13C. For Mg/Ca measurements, samples were prepared following the cleaning procedure described by Barker et al.44. Analyses were performed on a Varian Vista Pro Inductively Coupled Plasma Optical Emission Spectrometer (ICP-OES) and a Perkin Elmer Elan DRCII quadrupole based Inductively Coupled Plasma - Mass Spectrometer (ICP-MS) at the Univ. Cambridge, following established procedures45,46. Precision for measured Mg/Ca ratios determined from replicate runs of a standard solution containing Mg/Ca = 1.3 mmol/mol was 0.46%. Accuracy of Mg/Ca determinations was confirmed by interlaboratory studies of foraminifera and carbonate reference materials47,48.
Analytical methods
Proxy-derivation regressions are y-on-x ordinary least squares regressions on the mean of a fitted gaussian on log-transformed data. An ordinary least squares regression was chosen because the uncertainty in the y-axis variable far exceeds that of the x-axis variable. These histograms are given in the Supplementary material. Volume-predicted PIC:POC has a highly significant relationship with measured PIC:POC (p < 0.001, F-statistic = 123 on 1 and 28 DF), and an excellent linear fit ( = 0.81). The coccolith aspect ratio (AR = coccolith thickness/√coccolith area) is also a highly significant predictor of PIC:POC (p < 0.001, F-statistic = 79 on 1 and 30 DF) and a good linear fit (
 = 0.71).
Down-core
ODP site 1123 (Expedition 181) is located on Chatham rise, east of New Zealand in the southernmost Pacific (41°47.2′S, 171°29.9′W, 3290 m water depth. The sediment age model for side ODP site 1123 is based on a correlation with the orbitally tuned benthic oxygen isotope stack of LR0449,50. Reconstructed sea surface temperature (SST) estimates are based on Mg/Ca ratios of planktic forams using species-specific published calibrations. Temperatures across the MIS 7-5 interval were inferred from the G.bulloides 250–300 μm and 300–355 μm size fractions using the equation: Mg/Ca = 0.47 exp 1.08T, and those across MIS 15-13 using the equation: Mg/Ca = 0.299 exp 0.090T51. [CO2(aq)] is estimated from global CO2 mixing ratios of an assumed well mixed atmosphere from Vostok and Dome C Antarctic ice cores (Fig. S2; compiled by52), using the seacarb package in R53, with dissolution assumed to be controlled only by SST at a constant salinity of 35. EDC3 gas age was converted to LR04 using a published conversion54. Carbon isotopic composition of planktic forams were used as a rough proxy for relative nutrient (~ phosphate) availability corrected for the effect of temperature, using the relationships of 55. See Fig. S3 for time series. Smear slides were prepared using a trial and error approach to attain the optimum coccolith density. SYRACO analysis was carried out in CEREGE.
SYRACO
In SYRACO analysis, all objects present in the field of view are individually segmented (coccoliths and debris). Secondly the outline of segmented coccoliths is optimized for morphometric measurements. The threshold is computed as the average between the mode of the pixels values (corresponding to the dark background) and the mean of the same segmented image. This threshold value is reproducible and works with very different taxa (F. profunda, E. huxleyi and U. sibogae to a Sphenolithus and Chiasmolithus etc.). For all images, thresholds and parameters are measured the same way. The area corresponds to the number of the isolated pixels (minus the central are if it exists) multiplied by the scale (area of 1 pixel = 0.0036 μm2). The mass and the thickness is measured according to a published protocol20.
Effect of PIC:POC on carbonate chemistry
Photosynthesis (net photosynthesis = photosynthesis - respiration) removes one mole of DIC from surface ocean seawater and adds 15/106 moles of alkalinity56) for each mole of POC produced. Calcification removes 1 mole of DIC and 2 moles of alkalinity for each mole of PIC produced. [TA] relative to [DIC] dictates the buffering capacity of the surface ocean for CO2. [CO2] and pH were calculated across DIC and TA values at salinity = 35, temperature = 25 °C, assuming zero concentration of phosphate and silicate and zero hydrostatic pressure, and published values for the first and second dissociation constants of carbonic acid57.
Additional Information
How to cite this article: McClelland, H. L. O. et al. Calcification response of a key phytoplankton family to millennial-scale environmental change. Sci. Rep. 6, 34263; doi: 10.1038/srep34263 (2016).
References
Milliman, J. Production and accumulation of calcium carbonate in the ocean: budget of a nonsteady state. Global Biogeochemical Cycles 7, 927–957 (1993).
Bown, P. R. (ed.) Calcareous nannofossil biostratigraphy, Chapman & Hall, Cambridge (1998).
Rost, B. & Riebesell, U. Coccolithophores and the biological pump: responses to environmental changes. In Theirstein, H. & Young, J. (eds) Coccolithophores: From molecular processes to global impacts, 99–124 Springer (2004).
Boyd, P. W. & Doney, S. C. The Impact of Climate Change and Feedback Processes on the Ocean Carbon Cycle. In Fasham, M. J. (ed.) Ocean Biogeochemistry, chap. The Impact, 157–193 Springer (2003).
Riebesell, U. et al. Reduced calcification of marine plankton in response to increased atmospheric CO2 . Nature 407, 2–5 (2000).
Zondervan, I., Zeebe, R., Rost, B. & Riebesell, U. Decreasing marine biogenic calcification: A negative feedback. Global Biogeochemical Cycles 15, 507–516 (2001).
Sett, S. et al. Temperature Modulates Coccolithophorid Sensitivity of Growth, Photosynthesis and Calcification to Increasing Seawater pCO2 . PloS one 9, e88308 (2014).
Bach, L. T., Riebesell, U., Gutowska, M. a., Federwisch, L. & Schulz, K. G. A unifying concept of coccolithophore sensitivity to changing carbonate chemistry embedded in an ecological framework. Progress in Oceanography 135, 125–138 (2015).
Bendif, E. M. et al. Genetic delineation between and within the widespread coccolithophore morpho-species Emiliania huxleyi and Gephyrocapsa oceanica (Haptophyta). Journal of Phycology 50, 140–148 (2014).
von Dassow P, J. U. et al. Life-cycle modification in open oceans accounts for genome variability in a cosmopolitan phytoplankton. ISME 9, 1365–1377 (2015).
Irie, T., Bessho, K., Findlay, H. S. & Calosi, P. Increasing costs due to ocean acidification drives phytoplankton to be more heavily calcified: optimal growth strategy of coccolithophores. PloS one 5, e13436 (2010).
Schlüter, L. et al. Adaptation of a globally important coccolithophore to ocean warming and acidification. Nature Climate Change 4, 1024–1030 (2014).
Lohbeck, K. T., Riebesell, U. & Reusch, T. B. H. Adaptive evolution of a key phytoplankton species to ocean acidification. Nature Geoscience 5, 346–351 (2012).
Beaufort, L. et al. Sensitivity of coccolithophores to carbonate chemistry and ocean acidification. Nature 476, 80–83 (2011).
Horigome, M. T. et al. Environmental controls on the Emiliania huxleyi calcite mass. Biogeosciences 11, 2295–2308 (2014).
Iglesias-Rodriguez, M. D. et al. Phytoplankton calcification in a high-CO2 world. Science 320, 336–40 (2008).
Halloran, P. R., Hall, I. R., Colmenero-Hidalgo, E. & Rickaby, R. E. M. Evidence for a multi-species coccolith volume change over the past two centuries: understanding a potential ocean acidification response. Biogeosciences 5, 1651–1655 (2008).
Meier, K., Berger, C. & Kinkel, H. Increasing coccolith calcification during CO2 rise of the penultimate deglaciation (Termination II). Marine Micropaleontology 112, 1–12 (2014).
Meier, K. J. S., Beaufort, L., Heussner, S. & Ziveri, P. The role of ocean acidification in Emiliania huxleyi coccolith thinning in the Mediterranean Sea. Biogeosciences 11, 2857–2869 (2014).
Beaufort, L., Barbarin, N. & Gally, Y. Optical measurements to determine the thickness of calcite crystals and the mass of thin carbonate particles such as coccoliths. Nature protocols 9, 633–42 (2014).
Henderiks, J. Coccolithophore size rules - Reconstructing ancient cell geometry and cellular calcite quota from fossil coccoliths. Marine Micropaleontology 67, 143–154 (2008).
Crundwell, M., Scott, G., Naish, T. & Carter, L. Glacial?interglacial ocean climate variability from planktonic foraminifera during the Mid-Pleistocene transition in the temperate Southwest Pacific, ODP Site 1123. Palaeogeography, Palaeoclimatology, Palaeoecology 260, 202–229 (2008).
Young, N. In Bown, P. R. (ed.) Calcareous Nannofossil Biostratigraphy, 225–265 Springer (1998).
Rickaby, R. E. M., Henderiks, J. & Young, J. N. Perturbing phytoplankton: response and isotopic fractionation with changing carbonate chemistry in two coccolithophore species. Climate of the Past 6, 771–785 (2010).
Müller, M. N., Schulz, K. G. & Riebesell, U. Effects of long-term high CO2 exposure on two species of coccolithophores. Biogeosciences 7, 1109–1116 (2010).
Bach, L. T., Riebesell, U. & Georg Schulz, K. Distinguishing between the effects of ocean acidification and ocean carbonation in the coccolithophore Emiliania huxleyi. Limnology and Oceanography 56, 2040–2050 (2011).
McClelland, H., Taylor, P., O’Dea, A. & Okamura, B. Revising and refining the bryozoan zs-MART seasonality proxy. Palaeogeography, Palaeoclimatology, Palaeoecology 410, 412–420 (2014).
O’Dea, S. a. et al. Coccolithophore calcification response to past ocean acidification and climate change. Nature communications 5, 53–63 (2014).
Gibbs, S. J. et al. Species-specific growth response of coccolithophores to Palaeocene-Eocene environmental change. Nature Geoscience 6, 1–5 (2013).
Raven, J. & Crawfurd, K. Environmental controls on coccolithophore calcification. Marine Ecology Progress Series 470, 137–166 (2012).
de Vargas, C., Sáez, A., Medlin, L. & Thierstein, H. Super-species in the calcareous plankton. In Coccolithophores: From molecular processes to global impacts 271–298 Springer, (2004).
Riebesell, U., Wolf-Gladrow, D. A. & Smetacek, V. Carbon dioxide limitation of marine phytoplankton growth rates. Nature 361, 249–251 (1993).
Ziveri, P., de Bernardi, B., Baumann, K.-H., Stoll, H. M. & Mortyn, P. G. Sinking of coccolith carbonate and potential contribution to organic carbon ballasting in the deep ocean. Deep Sea Research Part II: Topical Studies in Oceanography 54, 659–675 (2007).
Sarmiento, J. & Gruber, N. Ocean biogeochemical dynamics Princeton University Press, (2013).
Moore, C. M. et al. Processes and patterns of oceanic nutrient limitation. Nature Geoscience 6, 701–710 (2013).
Loubere, P., Siedlecki, S. a. & Bradtmiller, L. I. Organic carbon and carbonate fluxes: Links to climate change. Deep Sea Research Part II: Topical Studies in Oceanography 54, 437–446 (2007).
Berges, J. a., Franklin, D. J. & Harrison, P. J. Evolution of an Artificial Seawater Medium: Improvements in Enriched Seawater, Artificial Water Over the Last Two Decades. Journal of Phycology 37, 1138–1145 (2001).
Keller, M., Selvin, R., Claus, W. & Guillard, R. R. L. Media for the culture of oceanic ultraphytoplankton. Journal of Phycology 23, 633–638 (1987).
Beckmann Coulter. The Coulter Principle. www.beckman.com (Date of access: 10/03/2014) (2013).
Müller, M., Antia, A. & LaRoche, J. Influence of cell cycle phase on calcification in the coccolithophore Emiliania huxleyi. Limnology and Oceanography 53, 506–512 (2008).
Beaufort, L. & Dollfus, D. Automatic recognition of coccoliths by dynamical neural networks. Marine Micropaleontology 51, 57–73 (2004).
Beaufort, L. Weight estimates of coccoliths using the optical properties (birefringence) of calcite. Micropaleontology 51, 289–297 (2005).
Coplen, T. Reporting of stable hydrogen, carbon, and oxygen isotopic abundances. Geothermics 66, 273–276 (1995).
Barker, S., Greaves, M. & Elderfield, H. A study of cleaning procedures used for foraminiferal Mg/Ca paleothermometry. Geochemistry, Geophysics, Geosystems 4 (2003).
de Villiers, S., Greaves, M. J. & Elderfield, H. An intensity ratio calibration method for the accurate determination of Mg/Ca and Sr/Ca of marine carbonates by ICP-AES. Geochemistry, Geophysics, Geosystems 4, 10.1029/2003GC000559 (2003).
Yu, J. & Day, J. Determination of multiple element/calcium ratios in foraminiferal calcite by quadrupole ICP-MS. Geochemistry, Geophysics, Geosystems 6, 10.1029/2005GC000964 (2005).
Greaves, M. & Caillon, N. Interlaboratory comparison study of calibration standards for foraminiferal Mg/Ca thermometry. Geochemistry, Geophysics, Geosystems 9, 10.1029/2008GC001974 (2008).
Rosenthal, Y. et al. Interlaboratory comparison study of Mg/Ca and Sr/Ca measurements in planktonic foraminifera for paleoceanographic research. Geochemistry, Geophysics, Geosystems 5, 10.1029/2003GCD00650 (2004).
Elderfield, H., Ferretti, P. & Greaves, M. Evolution of Ocean Temperature and Ice Volume Through the Mid-Pleistocene Climate Transition. Science 704, 704–709 (2012).
Lisiecki, L. E. A Pliocene-Pleistocene stack of 57 globally distributed benthic δ 18 O records. Paleoceanography 20, 1–17 (2005).
Anand, P., Elderfield, H. & Conte, M. Calibration of Mg/Ca thermometry in planktonic foraminifera from a sediment trap time series. Paleoceanography 28, 1–15 (2003).
Lüthi, D. et al. High-resolution carbon dioxide concentration record 650,000–800,000 years before present. Nature 453, 379–82 (2008).
Lavigne, H., Epitalon, J.-M. & Gattuso, J. Seacarb: seawater carbonate chemistry with R. R package version 3.0. URL http://cran.r-project.org/package=seacarb (2011).
Parrenin, F. et al. Of the Past The EDC3 chronology for the EPICA Dome C ice core 485–497 (2007).
Lynch-Stieglitz, J., Stocker, T. F., Fairbanks, R. G. & Broecker Wallace, S. The influence of air-sea exchange on the isotopic composition of oceanic carbon: Observations and modeling. Global Biogeochemical Cycles 9, 653–665 (1995).
Zeebe, R. & Wolf-Gladrow, D. CO2 in Seawater: Equilibrium, Kinetics, Isotopes (Elsevier, 2001).
Lueker, T. J., Dickson, A. G. & Keeling, C. D. Ocean pCO2 calculated from dissolved inorganic carbon, alkalinity, and equations for K1 and K2: validation based on laboratory measurements of CO2 in gas and seawater at equilibrium. Marine Chemistry 70, 105–119 (2000).
Wessel, P. & Smith, W. H. F. GMT 5.2.1. URL http://gmt.soest.hawaii.edu/ (2013).
Frankignoulle, M., Canon, C. & Gattuso, J. Marine calcification as a source of carbon dioxide: Positive feedback of increasing atmospheric CO2 . Limnology and Oceanography 458–462 (1994).
Acknowledgements
This study was conducted at the University of Oxford (UK) with laboratory work at CEREGE (France). HLOM was funded by PhD studentship NE/I019522/1 in association with UKOARP. REMR acknowledges NERC grant NE/H017119/1 and ERC grant SP2-GA-2008-200915. LB is grateful for financial support from EU Seventh Framework program Past4Future and from the Agence Nationale de la Recherche under project ANR-12-B06-0007 (CALHIS). PF was funded by Marie-Curie Reintegration grant (PERG-GA-2010-272134 - MILLEVARIABILI), funded by the EU PNRA 2013/AZ2.06 and GEOSMART, funded by the Italian National Antarctic Research Programme. We thank Marius Müller for advice on experimental design, Yves Gally for running the SYRACO software, William Hutchison for help with GMT, Jean-Charles Mazur for laboratory assistance, and to Ian Probert for providing strains. Useful comments on the manuscript were provided by El Mahdi Bendif and Jeremy S. Hoffman.
Author information
Authors and Affiliations
Contributions
H.L.O.M. conceived and executed the study; H.L.O.M. and M.H. designed the culture experiments; P.F. and M.G. collected the foram trace metal and isotope data from ODP site 1123; L.B. and N.B. aided with implementation of the SYRACO software. H.L.O.M. wrote the paper in discussion with REMR; L.B. and M.H. provided interpretative input and critical review of the manuscript.
Corresponding author
Ethics declarations
Competing interests
The authors declare no competing financial interests.
Rights and permissions
This work is licensed under a Creative Commons Attribution 4.0 International License. The images or other third party material in this article are included in the article’s Creative Commons license, unless indicated otherwise in the credit line; if the material is not included under the Creative Commons license, users will need to obtain permission from the license holder to reproduce the material. To view a copy of this license, visit http://creativecommons.org/licenses/by/4.0/
About this article

Cite this article
McClelland, H., Barbarin, N., Beaufort, L. et al. Calcification response of a key phytoplankton family to millennial-scale environmental change. Sci Rep 6, 34263 (2016). https://doi.org/10.1038/srep34263
Received:
Accepted:
Published:
DOI: https://doi.org/10.1038/srep34263
This article is cited by
-
Eocene emergence of highly calcifying coccolithophores despite declining atmospheric CO2
Nature Geoscience (2022)
-
Cycling carbon with coccolithophores
Nature Geoscience (2022)
-
Marine Os isotopic evidence for multiple volcanic episodes during Cretaceous Oceanic Anoxic Event 1b
Scientific Reports (2020)
-
A new method for isolating and analysing coccospheres within sediment
Scientific Reports (2020)
-
Enhanced ocean-atmosphere carbon partitioning via the carbonate counter pump during the last deglacial
Nature Communications (2018)
Comments
By submitting a comment you agree to abide by our Terms and Community Guidelines. If you find something abusive or that does not comply with our terms or guidelines please flag it as inappropriate.
