
Abstract
Leprosy is a debilitating, infectious disease caused by Mycobacterium leprae. Despite the availability of multidrug therapy, transmission is unremitting. Thus, early identification of M. leprae infection is essential to reduce transmission. The immune response to M. leprae is determined by host genetics, resulting in paucibacillary (PB) and multibacillary (MB) leprosy associated with dominant cellular or humoral immunity, respectively. This spectral pathology of leprosy compels detection of immunity to M. leprae to be based on multiple, diverse biomarkers. In this study we have applied quantitative user friendly lateral flow assays (LFAs) for four immune markers (anti-PGL-I antibodies, IL-10, CCL4 and IP-10) for whole blood samples from a longitudinal BCG vaccination field-trial in Bangladesh. Different biomarker profiles, in contrast to single markers, distinguished M. leprae infected from non-infected test groups, patients from household contacts (HHC) and endemic controls (EC), or MB from PB patients. The test protocol presented in this study merging detection of innate, adaptive cellular as well as humoral immunity, thus provides a convenient tool to measure specific biomarker profiles for M. leprae infection and leprosy utilizing a field-friendly technology.
Introduction
Leprosy, a chronic infectious disease caused by Mycobacterium leprae (M. leprae) ranking second as the most pathogenic mycobacterial infectious disease after tuberculosis (TB), is still considered a major threat in developing countries1. The condition is characterized by skin lesions and damage to peripheral nerves, the hallmark of leprosy pathology often resulting in severe, life-long disabilities and associated stigma2,3.
Despite the remarkable decrease in prevalence following introduction of multidrug therapy, it remains challenging to further reduce transmission as substantiated by the stable global annual incidence around 200,000 new cases for the past 10 years4. This continued transmission is largely due to M. leprae infected individuals lacking clinical symptoms5. In addition, identification of host-derived biomarkers for progression to disease is complicated by the low incidence and long incubation time requiring extensive, longitudinal studies. Furthermore, although molecular techniques to elicit strain differences within the leprosy bacillus are important diagnostic tools to enhance our understanding of the epidemiology of leprosy, differentiate between relapse and re-infection6,7,8,9,10, these pathogen-derived profiles are not suitable to indicate development of leprosy in infected, asymptomatic individuals.
These hurdles contributed to the current lack of tests for detection of asymptomatic M. leprae infection and diagnosis of early stage leprosy11. As clinical resistance to commonly used antibiotics in leprosy treatment is increasingly occurring12,13, such tests should be highly specific to prevent redundant use of antibiotics.
Clinical manifestations closely parallel cellular immunity to M. leprae such that leprosy presents as a characteristic spectrum ranging from tuberculoid (TT) or paucibacillary (PB) leprosy to lepromatous (LL) or multibacillary (MB) leprosy14. TT patients in general show strong T helper 1 cell (Th1) immunity with exacerbated levels of pro-inflammatory cytokines and develop localized granulomatous disease with bacilli scarcely detectable in their lesions. At the opposite pole of the spectrum are LL patients who predominantly generate Th2 and anti-inflammatory cytokines such as interleukin-10 (IL-10) resulting in disseminating, progressive infections15. In between these two opposite poles of the leprosy spectrum, borderline states of leprosy [borderline tuberculoid (BT), borderline (BB) and borderline lepromatous (BL)] are positioned. Due to the diverse disease spectrum, detection of M. leprae infection in diagnostic tests requires multiple, diverse biomarkers specific for both cellular and humoral mediated immunity. In previous studies we have shown that IFN-γ-inducible protein 10 (IP-10) in response to a M. leprae-specific antigen (ML2478) correlates with M. leprae exposure and thereby the risk of infection and its subsequent transmission16. Additionally, we demonstrated that chemokine (C-C motif) ligand 4 (CCL4), a component of the innate immunity, can be used to identify pathogenic immunity against M. leprae since it was increased in patients, partly in household contacts but not in endemic controls16. IL-10, on the other hand, is associated with suppression of Th1 cells in leprosy17,18,19. Moreover, most lepromatous patients with high bacillary loads produce antibodies against the M. leprae specific phenolic glycolipid I (PGL-I)20,21, which are hardly detected in PB22. Hence, sensitive tests that can simultaneously quantitate multiple analytes in one sample provide apt tools to characterize different clinical leprosy types. In particular, tests based on multicomponent host biomarker profiles that can identify M. leprae infected individuals (yet) without clinical symptoms of leprosy, will be useful for guidance of prophylactic treatment, thereby contributing to reduction of M. leprae transmission as well as prevention of disabilities.
Inherent to the situation in leprosy endemic areas is the absence of sophisticated laboratories. It is therefore imperative that new diagnostic tests are facilitated for application in the field. Up-converting phoshor lateral flow assays (UCP-LFAs) have previously shown to be robust, low-complexity assays, representing a field-friendly alternative for common laboratory-based ELISAs23,24, applicable for detection of multiple pathogens including food-borne pathogenic strains and potential biowarfare/bioterrorism agents25,26,27. Field evaluation of UCP-LFAs for detection of IL-10, IP-10, CCL4 and anti-PGL-I IgM demonstrated high correlation with ELISAs using samples from cohorts of limited numbers of leprosy- or TB patients28,29.
In the current study UCP-LFAs were applied to a more extensive (five-fold) sample size compared to our previous studies, derived from a randomized BCG vaccination field trial in Bangladesh30. Six test groups were included: MB patients, PB patients, healthy household contacts (HHC), HHC vaccinated with Bacillus Calmette-Guérin (BCG) (HHC&BCG), HHC who developed leprosy after BCG vaccination (new cases; NC) and endemic controls (EC) from the same area without known contact with leprosy patients. This extended cohort study allowed exploratory identification of biomarker profiles for M. leprae infection, leprosy disease per se, the type of leprosy and BCG vaccination as determined with UCP-LFAs for the above indicated targets.
Results
Performance of the UCP-LFA versus ELISA
Whole blood samples (n = 726) from all individuals were analysed using ELISA, as well as the field-friendly UCP-LFAs for IL-10, IP-10, CCL4 and anti-PGL-I antibodies. Comparison of UCP-LFA and ELISA results demonstrated significant correlation for all four biomarkers (p < 0.0001), confirming earlier observations28,29.
The diagnostic performance of the UCP-LFA in comparison to ELISA was further assessed through AUCs for the two most distinct phenotypes: MB patients (n = 34) and EC (n = 51). IL-10, IP-10 and CCL4 levels were determined in Nil, WCS and Mlep samples, as well as anti-PGL-I IgM levels (Fig. 1). The IL-10 and IP-10 UCP-LFAs outperformed the corresponding ELISAs, whereas the CCL4 and anti-PGL-I IgM tests performed equally. For discrimination of MB patients from EC, the proposed diagnostic field-tool UCP-LFA provides an equally well or even better alternative for the conventional ELISAs.

Discriminatory capacity of ELISA and UCP-LFA.
To compare the ability of ELISA (dotted line) and UCP-LFA (solid line) to discriminate between individuals with or without disease ROC curves were computed using data of MB patients and EC. Areas under the curve (AUCs) were compared for all 10 conditions tested, shown in the lower right corner of each graph. (a) ROC curves for IP-10 stimulated and unstimulated samples based on concentration in pg/ml, showing an improved AUC for the UCP-LFA for IP-10Nil and IP-10WCS. (b) ROC curves for IL-10 stimulated and unstimulated samples based on concentration in pg/ml, showing an improved (IL-10Nil) or equal AUC for UCP-LFA. (c) ROC curves for CCL4 stimulated and unstimulated samples based on concentration in pg/ml, showing comparable values for UCP-LFA and ELISA. (d) ROC curves for anti-PGL-I IgM in unstimulated samples based on ratio, showing comparable AUCs for ELISA and UCP-LFA.
M. leprae specific responses based on single analyte UCP-LFA measurements
In order to put the quantitative test results obtained with the four single UCP-LFAs in the context of their biomarker potential, we assessed each analyte/stimulus combination by comparing median group levels. As indicated by the AUCs in Fig. 1, MB patients can be distinguished from EC based on IP-10 and CCL4 (irrespective of stimulus), anti-PGL-I IgM and IL-10WCS, therefore also showing significantly different median levels (Fig. 2, Table 1). Moreover, median levels of anti-PGL-I IgM and IP-10Nil differed between MB patients and (BCG-vaccinated) HHC, whereas median levels of IP-10WCS and CCL4WCS only distinguished the non-vaccinated HHC from MB patients. BCG vaccination therefore affects the immune response in HHC, as reflected by the significant difference in IP-10WCS levels between HHC and HHC&BCG (p = 0.018) (Fig. 2b). Furthermore, IL-10WCS levels differed between HHC and EC, while median levels of IP-10WCS and CCL4WCS differed between HHC&BCG and EC as well. PB patients and EC showed significantly different median CCL4Nil and CCL4WCS levels (Fig. 2c), as well as borderline significant different levels for IL-10WCS (p = 0.07) and IP-10WCS (p = 0.06).

Identification of M. leprae specific IL-10, IP-10, CCL4 and anti-PGL-I IgM antibodies by UCP-LFA.
(a) IL-10 concentrations (pg/ml) measured per group per stimulus show that MB patients, HHC and BCG-vaccinated HHC significantly differ from EC upon WCS stimulation. (b) IP-10 concentrations (pg/ml) measured per group per stimulus show that MB patients significantly differ from EC in both stimulated and unstimulated samples, from HHC in unstimulated and WCS stimulated samples and from BCG vaccinated HHC in unstimulated samples. BCG vaccinated HHC significantly differ from HHC and EC upon WCS stimulation. (c) CCL4 concentrations (pg/ml) measured per group, per stimulus show that MB patients significantly differ from EC in both stimulated and unstimulated samples and from HHC in WCS stimulated samples. PB patients significantly differ from EC in unstimulated and WCS stimulated samples and BCG vaccinated HHC significantly differ from EC in WCS stimulated samples. (d) anti-PGL-I IgM ratio measured per groups shows that MB patients have significantly higher levels of anti-PGL-I IgM compared to HHC, BCG vaccinated HHC and EC. P-values: *p ≤ 0.05, **p ≤ 0.01, ***p ≤ 0.001, ****p ≤ 0.0001.
The ability of each analyte/stimulus combination to distinguish between two groups is summarized in Table 1, thereby reviewing the biomarker potential of the four individual host immune markers. Remarkably, the levels of IP-10 (p < 0, 0001), IL-10 (p = 0.003) and CCL4 (p < 0.0001) in WCS stimulated samples were more significantly different for MB and EC than anti-PGL-I IgM levels (p = 0.0042). Moreover, anti-PGL-I IgM levels could not be used to discriminate PB patients or (BCG-vaccinated) HHC from EC, which clearly demonstrates the added value of IP-10, IL-10 and CCL4 in leprosy diagnostics.
Biomarker signatures to specify M. leprae infection, leprosy or disease classification
Diagnostic tests that allow detection of M. leprae infection, leprosy per se and leprosy classification would be of great benefit to the general healthcare in leprosy endemic areas. The four host immune markers allowed distinction between two groups (Table 1). However, to distinguish M. leprae infected from non-infected individuals or patients from healthy contacts, we compared host immune markers for multiple groups (Fig. 3).

Positive test results per analyte/stimulus combination used to construct potential biomarker profiles.
The groups that should be differentiated to indicate M. leprae infection, disease per se and disease classification are shown. The potential profiles indicated are based on the percentage of positive individuals of these particular groups. The cut-off for positivity was based on values for NEC (Supplementary Table S3) per analyte/stimulus combination the percentage of individuals with a positive test result per group is shown. Based on these data the optimal analyte/stimulus combination to differentiate either infected from non-infected groups, patients and non-patients groups or MB and PB patients were selected to construct the potential profiles described.
First, in order to combine immune markers into multicomponent host biomarker profiles, positive UCP-LFA results for each analyte/stimulus combination were collectively specified (Fig. 3; Supplementary Table S3). Second, analyte/stimulus combinations were selected such that they optimally distinguished individuals with a specified disease- or infection state (Fig. 3), considering all HHC as M. leprae infected. This resulted in three specific profiles:
-
I
To indicate M. leprae infection we selected single test results obtained with IP-10Mlep, CCL4WCS and IL-10WCS UCP-LFAs as these analyte/stimulus combinations individually showed the least positive test results for EC compared to the M. leprae infected test groups (MB, PB, HHC and HHC&BCG) (Fig. 3). The combination of IP-10Mlep, CCL4WCS and IL-10WCS indeed was more frequently positive for MB/PB patients and (BCG-vaccinated) HHC than EC (Fig. 4a). Moreover, AUCs confirmed discrimination between non-infected and M. leprae infected test groups based on this multicomponent host immune profile (AUCs: 0.84 (MB vs. EC), 0.75 (PB vs. EC), 0.7 (HHC vs. EC) and 0.71 (HHC&BCG vs. EC) (Supplementary Table S4A).
Figure 4 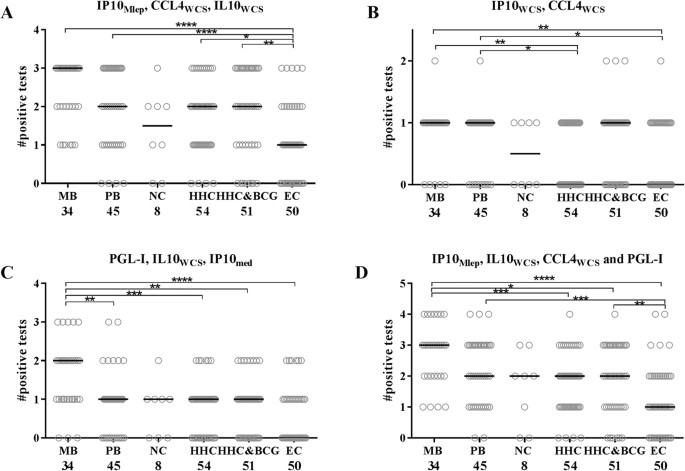
Potential of biomarker profiles to indicate M. leprae infection, disease per se and disease classification.
The amount of positive test results per group is shown. (a) IP-10Mlep, CCL4WCS and IL-10WCS significantly differed in MB/PB patients and (BCG-vaccinated) HHC from EC, showing more positive test results in the groups that are exposed to M. leprae and thereby indicating M. leprae infection. (b) CCL4WCS and IP-10WCS enabled the distinction between patients and HHC, thereby indicating the pathogenic immune responses to M. leprae in patients. (c) Anti-PGL-I IgM, IL-10WCS and IP-10Nil showed more positive test results in MB patients thereby enabling the distinction between MB and PB patients. (d) A four marker profile of IL-10WCS, IP-10Mlep, CCL4WCS and anti-PGL-I IgM shows the majority of significant differences observed in A, B and C. P-values: *p ≤ 0.05, **p ≤ 0.01, ***p ≤ 0.001, ****p ≤ 0.0001.
-
II
To detect leprosy patients from healthy, though possibly M. leprae infected individuals, CCL4WCS and IP-10WCS were selected as immune markers since these single tests were more frequently positive in patients (MB and PB) compared to contacts (HCC and HCC&BCG) and are therefore associated with pathogenic immunity to M. leprae. The combination of CCL4WCS and IP-10WCS indeed demonstrated a positive test result more often in patients than in HHC or EC (Fig. 4b), whereas the related AUCs were ≥0,66 thus confirming leprosy disease-specificity (Supplementary Table S4B).
-
III
For classification of leprosy a signature consisting of anti-PGL-I IgM, IL-10WCS and IP-10Nil was applied, as each of these markers individually showed more positive test results in MB patients compared to PB patients (Fig. 3). This profile proved to be specific for MB patients (Fig. 4c) and thereby allowed the differentiation of MB and PB patients (AUC = 0.73, Supplementary Table S4C).

Ideally only one multicomponent host biomarker profile for diagnosis of M. leprae infection, leprosy per se and leprosy classification would be more suitable for field-use. In this exploratory study, a 4 marker profile of IL-10WCS, IP-10Mlep, CCL4WCS and anti-PGL-I IgM was selected for this purpose, enabling distinction of infected and non-infected individuals by IL-10WCS, IP-10Mlep and CCL4WCS, MB and PB patients from HHC and EC by CCL4WCS and MB from PB patients by anti-PGL-I IgM and IL-10WCS (Fig. 4d; Supplementary Table S4D). However, to distinguish MB from PB patients or PB patients from HHC profile III for leprosy classification showed a higher AUC compared to the 4 marker profile (0.73 vs. 0.65 and 0.66 vs. 0.62 respectively, Supplementary Table S4). These data indicate the importance of distinct phase-specific profiles, the application of which will depend on the nature of the diagnosis to be made.
Nonetheless, application of the 4 marker profile demonstrated the influence of multicomponent host biomarker profiles on test accuracy, showing increased AUCs compared to individual markers (Supplementary Figure S1). The added value of using various analytes indicates the potential of multicomponent host biomarker profiles for leprosy diagnostics to detect M. leprae infection, leprosy disease or disease classification.
Discussion
The obvious incessant transmission of M. leprae has brought about increased focus in leprosy research on discovery of biomarkers to improve diagnosis. Nevertheless, thus far only few biomarkers for leprosy are recommended by expert panels11. Consequently, there is a growing need for new and sensitive diagnostic tools based on specific biomarkers which should, ideally, allow straightforward translation into field-friendly tests.
In this exploratory study, we aimed to provide several multicomponent host immune-biomarker profiles which distinguish between distinct stages of M. leprae infection. In this process we also emphasized the challenges that need to be tackled to allow application of these biomarkers in the field. As high-tech laboratories are often lacking in leprosy endemic areas, we examined the diagnostic potential of earlier developed field-friendly UCP-LFAs for detection of anti-PGL-I IgM antibodies and cyto/chemokines IP-10, IL-10 and CCL424,28,31, in an extensive cohort in Bangladesh.
We demonstrated the biomarker potential of IP-10, IL-10, CCL4 and anti-PGL-I IgM measured by UCP-LFAs in whole blood, either in response to M. leprae specific stimuli or without stimulus. Moreover, multicomponent host biomarker profiles including selected analyte/stimulus combinations could indicate M. leprae infection, leprosy per se or be used for classification of leprosy subtypes. A biomarker profile of IP-10Mlep, CCL4WCS and IL-10WCS was highly indicative of M. leprae infection, consistent with our previous finding that the IP-10 response to M. leprae specific proteins indicates exposure to M. leprae16,32.
Leprosy per se, on the other hand, was indicated by CCL4WCS and IP-10 WCS, showing the potential to identify pathogenic immunity against M. leprae and confirming earlier observations on CCL416. As current diagnostic assays for leprosy are antibody-based and only facilitate the diagnosis of MB cases33,34,35, inclusion of the host immune markers CCL4 and IP-10 in the profile shows promise for diagnosis of PB patients and indicates the importance of measuring cellular markers simultaneously with humoral markers.
For leprosy classification, the combination of anti-PGL-I IgM, IL-10WCS and IP-10Nil was indicative for MB patients, enabling the distinction between MB and PB patients. Although IL-10 and particularly anti-PGL-I IgM have been identified as characteristic markers for MB leprosy36,37, we also identified IP-10 as a, seemingly counterintuitive, host immune marker for patients at this side of the spectrum who usually display decreased pro-inflammatory immunity. However, since T-cells are not the exclusive source of IP-1038, IP-10 may still be produced in MB patients by monocytes and neutrophils39, as described for HIV-infected TB patients40.
To detect M. leprae infection, leprosy per se, as well as leprosy classification simultaneously with only one biomarker profile, IL-10WCS, IP-10Mlep, CCL4WCS and anti-PGL-I IgM demonstrated the most optimal 4 marker profile performance. However, it performed less optimal for the distinct stages of M. leprae infection than the phase-specific profiles. Other cyto-/chemokines to identify pathogenic immunity to M. leprae (e.g. MCP-1 and IL-1β16), leprosy classification (e.g. CCL17 and CCL1841) or general mycobacterial infection (EN-RAGE42,43) could therefore be included to achieve more optimal diagnostic accuracy44 as distinct phase-specific profiles. In a multiplex UCP-LFA format multicomponent host immune biomarker profiles can be measured in one single test. This format therefore provides a field-friendly diagnostic tool, facilitating the diagnosis of leprosy based on biomarker signatures.
Of note is the observation that CCL4 levels in response to M. leprae WCS were elevated for HHC who received BCG vaccination compared to those who did not. Thus, BCG vaccination may also cause increased pro-inflammatory immune responses which renders contacts more prone to development of over-reactive, pathogenic immunity to M. leprae. Indeed, in a recent vaccination study an unexpectedly high proportion of HHC presented with PB leprosy after BCG vaccination supporting this idea45. In this respect, this vaccination study also shows the importance of immunomonitoring individuals at high risk to identify and treat patients at an early stage. In addition, since BCG vaccination or boost is a well-accepted prophylaxis against leprosy in contacts of newly diagnosed patients46, it is relevant to distinguish BCG-induced immunity in healthy contacts from early stage leprosy in these individuals. To efficiently monitor contacts for this purpose, the different stages of infection and disease of leprosy should be covered in diagnostics tools. Through simultaneous measurement of all analytes of interest on a single lateral flow strip, this format allows assessment of multicomponent host biomarker profiles using a unique field-friendly technology24,29,31. Thereby, the UCP-LFA format not only provides diagnostic tools for leprosy but similarly holds promise for TB diagnosis28 and immunomonitoring of other chronic diseases31.
Materials and Methods
Study participants
Participants were recruited on a voluntary basis between January 2013 and December 2014 in leprosy endemic areas in Bangladesh as described previously30. Leprosy was diagnosed based on clinical, bacteriological and histological observations and classified by skin smears according to Ridley and Jopling14. Clinical and demographic data was collected in a database. Participants were classified into six test groups; MB patients, PB patients, HHC, HHC&BCG, NC and EC. Control individuals from the same leprosy endemic area (EC) were examined for the absence of clinical signs and symptoms of leprosy and TB; staff of leprosy- or TB clinics were excluded.
Test group selection
A randomized sample selection was taken from 1110 participants30. Individuals were randomly assigned for sample inclusion using the RAND formula (Excel 2010), aiming for a 50/50 male/female ratio and a 1:1:1 ratio of three age groups: 0–14, 15–29 and 30+ (Supplementary Table S1). In total 242 individuals were selected; MB patients (n = 34), PB patients (n = 45), HHC (n = 54), HHC&BCG (n = 50), EC (n = 51) and NC (n = 8; PB = 7, MB = 1). Patient characteristics are shown in Supplementary Table S2.
Leprosy prevalence
During this study the prevalence in the four districts (Nilphamari, Rongpur, Ponchagor en Thakurganch) was 0.82 per 10,000 with a new case detection rate of 0.98 per 10,000 (monthly report of Rural Health Program of 4 districts of Nilphamari, Bangladesh).
Whole blood assay (WBA)
Upon recruitment venous, heparinized blood (4 ml) was used directly in whole blood assays (WBA), using microtubes pre-coated with M. leprae whole cell sonicate (designated WCS), ML2478/ML0840 recombinant proteins (designated Mlep)16 or without antigen stimulus (designated Nil)30. After 24 hour incubation at 37 °C materials were frozen at −20 °C, shipped on dry ice to the LUMC and stored at −80 °C until analysis by ELISA or UCP-LFA24.
PGL-I and M. leprae whole cell sonicate (WCS)
Synthesized disaccharide epitope (3,6-di-O-methyl-β-D-glucopyranosyl(1 → 4)2,3-di-O-methylrhamnopyranoside), similar to M. leprae specific PGL-I glycolipid, coupled to human serum albumin (synthetic PGL-I; designated ND-O-HSA) and M. leprae whole cell sonicate (WCS) generated with support from the NIH/NIAID Leprosy Contract N01-AI-25469 were obtained through the Biodefense and Emerging Infections Research Resources Repository (http://www.beiresources.org/TBVTRMResearchMaterials/tabid/1431/Default.aspx)47.
PGL-I ELISA
IgM antibodies against M. leprae PGL-I were detected as previously described19. Absorbance of horseradish peroxidase (HRP) was determined at a wavelength of 450 nm.
ELISA for IL-10, IP-10 and CCL4
IP-10 (851.870.015, Diaclone Research, Besancon, France), IL-10 (851.540.015, Diaclone Research, Besancon, France) and CCL4 (DY271-05, R&D systems, Minneapolis, USA) ELISA kits were used. ELISA testing was performed according to the manufacturer’s protocol using coating antibody clones B-S10, B-C50 and #24006 and detection antibodies B-T10, BC-55 and BAF271 respectively for IL-10, IP-10 and CCL4. HRP absorbance was determined at wavelength of 450 nm.
UCP-LFA for IL-10, IP-10 and CCL4
UCP-LFAs for CCL4, IL-10 and IP-10 were prepared and performed as described previously24,28,29. The same antibody pairs as used for ELISAs were applied, with the non-biotinylated variant of the detection antibodies (non-biotinylated CCL4: AF-271-NA). Briefly, mixtures of 100 ng cytokine-specific UCP reporter conjugate and diluted serum sample (1:4 for IL-10, 1:30 for IP-10 and 1:300 for CCL4) were incubated for 60 min on a thermoshaker at 37 °C and 900 rpm. The mixture was then applied to cytokine-specific LF strips (containing a Test line with an antibody complementary to the antibody on the UCP particles) and immunochromatography was allowed to continue until strips were dry. LF strips were scanned in a Packard FluoroCount microtiterplate reader adapted for measurement of the UCP label (980 nm IR excitation, 550 nm emission). Results are displayed as the ratio value between Test and Flow-Control signal based on relative fluorescence units (RFUs) measured at the respective lines48. Ratio values were translated to concentration based on standard curves for each immunemarker. Lower limit of detection was 32 pg/ml for IL-10 and 316 pg/ml for IP-10 and CCL4.
To determine test positivity, similar wholeblood samples from a set of healthy, non-endemic control individuals (NEC) were analysed and UCP-LFA thresholds were calculated based on the average value of all NEC samples (Supplementary Table S3).
UCP-LFA for anti-PGL-I antibody
For detection of anti-PGL-I IgM antibodies, the same protocol as used for cytokine detection was applied utilizing 100-fold diluted serum and IgM-specific UCP conjugate (UCPαIgM). Only unstimulated samples were analysed as the level of antibody levels does not change upon antigen stimulation. The threshold for positivity of 0.29 was determined by computing receiver operating characteristic (ROC) curves.
Ethics
This study was performed according to the Helsinki Declaration as described previously30. The national Research Ethics Committee (Bangladesh Medical Research Council) has approved the study protocol (Ref no. BMRC/NREC/2010-2013/1534).
Participants were informed about the study-objectives, the samples and their right to refuse to take part or withdraw from the study without consequences for their treatment. Written informed consent was obtained before enrolment. All patients received treatment according to national guidelines.
ROC curves
Graphpad Prism version 6.02 for Windows (GraphPad Software, San Diego CA, USA) was used to plot ROC curves and calculate the area under curve (AUC); for IP-10, IL-10 and CCL4 the concentrations (pg/ml) were applied, whereas for anti-PGL-I IgM the OD450 corrected for background (ELISA) and ratio value (UCP-LFAs) was used.
Statistical analysis
Differences in cytokine or antibody levels between test groups, as determined with UCP-LFA, were analysed with the One-way ANOVA for non-parametric distribution (Kruskall-Wallis) and Dunn’s correction for multiple testing using GraphPad Prism. For IP-10, IL-10 and CCL4 the concentrations (pg/ml) and for anti-PGL-I IgM the UCP-LFA ratio values were utilized. The statistical significance level used was p ≤ 0.05.
Additional Information
How to cite this article: van Hooij, A. et al. Quantitative lateral flow strip assays as User-Friendly Tools To Detect Biomarker Profiles For Leprosy. Sci. Rep. 6, 34260; doi: 10.1038/srep34260 (2016).
References
WHO Global leprosy: update on the 2012 situation. Wkly. Epidemiol. Rec. 88, 365–379 (2013).
Lockwood, D. N. & Saunderson, P. Nerve damage in Leprosy: a continuing challenge for scientists, clinicians and service providers. Int Health 4, 77–85 (2012).
Scollard, D. M. et al. The continuing challenges of leprosy. Clin. Microbiol. Rev. 19, 338–381 (2006).
Smith, W. C., van, B. W., Gillis, T., Saunderson, P. & Richardus, J. H. The missing millions: a threat to the elimination of leprosy. PLoS. Negl. Trop. Dis. 9, e0003658, 10.1371/journal.pntd.0003658 (2015).
Geluk, A. Challenges in immunodiagnostic tests for leprosy. Expert. Opin. Med. Diagn. 7, 265–274 (2013).
Xing, Y. et al. VNTR typing studies of Mycobacterium leprae in China: assessment of methods and stability of markers during treatment. Lepr. Rev. 80, 261–271 (2009).
Groathouse, N. A. et al. Multiple polymorphic loci for molecular typing of strains of Mycobacterium leprae. J. Clin. Microbiol. 42, 1666–1672 (2004).
Weng, X., Vander, H. J., Xing, Y., Liu, J. & Vissa, V. Transmission of leprosy in Qiubei County, Yunnan, China: insights from an 8-year molecular epidemiology investigation. Infect. Genet. Evol. 11, 363–374 (2011).
Truman, R., Fontes, A. B., De Miranda, A. B., Suffys, P. & Gillis, T. Genotypic variation and stability of four variable-number tandem repeats and their suitability for discriminating strains of Mycobacterium leprae. J. Clin. Microbiol. 42, 2558–2565 (2004).
Martinez, A. N., Talhari, C., Moraes, M. O. & Talhari, S. PCR-based techniques for leprosy diagnosis: from the laboratory to the clinic. PLoS. Negl. Trop. Dis. 8, e2655, 10.1371/journal.pntd.0002655 (2014).
Roset, B. E. et al. Leprosy Diagnostic Test Development As a Prerequisite Towards Elimination: Requirements from the User’s Perspective. PLoS. Negl. Trop. Dis. 10, e0004331, 10.1371/journal.pntd.0004331 (2016).
Matsuoka, M., Kashiwabara, Y. & Namisato, M. A Mycobacterium leprae isolate resistant to dapsone, rifampin, ofloxacin and sparfloxacin. Int. J. Lepr. Other Mycobact. Dis. 68, 452–455 (2000).
Gupta, U. D., Katoch, K. & Katoch, V. M. Study of rifampicin resistance and comparison of dapsone resistance of M. leprae in pre- and post-MDT era. Indian J. Lepr. 81, 131–134 (2009).
Ridley, D. S. & Jopling, W. H. Classification of leprosy according to immunity. A five-group system. Int. J. Lepr. Other Mycobact. Dis. 34, 255–273 (1966).
Scollard, D. M. Classification of leprosy: a full color spectrum, or black and white? Int J. Lepr. Other Mycobact. Dis. 72, 166–168 (2004).
Geluk, A. et al. New biomarkers with relevance to leprosy diagnosis applicable in areas hyperendemic for leprosy. J. Immunol. 188, 4782–4791 (2012).
Sieling, P. A. et al. Immunosuppressive roles for IL-10 and IL-4 in human infection. In vitro modulation of T cell responses in leprosy. J. Immunol. 150, 5501–5510 (1993).
Pitt, J. M. et al. Blockade of IL-10 signaling during bacillus Calmette-Guerin vaccination enhances and sustains Th1, Th17 and innate lymphoid IFN-gamma and IL-17 responses and increases protection to Mycobacterium tuberculosis infection. J. Immunol. 189, 4079–4087 (2012).
Khadge, S. et al. Longitudinal immune profiles in type 1 leprosy reactions in Bangladesh, Brazil, Ethiopia and Nepal. BMC. Infect. Dis. 15, 477, 10.1186/s12879-015-1128-0 (2015).
Spencer, J. S. et al. Analysis of antibody responses to Mycobacterium leprae phenolic glycolipid I, lipoarabinomannan and recombinant proteins to define disease subtype-specific antigenic profiles in leprosy. Clin. Vaccine Immunol. 18, 260–267 (2011).
Geluk, A., Duthie, M. S. & Spencer, J. S. Postgenomic Mycobacterium leprae antigens for cellular and serological diagnosis of M. leprae exposure, infection and leprosy disease. Lepr. Rev. 82, 402–421 (2011).
Oskam, L., Slim, E. & Buhrer-Sekula, S. Serology: recent developments, strengths, limitations and prospects: a state of the art overview. Lepr. Rev. 74, 196–205 (2003).
Corstjens, P. L. et al. A user-friendly, highly sensitive assay to detect the IFN-gamma secretion by T cells. Clin. Biochem. 41, 440–444 (2008).
Corstjens, P. L. et al. Lateral flow assay for simultaneous detection of cellular- and humoral immune responses. Clin. Biochem. 44, 1241–1246 (2011).
Zhao, Y. et al. Rapid multiplex detection of 10 foodborne pathogens with an up-converting phosphor technology-based 10-channel lateral flow assay. Sci. Rep. 6, 21342, 10.1038/srep21342 (2016).
Hua, F. et al. Development and evaluation of an up-converting phosphor technology-based lateral flow assay for rapid detection of Francisella tularensis. Sci. Rep. 5, 17178, 10.1038/srep17178 (2015).
van Dam, G. J. et al. A robust dry reagent lateral flow assay for diagnosis of active schistosomiasis by detection of Schistosoma circulating anodic antigen. Exp. Parasitol. 135, 274–282 (2013).
Corstjens, P. L. et al. Multi-center evaluation of a user-friendly lateral flow assay to determine IP-10 and CCL4 levels in blood of TB and non-TB cases in Africa. Clin. Biochem. 49, 22–31 (2016).
Bobosha, K. et al. Field-evaluation of a new lateral flow assay for detection of cellular and humoral immunity against Mycobacterium leprae. PLoS. Negl. Trop. Dis. 8, e2845, 10.1371/journal.pntd.0002845 (2014).
Richardus, R. A. et al. The combined effect of chemoprophylaxis with single dose rifampicin and immunoprophylaxis with BCG to prevent leprosy in contacts of newly diagnosed leprosy cases: a cluster randomized controlled trial (MALTALEP study). BMC. Infect. Dis. 13, 456, 10.1186/1471-2334-13-456 (2013).
Corstjens, P. L. et al. Field-friendly test for monitoring multiple immune response markers during onset and treatment of exacerbated immunity in leprosy. Clin. Vaccine Immunol. 23, 515–519 (2016).
Martins, M. V. et al. Pathogen-specific epitopes as epidemiological tools for defining the magnitude of Mycobacterium leprae transmission in areas endemic for leprosy. PLoS. Negl. Trop. Dis. 6, e1616, 10.1371/journal.pntd.0001616 (2012).
Duthie, M. S. et al. A rapid ELISA for the diagnosis of MB leprosy based on complementary detection of antibodies against a novel protein-glycolipid conjugate. Diagn. Microbiol. Infect. Dis. 79, 233–239 (2014).
Duthie, M. S., Orcullo, F. M., Abbelana, J., Maghanoy, A. & Balagon, M. F. Comparative evaluation of antibody detection tests to facilitate the diagnosis of multibacillary leprosy. Appl. Microbiol. Biotechnol. 100, 3267–3275 (2016).
Spencer, J. S. et al. Identification of serological biomarkers of infection, disease progression and treatment efficacy for leprosy. Mem. Inst. Oswaldo Cruz 107 Suppl 1, 79–89 (2012).
Douglas, J. T. et al. Prospective study of serological conversion as a risk factor for development of leprosy among household contacts. Clin. Diagn. Lab Immunol. 11, 897–900 (2004).
Montoya, D. & Modlin, R. L. Learning from leprosy: insight into the human innate immune response. Adv. Immunol. 105, 1–24 (2010).
Keating, S. M. et al. The effect of HIV infection and HAART on inflammatory biomarkers in a population-based cohort of women. AIDS 25, 1823–1832 (2011).
Cassatella, M. A. et al. Regulated production of the interferon-gamma-inducible protein-10 (IP-10) chemokine by human neutrophils. Eur. J. Immunol. 27, 111–115 (1997).
Aabye, M. G. et al. Potential of interferon-gamma-inducible protein 10 in improving tuberculosis diagnosis in HIV-infected patients. Eur. Respir. J. 36, 1488–1490 (2010).
Berrington, W. R. et al. Differential dermal expression of CCL17 and CCL18 in tuberculoid and lepromatous leprosy. PLoS. Negl. Trop. Dis. 8, e3263, 10.1371/journal.pntd.0003263 (2014).
Kim, M. H., Choi, Y. W., Choi, H. Y., Myung, K. B. & Cho, S. N. The expression of RAGE and EN-RAGE in leprosy. Br. J. Dermatol. 154, 594–601 (2006).
Realegeno, S. et al. S100A12 Is Part of the Antimicrobial Network against Mycobacterium leprae in Human Macrophages. PLoS. Pathog. 12, e1005705, 10.1371/journal.ppat.1005705 (2016).
Zou, K. H., O’Malley, A. J. & Mauri, L. Receiver-operating characteristic analysis for evaluating diagnostic tests and predictive models. Circulation 115, 654–657 (2007).
Richardus, R. A. et al. Clinical manifestations of leprosy after BCG vaccination: an observational study in Bangladesh. Vaccine 33, 1562–1567 (2015).
Merle, C. S., Cunha, S. S. & Rodrigues, L. C. BCG vaccination and leprosy protection: review of current evidence and status of BCG in leprosy control. Expert. Rev. Vaccines. 9, 209–222 (2010).
Cho, S. N., Yanagihara, D. L., Hunter, S. W., Gelber, R. H. & Brennan, P. J. Serological specificity of phenolic glycolipid I from Mycobacterium leprae and use in serodiagnosis of leprosy. Infect. Immun. 41, 1077–1083 (1983).
Corstjens, P. et al. Use of up-converting phosphor reporters in lateral-flow assays to detect specific nucleic acid sequences: a rapid, sensitive DNA test to identify human papillomavirus type 16 infection. Clin. Chem. 47, 1885–1893 (2001).
Acknowledgements
The authors gratefully acknowledge all patients and blood donors. LUMC, Erasmus MC and TLMI,B are part of the IDEAL (Initiative for Diagnostic and Epidemiological Assays for Leprosy) Consortium. We thank the staff of the Rural Health Program and dr. Ruth Butlin (The Leprosy Mission International Bangladesh, Nilphamari, Bangladesh) for recruitment of study participants and sample collection. Recruitment of the study participants in Bangladesh was supported by grants from the Order of Malta-Grants-for-Leprosy-Research (MALTALEP), the Netherlands Leprosy Relief Foundation (NLR; ILEP#: 7020273 and 703.15.07) together with the German Leprosy and TB Relief Association (GLRA) and the Turing Foundation, the Novartis Foundation and the Leprosy Research Initiative (LRI). Development of the UCP-LFA was supported by the Q.M. Gastmann-Wichers Foundation. The funders had no role in study design, data collection and analysis, decision to publish, or preparation of the manuscript.
Author information
Authors and Affiliations
Contributions
Designed research: A.G. and P.L.A.M.C. Enrolled patients, performed and registered clinical diagnosis: K.A., J.H.R. and R.R. Performed research: A.v.H., C.J.d.D., E.M.T.K.F., L.W., R.R. and S.J.F.v.d.E. Analyzed the data: A.G., A.v.H., E.M.T.K.F., L.W., P.L.A.M.C., R.F. and S.J.F.v.d.E. Wrote the paper: A.G., A.v.H. and P.L.A.M.C. Agree with manuscript results and conclusions: A.G., A.v.H., E.M.T.K.F., R.R., S.J.F.v.d.E., L.W., C.J.d.D., R.F., K.A., J.H.R. and P.L.A.M.C.
Ethics declarations
Competing interests
The authors declare no competing financial interests.
Electronic supplementary material
Rights and permissions
This work is licensed under a Creative Commons Attribution 4.0 International License. The images or other third party material in this article are included in the article’s Creative Commons license, unless indicated otherwise in the credit line; if the material is not included under the Creative Commons license, users will need to obtain permission from the license holder to reproduce the material. To view a copy of this license, visit http://creativecommons.org/licenses/by/4.0/
About this article

Cite this article
van Hooij, A., Tjon Kon Fat, E., Richardus, R. et al. Quantitative lateral flow strip assays as User-Friendly Tools To Detect Biomarker Profiles For Leprosy. Sci Rep 6, 34260 (2016). https://doi.org/10.1038/srep34260
Received:
Accepted:
Published:
DOI: https://doi.org/10.1038/srep34260
This article is cited by
-
A comprehensive research agenda for zero leprosy
Infectious Diseases of Poverty (2020)
-
Clustering of leprosy beyond the household level in a highly endemic setting on the Comoros, an observational study
BMC Infectious Diseases (2019)
-
RETRACTED ARTICLE: A SERS-based lateral flow assay for the stroke biomarker S100-β
Microchimica Acta (2019)
-
Detection of humoral immunity to mycobacteria causing leprosy in Eurasian red squirrels (Sciurus vulgaris) using a quantitative rapid test
European Journal of Wildlife Research (2019)
-
Whole blood RNA signatures in leprosy patients identify reversal reactions before clinical onset: a prospective, multicenter study
Scientific Reports (2019)
Comments
By submitting a comment you agree to abide by our Terms and Community Guidelines. If you find something abusive or that does not comply with our terms or guidelines please flag it as inappropriate.
