
Abstract
Core promoter controls the initiation of transcription. Core promoter sequence change can disrupt transcriptional regulation, lead to impairment of gene expression and ultimately diseases. Therefore, comprehensive characterization of core promoters is essential to understand normal and abnormal gene expression in biomedical studies. Here we report the development of EVDC (Exome-based Variant Detection in Core promoters) method for genome-scale analysis of core-promoter sequence variation. This method is based on the fact that exome sequences contain the sequences not only from coding exons but also from non-coding region including core promoters generated by random fragmentation in exome sequencing process. Using exome data from three cell types of CD4+ T cells, CD19+ B cells and neutrophils of a single individual, we characterized the features of core promoter-mapped exome sequences, and analysed core-promoter variation in this individual genome. We also compared the core promoters between YRI (Yoruba in Ibadan, Nigeria) and the CEU (Utah residents of European decedent) populations using the exome data generated by the 1000 Genome project, and observed much higher variation in YRI population than in CEU population. Our study demonstrates that the EVDC method provides a simple but powerful means for genome-wile de novo characterization of core promoter sequence variation.
Introduction
Transcription initiation is regulated through highly specific spatial interaction between cis- and trans-elements in the core promoter1,2,3. Alterations in core promoter cis-sequences can affect cis-trans interaction, disturb formation of the initiation complex machinery, resulting in altered gene expression and diseases including cancer4,5,6,7,8,9,10,11. A typical eukaryotic core promoter contains multiple conserved cis-regulatory elements located about 50-bases upstream and downstream of the transcriptional start site (TSS)1,2, including the TFIIB recognition element (BRE), TATA box, Initiator element (INR), downstream promoter element (DPE), and other transcription factor binding sites (TFBS).
Core promoters in several model species have been extensively annotated through many studies, and the information provides rich resources to study regulation of transcription initiation1,2,3. Many biological and medical studies require gaining genomewide, de novo information to study the regulation of transcription initiation under specific physiological and pathological conditions. However, current methodologies have limited power to accomplish this task. For example, ChIP-sequencing (e.g., ChIP-exo) can only analyse a given type of trans-element binding sites in one assay12; promoter-array13 has low specificity to provide gene-specific probes due to the highly conserved core promoter sequences among different genes, and has inherited deficiency to detect altered core-promoters as the probes designed for the array are based on normal reference genome sequences; Cap Analysis Gene Expression (CAGE) can locate promoters precisely but it does not analyse core promoter contents14; and whole-genome sequencing is not cost-effective as core promoters account for only a tiny portion of the entire genome.
Here, we describe the development of the EVDC (Exome-based Variant Detection in Core-promoters) method for core promoter analysis. Exome sequencing was designed to analyse the coding-exons in a genome15. However, it has been observed that over half of exome sequences are routinely originated outside of coding exons16,17. This is caused by the random fragmentation of genomic DNA used in exome library preparation18, which generates both coding-exon templates and coding-exon connected non-coding templates including core promoters. Isolation of DNA templates through hybridization with exon-specific probes collects not only coding-exon templates but also coding-exon connected core promoter templates. Sequencing the isolated DNA templates will generate the sequences derived from core promoters (Fig. 1).

It shows that random fragmentation of genomic DNA generates the DNA templates connecting core-promoters and coding exons. Exon-targeting probes will isolate such templates. Sequencing the isolated templates will result in the sequences originated from core-promoters.
Results
Characterization of promoter-mapped exome sequences
We analysed the relationship between core-promoters and exome sequences. As a model for the study, we used three sets of exome sequences generated independently from human CD4+ T cells, CD19+ B cells and neutrophils of a healthy Caucasian male19. The use of these three sets of exome sequence data from the same individual allowed us to measure the reproducibility of results. We performed the following analyses:
-
1
Portion of exome sequences from promoter region. We mapped the three sets of exome sequences to the human reference genome (hg19) to determine the origins of the exome sequences (Table 1). Many genes have multiple TSS sites, and the region downstream TSS sites is also involved in transcription initiation20. Therefore, we included the region between −500 to +100 for the measure. The results showed that on average, an exome data set contained over six million bases (1.63% of the total exome data) originated from promoter region between −500 to +100 (Table 1);
Table 1 Origins of exome sequences. -
2
Distribution of promoter-mapped exome sequences. Between −500 to +100, the promoter-mapped sequences had the highest abundance at +100 and then decreased towards more upstream. At −100 upstream TSS, there were on average around 2 million bases from promoter-mapped exome sequences in each exome data set (Fig. 2);
Figure 2: Distribution of promoter-mapped exome sequences. 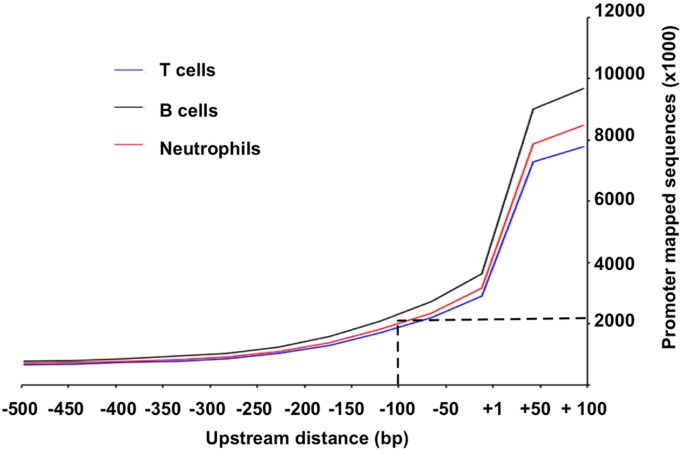
It shows that the promoter-mapped sequences provide sufficient coverage in core-promoter region between −100 to +100. The same patterns appeared in all three data set of T cells, B cells and neutrophils.
-
3
Number of promoters detected by exome sequences. The highest number of promoters detected was at +100, covering 85.1% promoters for the 20,794 genes targeted by the exome kit. The rates decreased towards upstream. At −100 upstream TSS, on average 78.7% of the promoters were detected in each exome data set (Table 2);
Table 2 Number of promoters mapped by exome sequences. -
4
Variant call and sequence coverage. We called the variants from promoter-mapped sequences from high coverage till single sequence coverage. The number of called variants increased smoothly from >=10 to 3 sequences. Thereafter, the number of called variants increased substantially. However, the reliability of such increased variants is questionable as they could be originated from sequence errors in the 2 to 1 mapped sequences (Fig. 3).
Figure 3: Relationship between sequence coverage and variant call. 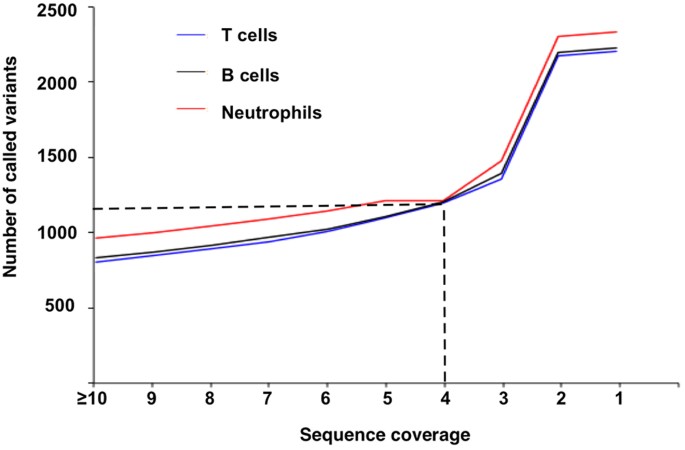
It shows the steady increases of variants called from coverage > =10 to 3.


Based on these results, we conclude that the promoter-mapped exome sequences are most suitable to analyze core promoters between −100 to +100, and a minimum of four-sequence coverage should ensure the reliability of the variants called from the promoter-mapped sequences.
Variants called from the core promoters in the individual genome
Using the conditions set above, we analyzed the core promoter variation in this individual genome using hg19 as the reference. We identified 291 variants distributed at different frequencies within the core-promoter region (Fig. 4A, Supplementary Table 1). We characterized these variants:
-
1
Reliability of called variants. Of the 291 called variants, 288 (98.9%) already exist in dbSNP and 253 (86%) had high Minor Allele Frequency (>0.05). Sanger sequencing validated 90% (45 of 50) of the randomly selected variants called from the ≥four mapped sequences (Supplementary Table 2). These results highlighted that the variants called on the conditions were highly reliable.
-
2
Features of the called variants. The 291 variants consisted of 81 indels ranging from 2 to 23 bases, and 210 SNPs. No obvious base preference was observed for the indel sites (35, 33, 30 and 29 in the order of A, C, G and T), but substantial differences existed for the SNP sites, with the highest A to G transition (Ts) for 35 times, and the lowest A to T transversion (Tv) for only once. Ts/Tv ratio was 2.82, which is higher than the 2–2.1 across the entire human genome (Fig. 4B).
-
3
Genes with variable core promoters. The 291 variants were distributed in the core promoters of 241 genes. The core-promoters in multiple genes, including CRIP1, HLA-F-AS1, ISG15, OR1N2, and TREML4, were highly variable with three to six variants. For example, there were six variants located at −28, −22, −21, 34, 43, and 95 across core-promoter of TREML4 (triggering receptor expressed on myeloid cells-like 4), a gene involved in antigen process in myeloid cells and T cells21 (Fig. 4C).
-
4
Core promoter motifs with variants. Searching for the variants located in core promoter motifs of BRE, TATA box, INR and DPE identified 3 variants in the BRE of three genes, 15 variants in the DPE of 13 genes, and five variants in the INR of three genes (Supplementary Table 1). For example, two variants of A to G and A to C were at the third and fourth positions of a putative INR motif (CCAATTC) in the core promoter of C12orf10 (Fig. 5). We did not find any variants in TATA boxes, suggesting that TATA box sequences in this individual genome are stable. Searched for variants located in conventional transcriptional factor binding motifs (TFBS) within core promoters identified the variants located in two TFBS of two genes, including a variant in JUN binding motif at +40 of the UMPS core promoter and a variant in E2F4 binding motif at +37 of the HSP90B1 core promoter. Each of the variants was located at the intolerant position of its TFBS with the Position Frequency Matrix (PFM) index of 2 (Fig. 5).
Figure 5: Variant-affected motifs in the exome-sequenced individual genome. 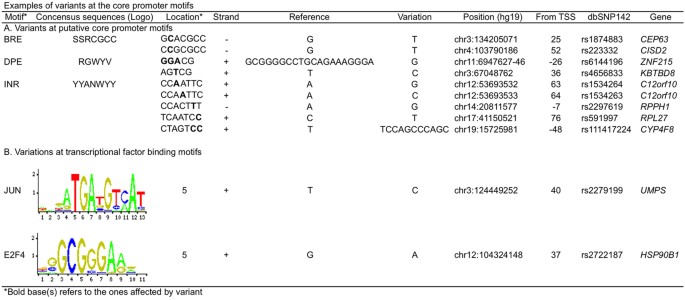
(A) Variant-affected core promoter motifs; (B) Variant-affected transcriptional factor binding motifs. Note that the motif bases were based the top strand whereas the variant bases were based on the actual strand depending on its orientation.


(A) Distribution of the 291 variants between +100 and −100 at the frequencies between 1 to 7. (B) Types of variants and Ts/Tv ratio. Of the 291 variants, A to G transition had the highest number of 35 times, whereas A to T transversion had the lowest number of only 1 time. (C) The presence of six transition variants between C and T in core promoter of TREML4 between −28 to 95.
Core-promoter variation between Caucasian and African genomes
It is well known that African genomes are more divergent than those of other ethnicities are22,23. Using the EVDC method, we compared the similarity and difference of core promoters between two ethnical groups, the YRI (Yoruba in Ibadan, Nigeria) and the CEU (Utah residents of European decedent), using 27 exome data sets from each group collected by the 1000 Genome Project24 for the analysis (Supplementary Table 3). The results showed that
-
1
Core promoters were more variable in YRI than in CEU. There were a total of 14,372 variants in YRI comparing to 11,380 in CEU (p = 1.51E−30), and 4,823 variants in single individuals in YRI group comparing to 3,202 in CEU (p = 9.71 × 10⁻²¹). Variants shared in multiple individuals within each group were more common in CEU than in YRI, as exemplified by the 230 variants common in all 27 CEU individuals comparing to 137 in YRI (p = 6.97E10−13) (Table 3, Supplementary Tables 4A–C and 5A–C). The fluctuated P-values among the variants between YRI and CEU subgroups were likely caused by both technical and biological factors, such as the limited sample size used in the study and non-random distribution of variants in the core-promoters;
Table 3 Differences of core promoter variants between YRI and CEU populations. -
2
Features of the variants in YRI and CEU. There were 19 indels in the variants shared within YRI and CEU groups, but the numbers increased to 816 in the variants only present in single individuals in YRI and CEU groups. In the shared variants, CEU had more Indels than in YRI (12 to 3); but in the individualized variants, YRI had more than in CEU (475 to 320). Similar patterns were present for SNPs: there were 268 SNPs in the variants shared within YRI and CEU groups but the numbers increased to 7,021 in the variants only present in single individuals in YRI and CEU groups, and the number in individualized YRI group was much larger than in CEU group (4,159 to 2,693). The highest SNP change was G to A in individualized variants in YRI (940) and the lowest SNP change was T to A in individualized variants shared between YRI and CEU groups (1 only). Ts/Tv ratios were all over 3 in each subgroup except 2.45 in the shared variants between the variants not shared within YRI and CEU groups (Table 4).
Table 4 Ts/Tv ratio for the variants in YRI and CEU populations. -
3
Individualized variants were mostly known variants. For the 4,823 YRI and 3,202 CEU individualized variants, 75% in YRI and 74.7% in CEU were present in dbSNP (Supplementary Table 4A–C); for the variants common in all 27 cases in each group, 100% in YRI, 100% in CEU, and 98.8% of the 80 shared variants were present in dbSNP (Supplementary Table 5A–C). This information further supports the reliability of the variants called from YRI and CEU groups.
-
4
Individualized variants were mostly not shared between YRI and CEU groups. Of the 3,202 CEU and 4,823 YRI individualized variants, only 189 (4% in YRI and 6% in CEU) were shared between the two groups. In contrast, of the 137 and 230 variants common in all 27 cases of YRI and CEU groups, 80 variants (58% YRI and 35% CEU) were shared between the two groups (Fig. 6A);
Figure 6: Comparison of variants between YRI and CEU populations. 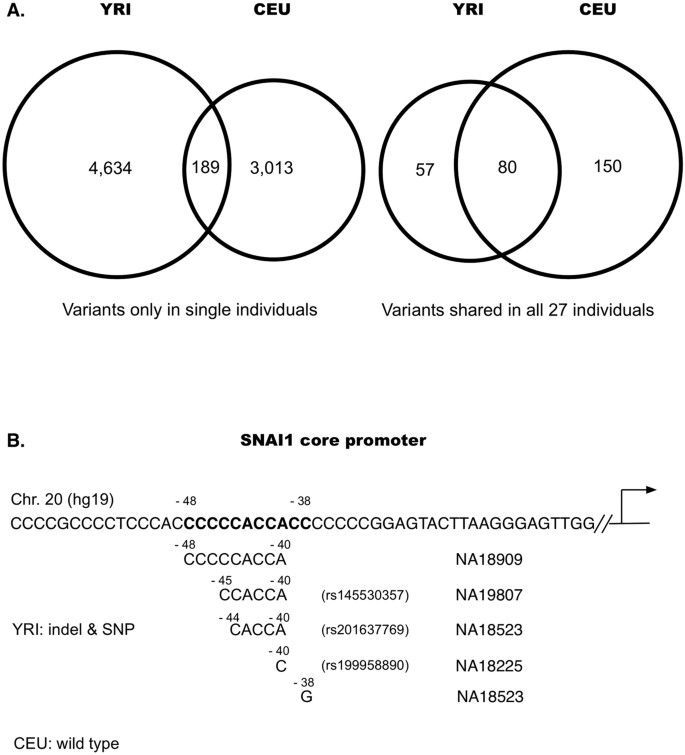
(A) Comparisons of the variants present only in single individuals of YRI and CEU populations, and the variants shared in all 27 individuals of YRI and CEU populations. (B) Comparison of SNAI1 core promoter between YRI and CEU populations. In the individualized variants, five variants of 3 deletions and two SNPs, of which three are known variants in dbSNP, were present in SNAI1 core promoter between −48 to −38 in four YRI individuals, the SNP at −38 (C > G) converted CCACCCC into a BRE site CCACGCC, whereas all CEU individuals remained the same as in the reference genome sequences (hg19).
-
5
More genes in YRI contained variable core promoters than these in CEU. In the individualized variants, 3,741 genes in YRI had their core promoters affected by 4,823 variants but only 2,557 genes in CEU affected by 3,202 variants. Taking SNAI1 as an example: SNAI1 is a zinc finger transcriptional repressor related with a parasitic infectious disease Dracunculiasis. Together with histone demethylase KDM1A, SNAI1 decreases dimethylated H3K4 levels to repress transcription involved in mesoderm formation during embryonic development. In the individualized variants in YRI, five variants of 3 deletions and two SNPs were present in SNAI1 core promoter between −48 to −38 in four individuals, the SNP at −38 (C > G) converted the wild type sequence CCACCCC into a BRE site CCACGCC. In comparison, SNAI1 promoter in CEU group maintained wild type sequences (Fig. 6B).
-
6
Core promoter motifs in YRI were more affected than these in CEU. Of the variants common in 27 cases, 17 motifs were affected by the variants in YRI only compared to 8 only in CEU; of the individualized variants, 402 motifs were affected by the variants in YRI only compared to 259 in CEU only. The most affected motif was DPE in both groups. Only one and three variants in shared and individualized YRI variants were in TATA box but none in CEU group, indicating that TATA box sequences in these two ethnical groups are stable (Table 5). Searching for the variants affecting TFBS didn’t find any in the shared variants in either groups except two individualized variants in YRI group in ZBTB33 and MYC sites of MAPK15 and UQCRBP1, and two in CEU group in Egr1 and CTCF sites of RICTOR and RMRP (data not shown).
Table 5 Variants distributed in putative core promoter motifs.

Data from these analyses revealed that the core promoters in YRI population are more variable than in CEU population.
Discussion
The unique features of the EVDC method include: (1) It provides de novo information without the need for a priori knowledge of core promoter sequences. As the promoter sequences are collected indirectly through probes targeting coding exons, they preserve the native information of the core promoter sequences; (2) It detects the variants in core promoters at genome level. This is achieved by taking the advantage of exome sequences targeting the entire coding genes; (3) It extends the value of exome sequences from the coding region to the core-promoter region; (4) It is cost-effective.
Around 80% of gene core promoters were confidently detected by our method but 20% of promoters were missed (Table 2). A part of the missed promoters was in fact mapped by exome sequences but at lower coverage. Although variants from these promoters could be called, these called variants are less reliable and distributed in more random manner, which is troublesome, particularly when comparing the variants between different genomes. Other cause for the missed promoters can be attributed by the lack of coding-exon connected core promoter templates. We quantified these missed promoters in the 3 exome data sets from the donor. The results showed that 12.4% were missed in all three samples and the remaining had lower sequence coverage. Improvement of designing exon probes closer to the 5′ end of 5′-UTR, generating longer fragments during random fragmentation should increase the rate of core promoter detection.
Sequence length can influence the promoter region covered by exome sequences. In our study, we used paired-end read at 2 × 100 by Illumina sequencer HiSeq2000. All Illumina sequencers use bridge amplification-based cluster generation and sequencing by synthesis. The nature of these methods determines that the rate of artificial bases will significantly increase after 100 bases22. Although new Illumina sequencers can provide longer reads up to 300 bp, causing needs to be taken that increased sequencing errors towards the longer sequence ends can be problematic for variation analysis in core-promoter region.
Our data show that over 80% of exome sequences were from non-coding regions. This rate is higher than previously reported 50–65%16,17,25. We quantified the rate in the 27 CEU exome data sets from the 1000 genome project (Supplementary Table 3), which were generated by using early-generation exome kits. The results show that 60% of the sequences were from non-coding regions. This difference can be due to the different exome kits used in the studies. Exome kits are under constant evolution. The early exome data were collected by using the first-generation exome kits, which mainly targeted the coding exons24. Later on, all exome kits have doubled their targeted regions by inclusion of 5′ UTR, intron-exon boundary, 3′ UTR, and non-coding genes etc. As such, the proportion of the exome sequences from the non-coding region has been substantially increased over these generated by the early exome kits. This feature increases the value of using exome sequences for non-coding sequence analysis.
Many variant-affected core promoter motifs were not located at the conventionally defined positions in core promoters. For example, none of the 15 variant-affected DPE motifs identified in the individual genome was located within the DPE position defined as 27–33 bases downstream of TSS site1,2. A possibility is that certain variant-affected core promoter motifs at the non-conventional positions could be related to one of the multiple TSS, a common phenomenon existing in many genes26. Another possibility can be related with the limited length of the consensus motif sequences. BPE and INR motifs have seven bases but DPE has only five bases, which makes variant-mapped DPE motif less specific or even simply hit by random chance27.
We compared the sensitivity of exome sequences and whole genome sequences for core-promoter variant detection by using the exome and whole genome data of the same individual from 1000 Genome project28. Comparing the variants between the data sets shows that 79% of exome detected variants were also detected by whole genome sequences, but the later detected 1.4 times more variants than exome sequences did; furthermore, a portion of variants was only detected by each method (Supplementary Figure 1). While whole genome sequences can detect more variants than exome sequences, the sequencing cost is an important factor to consider. Current cost of whole genome sequencing is about 3–5 times higher than that of exome sequencing. We consider that at current art of sequencing technologies, exome sequencing is a more cost-effective solution than whole genome sequencing for core promoter analysis.
Large quantities of publically available exome data have been collected by various genomics projects, such as the Exon Variant Server Project29, the 1000 Genome Project30, the Cancer Genome Atlas Project31, and the Exome Aggregation Consortium32. These exome data have been used primarily for coding-exon analyses. Applying the EVDC method to mine these rich exome resources should lead to a comprehensive characterization of core-promoters in humans and other species for better understanding of transcriptional initiation regulation.
Materials and Methods
Samples used for the study
CD4+ T cells, CD19+ B cells and neutrophils from venous blood of a healthy Caucasian male donor were purchased from AllCells Company (AllCells, Alameda, California). The use of the cells for research purpose has AllCells company IRB approval (Biomed IRB). The donor signed the written consent form, which is archived with their medical records. All experiments were performed in accordance with relevant guidelines and regulations. According to US Federal Regulations, 45 CFR Part 46.101(b)(4)–Protection of Human Subjects, using this type of human cells for research is exempted from the requirement for IRB review.
Exome sequences
Exome sequences were generated as reported19. Briefly, genomic DNA from three purified cell types of CD4+ T cells, CD19+ B cells and neutrophils of the individual was extracted using a FlexiGene DNA kit (Qiagen). An exome library was constructed for each DNA sample by random fragmentation using the Covaris II system (Covaris Inc. Massachusetts, USA), and by isolation of exome templates using the TruSeq Exome Enrichment Kit (Illumina®) following the manufacturer’s protocols. Exome sequences were collected by using a HiSeq 2000 sequencer (paired-end 2 × 100). Exome sequence data were deposited in the National Center for Biotechnology Information (NCBI) with accession number SRR933549. Exome data from the 1000 genome project were downloaded from 1000 Genomes FTP site24.
Exome data mapping and variant call from promoter-mapped exome sequences
Exome sequences were mapped to the human genome reference sequence hg19 by Bowtie2 using the default parameters in paired mode33. The resulting SAM files were converted to BAM files and sorted. Duplicates were removed using the Picard program. The mapped reads were processed using Genome Analysis Toolkit34 with RealignerTargetCreator and IndelRealigner for local realignment. BaseRecalibrator was used for base quality score recalibration. GATK HaplotypeCaller was used for variant calls, followed by variant recalibration with VariantRecalibrator. The called variants were annotated with ANNOVAR35 using RefSeq, dbSNP144 and 1000 Genomes databases. Promoter regions between −500~+100 of the exome kit-targeted 20,794 genes were extracted from hg19. A minimum of four promoter-mapped sequences was set for variant calling. For overlapped genes, the first gene was used for the mapping analysis.
For variants located in core promoter motifs, the following consensus sequences were used as the references1,2: SSRCGCC (BRE), TATAWAAR (TATA box), YYANWYY (INR), and RGWYV (DPE). For the variants located at transcription factor binding motif, the motifs listed at JASPAR CORE database for human were used as the reference36.
Additional Information
How to cite this article: Kim, Y. C. et al. Exome-based Variant Detection in Core Promoters. Sci. Rep. 6, 30716; doi: 10.1038/srep30716 (2016).
References
Smale, T. & Kadonaga, T. The RNA polymerase II core promoter. Annual review bioche 72, 449–479 (2003).
Kadonaga, J. T. Perspectives on the RNA polymerase II core promoter. Wiley Interdiscip Rev Dev Biol. 1, 40–51, 10.1002/wdev.21 (2012).
Badis, G. et al. Diversity and complexity in DNA recognition by transcription factors. Science 324, 1720–1723, 10.1126/science.1162327 (2009).
Wray, G. A. The evolutionary significance of cis-regulatory mutations. Nat Rev Genet. 8, 206–216 (2007).
Albert, F. W. & Kruglyak, L. The role of regulatory variation in complex traits and disease. Nat Rev Genet. 16, 197–212, 10.1038/nrg3891 (2015).
Khurana, E. et al. Role of non-coding sequence variants in cancer. Nat Rev Genet. 17, 93–108, 10.1038/nrg.2015.17 (2016).
Mathelier, A. et al. Cis-regulatory somatic mutations and gene-expression alteration in B-cell lymphomas. Genome Biol. 16, 84, 10.1186/s13059-015-0648-7 (2015).
Poulos, R. C. et al. Systematic screening of promoter regions pinpoints functional cis-regulatory mutations in a cutaneous melanoma genome. Mol Cancer Res. 13, 1218–1226, 10.1158/1541-7786.MCR-15-0146 (2015).
Perera, D. et al. OncoCis: annotation of cis-regulatory mutations in cancer. Genome Biol. 15, 485 (2014).
Smith, K. S. et al. Signatures of accelerated somatic evolution in gene promoters in multiple cancer types. Nucleic Acids Res. 43, 5307–5317, 10.1093/nar/gkv419 (2015).
Melton, C., Reuter, J. A., Spacek, D. V. & Snyder, M. Recurrent somatic mutations in regulatory regions of human cancer genomes. Nat Genet. 47, 710–716, 10.1038/ng.3332 (2015).
Rhee, H. S. & Pugh, B. F. Comprehensive genome-wide protein-DNA interactions detected at single-nucleotide resolution. Cell 147, 1408–1419, 10.1016/j.cell.2011.11.013 (2011)
Wang, Y. et al. “Promoter array” studies identify cohorts of genes directly regulated by methylation, copy number change, or transcription factor binding in human cancer cells. Ann N Y Acad Sci. 1058, 162–185 (2005).
Takahashi, H., Lassmann, T., Murata, M. & Carninci, P. 5′ end-centered expression profiling using cap-analysis gene expression and next-generation sequencing. Nat Protoc. 7, 542–561, 10.1038/nprot.2012.005 (2012).
Bamshad, M. J. et al. Exome sequencing as a tool for Mendelian disease gene discovery. Nature Reviews Genetics 12, 745–755, 10.1038/nrg3031 (2011).
Guo, Y. et al. Exome sequencing generates high quality data in non-target regions. BMC Genomics 13, 194, 10.1186/1471-2164-13-194 (2012).
Samuels, D. C. et al. Finding the lost treasures in exome sequencing data. Trends Genet. 29, 593–599, 10.1016/j.tig.2013.07.006 (2013).
Mamanova, L. et al. Target-enrichment strategies for next-generation sequencing. Nat Methods 7, 111–118, 10.1038/nmeth.1419 (2010).
Xiao, F. et al. The genome of polymorphonuclear neutrophils maintains normal coding sequences. PLoS One. 8, e78685, 10.1371/journal.pone.0078685. eCollection 2013 (2013).
Carninci, P. et al. The transcriptional landscape of the mammalian genome. Science 309, 1559–1563 (2005).
Hemmi, H. et al. Treml4, an Ig superfamily member, mediates presentation of several antigens to T cells in vivo, including protective immunity to HER2 protein. J. Immun. 188, 1147–1155, 10.4049/jimmunol.1102541 (2012).
Gurdasani, D. et al. The African Genome Variation Project shapes medical genetics in Africa. Nature 517, 327–332, 10.1038/nature13997 (2015).
Bentley, D. R. et al. Accurate whole human genome sequencing using reversible terminator Nature 456, 53–59, 10.1038/nature07517 (2008).
The 1000 Genomes FTP site: ftp://ftp.1000genomes.ebi.ac.uk/vol1/ftp, date of access: 08/05/2015.
Asan. et al. Comprehensive comparison of three commercial human whole-exome capture platforms. Genome Biol. 12, R95, 10.1186/gb-2011-12-9-r95 (2011).
Sandelin, A. et al. Mammalian RNA polymerase II core promoters: insights from genome-wide studies. Nat Rev Genet. 8, 424–436 (2007).
Siebert, M. & Söding, J. Universality of core promoter elements? Nature 511, E11-2, 10.1038/nature13587 (2014).
Zheng, G. X. et al. Haplotyping germline and cancer genomes with high-throughput linked-read sequencing. Nat Biotechnol. 34, 303–311, 10.1038/nbt.3432 (2016).
The NHLBI GO Exome Sequencing Project: http://evs.gs.washington.edu/EVS/, date of access: 20/02/2016.
1000 Genomes Project Consortium et al. An integrated map of genetic variation from 1,092 human genomes. Nature 491, 56–65, 10.1038/nature11632 (2012).
The Cancer Genome Atlas: http://cancergenome.nih.gov, date of access: 10/01/2016.
The Exome Aggregation Consortium: http://exac.broadinstitute.org/terms, date of access: 10/01/2016.
Langmead, B. & Salzberg, S. L. Fast gapped-read alignment with Bowtie 2. Nat Methods 9, 357–359, 10.1038/nmeth.1923 (2012).
McKenna, A. et al. The Genome Analysis Toolkit: a MapReduce framework for analyzing next-generation DNA sequencing data. Genome Res. 20, 1297–1303, 10.1101/gr.107524.110 (2010).
Wang, K., Li, M. & Hakonarson, H. ANNOVAR: functional annotation of genetic variants from high-throughput sequencing data. Nucleic Acids Res. 38, e164, 10.1093/nar/gkq603 (2010).
Mathelier, A. et al. JASPAR 2014: an extensively expanded and updated open-access database of transcription factor binding profiles. Nucleic Acids Res. 42, D142–D147, 10.1093/nar/gkt997 (2014).
Acknowledgements
This study was supported by an American Cancer Society and the Fred & Pamela Buffett Cancer Center Institutional Grant (YCK) and NIH grant CA180008 (SMW). JC and FX are the recipients of Chinese Scholar Council Fellowship.
Author information
Authors and Affiliations
Contributions
Y.C.K. performed bioinformatics data analysis. J.C., F.X. and B.D. performed experiments, J.L. and J.C. performed statistical analysis. Y.C.K. and S.M.W. conceived the study and designed the experiment, S.M.W. wrote the manuscript.
Corresponding authors
Ethics declarations
Competing interests
The authors declare no competing financial interests.
Rights and permissions
This work is licensed under a Creative Commons Attribution 4.0 International License. The images or other third party material in this article are included in the article’s Creative Commons license, unless indicated otherwise in the credit line; if the material is not included under the Creative Commons license, users will need to obtain permission from the license holder to reproduce the material. To view a copy of this license, visit http://creativecommons.org/licenses/by/4.0/
About this article

Cite this article
Kim, Y., Cui, J., Luo, J. et al. Exome-based Variant Detection in Core Promoters. Sci Rep 6, 30716 (2016). https://doi.org/10.1038/srep30716
Received:
Accepted:
Published:
DOI: https://doi.org/10.1038/srep30716
This article is cited by
Comments
By submitting a comment you agree to abide by our Terms and Community Guidelines. If you find something abusive or that does not comply with our terms or guidelines please flag it as inappropriate.
