
Abstract
Serology has become an increasingly important tool for the surveillance of a wide range of infectious diseases. It has been particularly useful to monitor malaria transmission in elimination settings where existing metrics such as parasite prevalence and incidence of clinical cases are less sensitive. Seroconversion rates, based on antibody prevalence to Plasmodium falciparum asexual blood-stage antigens, provide estimates of transmission intensity that correlate with entomological inoculation rates but lack precision in settings where seroprevalence is still high. Here we present a new and widely applicable method, based on cross-sectional data on individual antibody levels. We evaluate its use as a sero-surveillance tool in a Tanzanian setting with declining malaria prevalence. We find that the newly developed mathematical models produce more precise estimates of transmission patterns, are robust in high transmission settings and when sample sizes are small and provide a powerful tool for serological evaluation of malaria transmission intensity.
Introduction
In order to reduce the global malaria burden and achieve control, or even elimination, robust estimates of malaria transmission intensity are required for the strategic planning, implementation and evaluation of interventions1,2,3,4. Efficient monitoring of malaria transmission intensity depends on tools that produce reliable estimates across a wide range of transmission settings5,6. Such tools should preferably integrate information about both parasite and vector populations to capture the current level of transmission intensity as well as the transmission potential in areas where parasite carriage has decreased but vector populations persist6,7,8,9.
Traditionally, transmission intensity has been estimated by a variety of techniques such as spleen rates, parasite prevalence or entomological inoculation rates (EIR)2. EIR has been considered the gold standard among metrics10, but is expensive and labour intensive to evaluate and estimates are often imprecise (especially when transmission is low) due to marked heterogeneity of both malaria transmission and vector distribution10,11,12. In addition, single-time point evaluation of parasite prevalence or EIR provides limited information about past transmission intensity13,14. Cumulative exposure to P. falciparum, however, can be estimated by evaluation of antibody responses to P. falciparum blood-stage antigens15,16,17. In addition, exposure to Anopheles mosquitoes can be evaluated through antibody responses to An. gambiae salivary gland protein 6 (gSG6)18,19,20.
Existing methods for serological evaluation of malaria transmission have largely been based on cross-sectional data on antibody prevalence and on estimation of seroconversion rates (SCR) using serocatalytic models as shown by Drakeley et al.15. Although SCR based estimates have been extended to evaluate temporal changes21,22,23 and provide robust information about medium and long-term trends of transmission intensity, they are insensitive to changes in high transmission settings and to smaller and more short-term trends due to the quick acquisition of antibody responses and the long half-life of seropositivity to many blood-stage antigens15,24,25. The sensitivity and precision can be improved by selecting antigens that are less immunogenic or to which seropositivity is more short-lived15,26 and, as duration of seropositivity appears to be age-dependent27, by focusing analysis on antibody responses among children only and by using data from multiple cross-sectional surveys28. Nonetheless, recent changes in exposure and changes occurring in high exposure settings, are better reflected by population antibody levels29,30,31. SCR based estimates could potentially be further improved by the application of a model that makes use of the data on individual antibody levels by assuming that antibody levels increase as a function of age and that the rate at which they are boosted by exposure can be used as a marker of transmission intensity.
Here we aim to improve serological estimates of malaria transmission intensity by developing new models based on cross-sectional data on individual antibody levels. We evaluate transmission changes in a rural Tanzanian village that has experienced a gradual decline of P. falciparum prevalence from 1985 to 2010, but where lack of surveillance between 2000 and 2009 hinders efforts to fully elucidate patterns of malaria transmission intensity32 (Fig. 1). To maximise the sensitivity to detect transmission changes, we included children 1–16 years old participating in cross-sectional surveys conducted in 1999 (n = 313) and 2010 (n = 355) and measured antibody responses to recombinant P. falciparum antigens (MSP-1, MSP-2, MSP-3, AMA-1) and gSG6. P. falciparum antigens were selected based on previous evaluation with serocatalytic models15,20,27. We compare the performance of the newly developed models, referred to as antibody acquisition models, to previously validated serocatalytic models. We show that the antibody acquisition models increase precision in transmission estimates and provide a powerful and widely applicable new tool for serological surveillance of malaria transmission dynamics.

All age parasite prevalence in Nyamisati 1985–2010 by microscopy and species specific real-time PCR32.
(*) Microscopy prevalence in 2010 was estimated from PCR data using the prevalence estimation tool developed by Okell et al. Nat Commun. 2012. Arrows indicate the time-points for distribution of insecticide treated nets (ITNs) and long-lasting insecticidal nets (LLINs).
Results
The prevalence of P. falciparum infection in children age 1–16 was 77.1% (95% CI: 71.2, 81.8) in 1999 and 23.7% (95% CI: 15.7, 24.3) in 2010 when evaluated by real-time PCR32. We defined the threshold for seropositivity as the mean reactivity, plus three standard deviations, of sera from unexposed Swedish donors (see Methods). In addition, we evaluated an alternative threshold for seropositivity defined using finite mixture models (see Methods). Results from serocatalytic models fitted to seroprevalence data based on the alternative threshold are presented in full as supplementary information. For all antigens, both prevalence (χ2-test: all P < 0.001) and levels (Mann-Whitney-U-test: all P <0.001) of antibodies were higher in 1999 than 2010. Seroprevalence and levels of antibodies to P. falciparum antigens increased with age at both surveys, except for MSP-119, MSP-3_3D7 and MSP-3_k1 in the 2010 cross-section where levels were similar across age groups. Seroprevalence and antibody levels to gSG6 did not show discernible age trends at either survey. Data on antibody levels were approximately log-normally distributed for all antigens (see Supplementary Fig. S3 online) and highly correlated between the two allelic variants of AMA-1 and MSP-3, while less correlated for MSP-2 (see Supplementary Fig. S4 online).
Modelling serological data
Based on our previous knowledge of the gradual reduction in parasite prevalence in Nyamisati32 (Fig. 1), we considered three functional forms for the changing pattern of malaria transmission over time: (i) constant transmission; (ii) a sharp stepwise reduction; (iii) a linear decline. The serocatalytic models and the new antibody acquisition models were fitted to the data for each antigen and transmission profile using maximum-likelihood estimation (see Methods). For each individual antigen and transmission pattern, models were fitted simultaneously to data from the two cross-sectional surveys.
Serocatalytic models
In Fig. 2 we present age-seroprevalence plots and the three models fitted for each of the antigens at both cross-sections. Estimates of SCR (λ) and seroreversion rates (ρ) for each model and antigen are presented in Table 1 together with the estimated time (tc) and magnitude of reduction (γ). As expected, model 1 provided poor fit to data for all antigens and a visual assessment of the fitted models in the age-seroprevalence plots indicated that model 1 underestimated the proportion of seropositives in 1999 while simultaneously overestimating the proportion of seropositives in 2010 (Fig. 2). The stepwise decrease model (model 2) estimated an approximate 44–79% reduction of SCR for P. falciparum antigens from 1983–2010 (Table 1). The reduction was estimated to have occurred between 1997 and 2007, with most point estimates clustered between 1997 and 2000 (Table 1, Fig. 3a). AMA-1_3D7, AMA-1_FVO and MSP-3_K1 provided precise estimates of “time of change” (tc) whereas estimates from MSP-119, MSP-2_Dd2, MSP-2_CH150/9 and MSP-3_3D7 and gSG6 showed substantial uncertainty (Table 1). Model 3 estimated high initial SCRs in 1983 and large reductions for all antigens between 1983 and 2010. The estimated reduction ranged from 65–96% for the P. falciparum antigens (Table 1, Fig. 3a). Model comparison using the Akaike Information Criterion (AIC) revealed that models 2 and 3, which capture reductions in transmission, provide considerably better fits to the data than model 1 (Table 1). According to the classification suggested by Burnham and Anderson33 (∆AIC < 2: substantial support for alternative models; ∆AIC = 4–7: considerably less support; ∆AIC > 10: no support), there was sufficient information only to determine that model 2 was the superior model for AMA-1 and MSP-3_k1 whereas for the other antigens, AIC-values were similar between models 2 and 3 (Table 1). Serocatalytic models fitted to seroprevalence data based on the alternative threshold for seropositivity estimated lower SCR and higher seroreversion rates, but results were in all other aspects similar and the alternative choice of threshold did not affect model performance (see Supplementary Fig. S5 and Supplementary Table S1 online).

Best-fit serocatalytic models.
Black points denote the proportion of seropositive individuals and vertical bars denote 95% confidence intervals. Model 1: stable transmission (solid lines). Model 2: stepwise reduction in transmission (dotted lines). Model 3: linear reduction in transmission (dashed lines).

(a) Estimated changes in historical transmission from serocatalytic models (model 2 and model 3). (b) Estimated changes in historical transmission from antibody acquisition models (model 2 and model 3).
Antibody acquisition models
Antibody acquisition models were designed to capture the rate of increase in antibody levels with age and provide an alternative measure of transmission intensity. Age group-specific geometric mean antibody levels and the antibody acquisition models fitted to data for each of the antigens are presented in Fig. 4. Maximum likelihood parameter estimates of antibody acquisition (a) and decay rates (r), timing (tc) and magnitude of reduction (γ) are shown in Table 2. Model 2 (i.e. stepwise decrease model) provided superior fit to data (with the lowest AIC values) compared to both model 3 and model 1 for all P. falciparum antigens (Table 2). Model 2 estimated reductions of antibody acquisition rates for P. falciparum antigens ranging from 72–92% between 1983 and 2010 (Table 2, Fig. 3b) with a stepwise reduction estimated to have occurred between 1997 and 1999 for antigens AMA-1_FVO, AMA-1_3D7, MSP-2_Dd2, MSP-2_CH150/9 and MSP-3_K1 (Table 2, Fig. 3b). MSP-119 and MSP-3_3D7, showing no age-trend in antibody levels at the second cross-section, as well as gSG6, with no age-trend at either cross-section, each provided estimates with considerable uncertainty (Table 2, Fig. 3b). Model 3 estimated reductions of antibody acquisition rates from 41–100%, approaching 100% for several of the P. falciparum antigens (AMA-1_3D7, AMA-1_FVO, MSP-119, MSP-2_Dd2 and MSP-2_CH150/9), indicating zero transmission in 2010 and thus a poor choice of pattern of transmission intensity (Table 2, Fig. 3b).

Best-fit antibody acquisition models.
Black points denote geometric mean antibody levels in arbitrary units (AU) and vertical bars denote the 95% range of the data. Model 1: stable transmission (solid lines). Model 2: stepwise reduction in transmission (dotted lines). Model 3: linear reduction in transmission (dashed lines).
Model comparison: Antibody acquisition models versus serocatalytic models
The serocatalytic models use continuous antibody data that has been dichotomised while the antibody acquisition models use data on the actual individual antibody level and age. The different types of data restrict a formal statistical comparison; however, the performance of the models can be evaluated and compared using profile likelihood plots (see Supplementary Information online). The antibody acquisition models generally provided a better and more consistent fit to data than the serocatalytic models. The difference is evident from the profile likelihood plots, in particular for the parameter “time of change” (tc) for serocatalytic and antibody acquisition model 2 (see Supplementary Fig. S1 and S2 online). Although the point estimates of parameter tc were overall similar for both serocatalytic and antibody acquisition models, the larger amount of data utilised by the antibody acquisition models gave better fit and provided higher precision of the estimates as indicated by the much more narrow confidence intervals (Table 1 and 2).
We performed a complementary sensitivity analysis (see Supplementary Figs S6 and S7 online), using both simulated data and the data for AMA-1_FVO, to evaluate the robustness of serocatalytic and antibody acquisition model 2 to reductions in the sample size. Reductions in sample size (e.g. to 100 or 50 samples per cross-section) reduced both accuracy and precision of serocatalytic model estimates of parameter tc whereas it only slightly affected the precision of the antibody acquisition model, illustrating the robustness of the antibody acquisition model.
Discussion
From 1985 to 2010, the population of Nyamisati village experienced a gradual decline of P. falciparum prevalence, but lack of surveillance between 1999 and 2010 hinders efforts to elucidate patterns of malaria transmission intensity and thereby to identify factors that have contributed to the decline32. Through mathematical modelling of serological data, we evaluate historical transmission patterns and confirm a reduction in P. falciparum transmission intensity. Serocatalytic models indicated a decrease of malaria transmission intensity but could not determine if the reduction pattern was more likely to be stepwise or linear. The new antibody acquisition models, using the complete data on antibody levels, increase both power and precision and enabled us to establish that a stepwise reduction in transmission decrease was most likely.
The two modelling approaches have strengths and weaknesses, which are outlined in Table 3. In high and moderate transmission settings, serocatalytic models are often limited by the long half-life of seropositivity and a plateau of very high seroprevalence reached already among young children6. This is likely to have contributed to the uncertainty of serocatalytic model parameter estimates in the present study. However, population antibody levels do not saturate as seroprevalence does and if transmission is reduced antibody levels will drop while seropositivity remains high29,31,34,35. The antibody acquisition models incorporate insights from longitudinal antibody dynamics31 and limit the loss of information that occurs when continuous antibody data is dichotomised36, thereby providing additional power to detect changes in transmission intensity. The antibody acquisition models performed better than the corresponding serocatalytic models in this context of high to moderate transmission intensity. Both serocatalytic and antibody acquisition model 2 provided point-estimates of “time of change” (tc) that, for the majority of the antigens, clustered around 1997 to 2000. However, the antibody acquisition model provided more precise estimates, due to a higher power to detect changes when seroprevalence is high22,29.
Exact determination of transmission dynamics requires frequent and longitudinal sampling. However, here, as well as in many other settings, we are limited to cross-sectional data from single or only a few time-points. The presented models are plausible simplifications of the dynamics of transmission intensity in Nyamisati; nonetheless, they provide robust estimates of transmission intensity patterns. The 72–92% stepwise reduction of malaria transmission intensity, estimated by both serocatalytic and antibody acquisition models to have occurred around 1998 to 1999, coincided with the distribution of ITNs after the cross-sectional survey in 1999. The actual ITN coverage after the intervention is not known, however, the distribution of 900 bed nets in a population of approximately 1500 individuals would have provided more or less universal coverage (assuming one net protects 1.8 individuals37). Although parasite prevalence in Nyamisati decreased gradually during the late 1980’s and early1990’s32 and although factors other than the introduction of short-lasting ITNs could have contributed to the low level of P. falciparum and Anopheles exposure observed in Nyamisati in 20109, our results strongly support that the single largest change in transmission intensity is related to the distribution of ITNs in 1999.
The lack of EIR data from the Nyamisati area is a limitation of the study. We therefore used gSG6 antibody responses as a proxy for vector exposure19,20. Antibody responses to gSG6 did not show any significant increase with age but the the age-dependent tolerance that has been shown elsewhere was not observed38. The lack of an age trend may be related to the short-lived nature of the response39 and limits their value in analysis using the present modelling approach. Nonetheless, we observe a significant reduction of both overall prevalence and levels of antibodies to gSG6 from 1999 to 2010 suggesting a substantial reduction of Anopheles exposure in Nyamisati.
The inclusion of antigens that have been previously evaluated in serocatalytic models15,23,27 allows us to compare the value of these antigens when using antibody acquisition models. MSP-119 has been proposed suitable for a wide range of transmission intensities21, while the more immunogenic AMA-1 suggested for low transmission settings21,27. Here, antibody responses to MSP-119 and MSP-3 antigens were not particularly informative. The lack of age trend in antibody data for these antigens in this setting, particularly at the second cross-section is a major limitation for their use in both the serocatalytic and the antibody acquisition models and affects both accuracy and precision of model parameter estimates. For the MSP-2 proteins, antibody acquisition models, but not serocatalytic models, provided parameter estimates with a low level of uncertainty. A relatively low correlation of MSP-2_Dd2 and MSP-2_CH150/9 responses was observed and the highly polymorphic nature of the protein may pose a problem in some settings40. AMA-1 provided the most precise parameter estimates and the most consistent results between both the serocatalytic and antibody acquisition models. There was little saturation of AMA-1 antibody levels with increasing age and a high correlation between responses to the two allelic variants. These findings indicate the suitability of AMA-1 for a wide range of transmission settings when applying both serocatalytic and antibody acquisition models.
Antibody prevalence data has been used successfully to model the force of infection of malaria in different settings15,21,22,23 as well as several other infectious diseases, e.g. dengue41,42 and trachoma43. Estimates of malaria SCR based on longitudinal and cross-sectional data have been shown to provide consistent results44. Here we describe how cross-sectional data on antibody levels can be used to model malaria transmission intensity by assuming that the rate at which antibody levels are acquired and decay can be used as a marker for transmission intensity. The method was designed for malaria but can be applied to other pathogens. We show that the use of antibody acquisition models, which limits the loss of information and increases statistical power, enables sensitive detection of transmission changes and improves precision in estimates of malaria transmission intensity trends. We conclude that the new antibody acquisition models provide superior precision compared to serocatalytic models in settings of moderate and intense transmission where seroprevalence is high. We propose that the antibody acquisition models provide a new powerful tool for serological surveillance of short-, medium- and long-term trends of malaria transmission and highlight their potential for infectious disease surveillance.
Material and Methods
Study site and cohort
The study site, cohort and malaria prevalence in the area have been recently described in detail32. Briefly, the study was conducted in Nyamisati, a rural fishing village situated in the Rufiji river delta, Tanzania, where malaria transmission is perennial with some increase following the two rainy seasons. The predominant malaria vectors in the area were species belonging to the An. gambiae complex as well as An. funestus45. A research team monitored malaria transmission and maintained a primary health care unit from 1985 until 2000. All malaria cases were continuously recorded through a passive case detection system 1986–88 and 1993–99. Cross-sectional surveys were performed yearly from 1985 to 1988, from 1993 to 1999 and in 2010. Surveys were conducted at the start of the major rainy season and included clinical examination and collection of venous blood samples. There was no malariometric surveillance between 2000 and 2009. Insecticide treated nets (ITNs) were distributed after the surveys in 1993 (300 ITNs to pregnant women and young children) and in 1999 (900 ITNs). The estimated access to bed nets after the surveys, assuming average protection of 1.8 individuals per net37, was 3% in 1985, 45% in 1993–1994 and 100% in 1999. Additionally, long-lasting insecticidal nets were distributed after the survey in 2010. Indoor residual spraying has not been used in the area. EIR data has not been collected at the study site. Prevalence of P. falciparum declined gradually from 1985 to 2010 (Fig. 1). Prevalence by microscopy decreased from 1985 to 1999, with only minor changes in real-time PCR prevalence. A large reduction in parasite prevalence by PCR was observed from 1999 to 201032. To maximise the sensitivity to detect transmission changes, children (1–16 years of age) participating in two cross-sectional surveys conducted in 1999 (n = 313) and 2010 (n = 355), were included in the present study27,28. Children below 1 years of age were excluded due to the potential presence of maternal antibodies.
Ethical approval was obtained from the Nyamisati village board, the Ethical Review board of the National Institute for Medical Research in Tanzania and by the Regional Ethical Committee at Karolinska Institutet, Sweden (Dnr. 00–084 and 2012/1151–32). Informed consent was obtained from each participant and/or their guardians and experiments were carried out in accordance with approved guidelines.
Antibody assays
Detection and quantitation of IgG antibodies against P. falciparum antigens and gSG6 were performed using a multiplex bead based immunoassay46 and ELISA19,47, respectively. The recombinant P. falciparum antigens included the 19 kDa fragment of merozoite surface protein 1 (MSP-119)48, two allelic forms of each of merozoite surface protein 2 (MSP-2) (CH150/9 and Dd2)49, merozoite surface protein 3 (MSP-3) (K1 and 3D7)50 and apical membrane antigen 1 (AMA-1) (3D7 and FVO)51. The threshold for seropositivity was defined as the mean fluorescent intensity (MFI), or mean optical density (OD), plus three standard deviations of a negative control of pooled plasma from malaria unexposed Swedish donors. MFIs and ODs were converted to a relative concentration in arbitrary units (AU) using IgG standards run on each plate (see Supplementary Information online).
An alternative threshold for seropositivity was defined by fitting finite mixture models52,53 to the log-transformed antibody data distributions assuming a two-component Gaussian mixture according to a previously described method (see Supplementary Information online)23,54,55.
Antibody models
Serocatalytic models
Cross-sectional data on age-specific prevalence and levels of antibodies from children 1–16 years old are assumed to represent cumulative exposure to the antigen during the child’s lifespan, thereby allowing us to estimate transmission patterns during the 16-year period prior to each cross-section. Serological data on children aged 1–16 from two cross-sections in 1999 and 2010, provide information on transmission from 1983 to 1999 for cross-section 1 and from 1994 to 2010 for cross-section 2. Denote t to be the time after the start of the transmission period (in 1983) and tend the time at the end of the period (in 2010). We use the seroconversion rate λ as a marker for transmission intensity15,21. We consider three profiles for changes in transmission intensity over this time period:
-
Model 1: Constant transmission

-
Model 2: Sharp drop in transmission at time tc

-
Model 3: Linear reduction in transmission


If seronegative individuals become seropositive at rate λ(t) and if seropositive individuals revert at rate ρ, then the proportion of seropositive individuals in a cohort P is described by the differential equation

This equation can be solved for the three transmission profiles to give estimates of the proportion of individuals of age a seropositive at each cross-section.
-
Model 1: Constant transmission

-
Model 2: Sharp drop in transmission at time tc

where ac is the age of the child at the time of the drop in transmission (ac = a + tc − 16 for children from cross-section 1 and ac = a + tc − 27 for children from cross-section 2)
-
There is no analytical solution for Model 3 so it must be solved numerically


The magnitude of the reduction in seroconversion rate is defined as γ (=λc/λ0).
The serocatalytic model was fitted to age-dependent data on sero-positivity status using a binomial likelihood function. The log-likelihood was maximised to obtain the maximum likelihood parameter estimate (see Supplementary Information online). 95% confidence intervals were calculated using the likelihood ratio test. Profile likelihood plots are presented in Supplementary Figure S1 online.
Antibody acquisition models
In the serocatalytic models described above all data on the continuous antibody levels has been reduced to a dichotomous positive or negative value. Here, we describe how the full data on antibody levels can be utilised. We assume that the rate at which antibody levels are acquired α can be used as a marker for transmission intensity31. If an individual’s antibody level is boosted at rate α(t) and decays at rate r then antibody levels can be described by the following differential equation

We assume α(t) corresponds to the three transmission profiles outlined above.
-
Model 1: Constant transmission

-
Model 2: Sharp drop in transmission at time tc
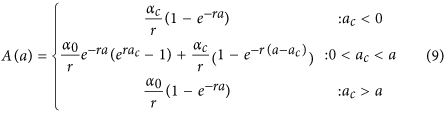
where ac is the age of the child at the time of the drop in transmission.
-
Model 3: Linear reduction in transmission


The magnitude of reduction in antibody acquisition rates is defined as γ ( = αc/α0).
The antibody acquisition model was fitted to age-dependent antibody level data from both cross-sections by assuming the geometric mean antibody level at age a is A(a) and that antibody levels are log-normally distributed in the cohort with standard deviation on the log scale σ. The log-likelihood was maximised to obtain the maximum likelihood parameter estimate (see Supplementary Information online). 95% confidence intervals were calculated using the likelihood ratio test. Profile likelihood plots are presented in Supplementary Figure S2 online.
Additional Information
How to cite this article: Yman, V. et al. Antibody acquisition models: A new tool for serological surveillance of malaria transmission intensity. Sci. Rep. 6, 19472; doi: 10.1038/srep19472 (2016).
References
Bousema, T. et al. Identification of hot spots of malaria transmission for targeted malaria control. J. Infect. Dis. 201, 1764–1774 (2010).
Hay, S. I., Smith, D. L. & Snow, R. W. Measuring malaria endemicity from intense to interrupted transmission. Lancet Infect. Dis. 8, 369–378 (2008).
Moonen, B. et al. Operational strategies to achieve and maintain malaria elimination. Lancet 376, 1592–1603 (2010).
Cohen, J. M., Moonen, B., Snow, R. W. & Smith, D. L. How absolute is zero ? An evaluation of historical and current definitions of malaria elimination. Malar. J. 9, 213 (2010).
The malERA Consultative Group on Monitoring Evaluation and Surveillance. A research agenda for malaria eradication: monitoring, evaluation and surveillance. PLoS Med. 8, e1000400 (2011).
Tusting, L. S., Bousema, T., Smith, D. L. & Drakeley, C. Measuring changes in Plasmodium falciparum transmission: precision, accuracy and costs of metrics. Adv. Parasitol. 84, 151–208 (2014).
Smith, D. L., McKenzie, F. E., Snow, R. W. & Hay, S. I. Revisiting the basic reproductive number for malaria and its implications for malaria control. PLoS Biol. 5, e42 (2007).
Burkot, T. R. & Graves, P. M. The value of vector-based estimates of malaria transmission. Ann. Trop. Med. Parasitol. 89, 125–134 (1995).
Killeen, G. F. et al. Eliminating malaria vectors. Parasit. Vectors 6, 172 (2013).
Hay, S. I., Rogers, D. J., Toomer, J. F. & Snow, R. W. Annual Plasmodium falciparum entomological inoculation rates (EIR) across Africa: literature survey, Internet access and review. Trans. R. Soc. Trop. Med. Hyg. 94, 113–127 (2000).
Mbogo, C. M. et al. Spatial and temporal heterogeneity of Anopheles mosquitoes and Plasmodium falciparum transmission along the Kenyan coast. Am. J. Trop. Med. Hyg. 68, 734–742 (2003).
Bejon, P. et al. Serological evidence of discrete spatial clusters of Plasmodium falciparum parasites. PLoS One 6, e21711 (2011).
O’Meara, W. P., Collins, W. E. & McKenzie, F. E. Parasite prevalence: a static measure of dynamic infections. Am. J. Trop. Med. Hyg. 77, 246–249 (2007).
Smith, D. L., Dushoff, J., Snow, R. W. & Hay, S. I. The entomological inoculation rate and Plasmodium falciparum infection in African children. Nature 438, 492–495 (2005).
Drakeley, C. J. et al. Estimating medium- and long-term trends in malaria transmission by using serological markers of malaria exposure. Proc. Natl. Acad. Sci. USA 102, 5108–5113 (2005).
Grab, B. & Pull, J. H. Statistical considerations in serological surveys of population with particular reference to malaria. J. Trop. Med. Hyg. 77, 222–232 (1974).
Drakeley, C. & Cook, J. Chapter 5. Potential contribution of sero-epidemiological analysis for monitoring malaria control and elimination: historical and current perspectives. Adv. Parasitol. 69, 299–352 (2009).
Ribeiro, J. M. C., Mans, B. J. & Arcà, B. An insight into the sialome of blood-feeding Nematocera. Insect Biochem. Mol. Biol. 40, 767–784 (2010).
Rizzo, C. et al. Wide cross-reactivity between Anopheles gambiae and Anopheles funestus SG6 salivary proteins supports exploitation of gSG6 as a marker of human exposure to major malaria vectors in tropical Africa. Malar. J. 10, 206 (2011).
Badu, K. et al. Serological evidence of vector and parasite exposure in Southern Ghana: the dynamics of malaria transmission intensity. Parasit. Vectors 8, 251 (2015).
Corran, P., Coleman, P., Riley, E. & Drakeley, C. Serology: a robust indicator of malaria transmission intensity ? Trends Parasitol. 23, 575–582 (2007).
Stewart, L. et al. Rapid assessment of malaria transmission using age-specific sero-conversion rates. PLoS One 4, e6083 (2009).
Cook, J. et al. Using serological measures to monitor changes in malaria transmission in Vanuatu. Malar. J. 9, 169 (2010).
Bruce-Chwatt, L. J., Draper, C. C. & Konfortion, P. Seroepidemiological evidence of eradication of malaria from Mauritius. Lancet 2, 547–551 (1973).
Wong, J. et al. Serological markers for monitoring historical changes in malaria transmission intensity in a highly endemic region of Western Kenya, 1994-2009. Malar. J. 13, 451 (2014).
Kusi, K. A. et al. Anti-sporozoite antibodies as alternative markers for malaria transmission intensity estimation. Malar. J. 13, 103 (2014).
Ondigo, B. N. et al. Estimation of Recent and Long-Term Malaria Transmission in a Population by Antibody Testing to Multiple Plasmodium falciparum Antigens. J. Infect. Dis. 210, 1123–1132 (2014).
Ceesay, S. J. et al. Continued decline of malaria in The Gambia with implications for elimination. PLoS One 5, e12242 (2010).
Cornille-Brögger, R. et al. Changing patterns in the humoral immune response to malaria before, during and after the application of control measures: a longitudinal study in the West African savanna. Bull. World Health Organ. 56, 579–600 (1978).
Cook, J. et al. Serological markers suggest heterogeneity of effectiveness of malaria control interventions on Bioko Island, equatorial Guinea. PLoS One 6, e25137 (2011).
White, M. T. et al. Dynamics of the antibody response to Plasmodium falciparum infection in African children. J. Infect. Dis. 210, 1115–1122 (2014).
Färnert, A. et al. Epidemiology of malaria in a village in the Rufiji River Delta, Tanzania: declining transmission over 25 years revealed by different parasitological metrics. Malar. J. 13, 459 (2014).
Burnham, K. & Anderson, D. Model selection and multimodel inference: a practical information-theoretic approach. (Springer-Verlag New York, Inc, 2002).
Akpogheneta, O. J. et al. Duration of naturally acquired antibody responses to blood-stage Plasmodium falciparum is age dependent and antigen specific. Infect. Immun. 76, 1748–1755 (2008).
Kinyanjui, S. M., Bull, P., Newbold, C. I. & Marsh, K. Kinetics of antibody responses to Plasmodium falciparum-infected erythrocyte variant surface antigens. J. Infect. Dis. 187, 667–674 (2003).
Fedorov, V., Mannino, F. & Zhang, R. Consequences of dichotomization. Pharm. Stat. 8, 50–61 (2009).
Kilian, A., Boulay, M., Koenker, H. & Lynch, M. How many mosquito nets are needed to achieve universal coverage ? Recommendations for the quantification and allocation of long-lasting insecticidal nets for mass campaigns. Malar. J. 9, 330 (2010).
Rizzo, C. et al. Differential antibody response to the Anopheles gambiae gSG6 and cE5 salivary proteins in individuals naturally exposed to bites of malaria vectors. Parasit. Vectors 7, 549 (2014).
Rizzo, C. et al. Humoral response to the Anopheles gambiae salivary protein gSG6: a serological indicator of exposure to Afrotropical malaria vectors. PLoS One 6, e17980 (2011).
Felger, I., Steiger, S., Hatz, C., Smith, T. & Beck, H.-P. Antigenic cross-reactivity between different alleles of the Plasmodium falciparum merozoite surface protein 2. Parasite Immunol. 25, 531–543 (2004).
Rodriguez-Barraquer, I. et al. From re-emergence to hyperendemicity: the natural history of the dengue epidemic in Brazil. PLoS Negl. Trop. Dis. 5, e935 (2011).
Reiner, R. C. et al. Time-varying, serotype-specific force of infection of dengue virus. Proc. Natl. Acad. Sci. USA. 111, E2694–2702 (2014).
Martin, D. L. et al. Serology for trachoma surveillance after cessation of mass drug administration. PLoS Negl. Trop. Dis. 9, e0003555 (2015).
Arnold, B. F. et al. Serological measures of malaria transmission in Haiti: comparison of longitudinal and cross-sectional methods. PLoS One 9, e93684 (2014).
Kigadye, E., Nkwengulila, G., Magesa, S. M. & Abdulla, S. Spatial variability in the density, distribution and vectorial capacity of anopheline species in a high transmission district in Tanzania. Tanzan. J. Health Res. 13, 1–6 (2011).
Rono, J. et al. Breadth of anti-merozoite antibody responses is associated with the genetic diversity of asymptomatic Plasmodium falciparum infections and protection against clinical malaria. Clin. Infect. Dis. 57, 1409–1416 (2013).
Bolad, A. et al. Distinct interethnic differences in immunoglobulin G class/subclass and immunoglobulin M antibody responses to malaria antigens but not in immunoglobulin G responses to nonmalarial antigens in sympatric tribes living in West Africa. Scand. J. Immunol. 61, 380–386 (2005).
Burghaus, P. A. & Holder, A. A. Expression of the 19-kilodalton carboxy-terminal fragment of the Plasmodium falciparum merozoite surface protein-1 in Escherichia coli as a correctly folded protein. 64, 165–169 (1994).
Taylor, R. R., Smith, D. B., Robinson, V. J., McBride, J. S. & Riley, E. M. Human antibody response to Plasmodium falciparum merozoite surface protein 2 is serogroup specific and predominantly of the immunoglobulin G3 subclass. Infect. Immun. 63, 4382–4388 (1995).
Polley, S. D. et al. Plasmodium falciparum merozoite surface protein 3 is a target of allele-specific immunity and alleles are maintained by natural selection. J. Infect. Dis. 195, 279–287 (2007).
Polley, S. D. et al. Human antibodies to recombinant protein constructs of Plasmodium falciparum Apical Membrane Antigen 1 (AMA1) and their associations with protection from malaria. Vaccine 23, 718–728 (2004).
R. Core Team (2015). R: A language and environment for statistical computing. R Foundation for Statistical Computing, Vienna, Austria. URL https://www.R-project.org/.
Benaglia, T., Chauveau, D., Hunter, D. R. & Young, D. mixtools : An R package for analyzing finite mixture models. J. Stat. Softw. 32, 1–29 (2009).
Nagelkerke, N. J., Borgdorff, M. W. & Kim, S. J. Logistic discrimination of mixtures of M. tuberculosis and non-specific tuberculin reactions. Stat. Med. 20, 1113–1124 (2001).
Corran, P. H. et al. Dried blood spots as a source of anti-malarial antibodies for epidemiological studies. Malar. J. 7 (2008).
Acknowledgements
We thank the Nyamisati community for their engagement in this work and for participating in the cross-sectional surveys. We thank the Nyamisati research team, particularly Leah Mhoja, Salome Jesaja and Marita Johansson. We thank Professor Zul Premji for his support of the project.The work was supported by the Swedish Research Council (grant number: 2012-3311) and the Marianne and Marcus Wallenberg Foundation (grant number: MMW2010.0067). MTW was supported by a Population Health Scientist Fellowship from the MRC.
Author information
Authors and Affiliations
Contributions
V.Y., M.T.W. and A.F. planned and designed the study. I.R. established the cohort and conducted the cross-sectional surveys. J.R., B.A., F.O., S.B., M.T.B. and R.R. provided reagents and expertise regarding the serological analyses. V.Y. and J.R. performed the serological analyses. M.T.W. developed the antibody acquisition models. V.Y. and M.T.W. collated and analysed the data. V.Y., M.T.W. and A.F. drafted the manuscript. All authors contributed to interpretation of data, writing and revising the manuscript and have seen and approved the final version.
Ethics declarations
Competing interests
The authors declare no competing financial interests.
Electronic supplementary material
Rights and permissions
This work is licensed under a Creative Commons Attribution 4.0 International License. The images or other third party material in this article are included in the article’s Creative Commons license, unless indicated otherwise in the credit line; if the material is not included under the Creative Commons license, users will need to obtain permission from the license holder to reproduce the material. To view a copy of this license, visit http://creativecommons.org/licenses/by/4.0/
About this article

Cite this article
Yman, V., White, M., Rono, J. et al. Antibody acquisition models: A new tool for serological surveillance of malaria transmission intensity. Sci Rep 6, 19472 (2016). https://doi.org/10.1038/srep19472
Received:
Accepted:
Published:
DOI: https://doi.org/10.1038/srep19472
This article is cited by
-
Monitoring transmission intensity of trachoma with serology
Nature Communications (2023)
-
Characterization of Anopheles gambiae D7 salivary proteins as markers of human–mosquito bite contact
Parasites & Vectors (2022)
-
Identification of factors associated with residual malaria transmission using school-based serological surveys in settings pursuing elimination
Malaria Journal (2022)
-
A threshold-free approach with age-dependency for estimating malaria seroprevalence
Malaria Journal (2022)
-
Distinct kinetics of antibodies to 111 Plasmodium falciparum proteins identifies markers of recent malaria exposure
Nature Communications (2022)
Comments
By submitting a comment you agree to abide by our Terms and Community Guidelines. If you find something abusive or that does not comply with our terms or guidelines please flag it as inappropriate.
