
Abstract
Every day we are exposed to different ideas, or memes, competing with each other for our attention. Previous research explained popularity and persistence heterogeneity of memes by assuming them in competition for limited attention resources, distributed in a heterogeneous social network. Little has been said about what characteristics make a specific meme more likely to be successful. We propose a similarity-based explanation: memes with higher similarity to other memes have a significant disadvantage in their potential popularity. We employ a meme similarity measure based on semantic text analysis and computer vision to prove that a meme is more likely to be successful and to thrive if its characteristics make it unique. Our results show that indeed successful memes are located in the periphery of the meme similarity space and that our similarity measure is a promising predictor of a meme success.
Introduction
A meme has been defined as a cultural unit, an atomic cultural product that is used to build larger and more complex cultural organisms1,2,3,4. With the evolution of information and communication technology, millions of memes are produced every day5. Yet, only a handful reach a broad audience. The resource memes need is human attention, but this resource does not have an infinite supply. Memes have to compete with each other for it. Many works have investigated the dynamics of meme competition6,7,8,9,10,11,12,13,14,15. Our thesis is that uniqueness is an important factor for success. We show that memes at the periphery of the meme similarity space are more likely to go viral.
Understanding meme spread is both challenging and relevant. The evolution of our communication power has not only increased our cultural production capability, but also its tracking, studying and understanding of that power6,14,16,17,18,19,20. The challenge here is to quantitatively and objectively measure the potential reach and impact of ideas and behaviours. To do so would empower us to both favour the adoption of ideas carrying positive externalities8,9 and to limit the outbreak of potentially harmful social behaviours21,22. Studies have been devoted specifically to the detection of the most promising targets that can trigger a viral cascade23,24. Most works focus on providing an enhanced perspective on how social behaviours arise25,26,27, whether it is because of limited attention span7, the effect of the underlying social network11,12,13,28,29 or their geographical location30.
However, most research conducted so far suffers from two main drawbacks: first, the most used definition of “meme” is a relaxation of the concept as originally defined1 and second, in explaining the dynamics of meme success, the internal fitness of the meme is not disentangled from its social network location11,13. Data availability and representativeness is also an issue31,32. As a reaction, some attention has been devoted to the understanding of meme dynamics by either connecting them to the characteristics of the information passed through social connections33, or by abstracting from the social structures altogether34,35,36.
We propose a complementary point of view on explaining a meme's popularity, based on a stricter meme definition and on the analysis of the characteristics of the meme itself. The central concept driving our explanation of meme success is the one of meme similarity: to be successful a meme needs to be easily distinguishable from the other memes and it has to either create a new cultural niche, or occupy a vacant one. In37 meme similarity is evaluated too, but “meme” is defined without testing for fundamental meme characteristics such as reproduction and competition; in addition, no explanation of meme popularity has been investigated. Our focus on meme content is not isolated38,39, however in these cases the study is focused on different wording presenting the same content on Twitter, or a manual evaluation of content quality via a mechanical turk. To the best of our knowledge, nobody has attempted this task with a more rigorous meme definition, in isolation from social networks and using an objective way to decode meme content. In40, the explanatory power of content has been shown to be not very high. However, in40 the problem studied is slightly different, as the cascades studied are already happening. What authors want to explain is the size of the cascade, not the likelihood of a meme going viral. The methodology to handle meme content is also fundamentally different and less refined than the one presented here. We show that our similarity measure, without any further assumptions about social structure, user characteristics, or other exogenous factors, can partially account for a meme's success in a significant way.
Results
Here we firstly formally define the terminology we use in the rest of the paper. We then provide a collection of evidence sustaining our thesis that successful memes are the ones which tend to be dissimilar from all other memes. Finally, we develop a measure to evaluate the degree of uniqueness of a meme and we test the amount of variation it can explain in the success of memes, measured with the number of votes they can attract.
Definitions
In this work, we use the following definition of a meme:
Definition 1 (Meme)
A meme is a cultural unit defined by an atomic concept. A meme is identified by a name and a template and it can be implemented in different forms.
Following this definition, one meme could be a class of jokes about anything related to social clumsiness: it can be used to describe a social situation where a person misbehaved or she did not know how to properly react. This is an actual meme and, among all possible names, people on the Internet decided to call this meme “Socially Awkward Penguin”. Our meme definition requires us to define what a template and what a meme implementation are.
Definition 2 (Meme Template)
A meme template is a piece of information that is used as signature of the meme itself and it identifies it in an unambiguous way.
In this definition, it does not matter what is the piece of information we use to identify the meme. In some works37 it can be a hashtag in Twitter. For this paper, we decide to focus on those memes whose template is a picture. The established “Socially Awkward Penguin” template is a picture of a left-facing penguin in a blue field. Finally, we can define what a meme implementation is:
Definition 3 (Meme Implementation)
A meme implementation is any human expression that puts together the meme template and some additional information, whose meaning is semantically related to the meme concept.
In our case, a meme implementation is a short text superimposed to the meme template.
A word of caution is needed when we have to solve the problem of setting two memes apart. Formally, two memes are different when the atomic concept they carry is different. However, isolating the atomic concept requires to reach an agreement between all users of the meme. The task is not easy: just as in the case of genes41, the boundaries between two memes are fuzzy. There are examples of memes which are being used interchangeably, with users often complaining that the two memes are the same42. Since we are focusing on a single data source, we can use an approximation to solve this issue: two memes are set apart when they use different names and templates.
The temporal information allows us to study how a meme's success evolves over time. Later in the paper, we focus on a specific event in a meme's lifetime. To do so, we need to introduce two concepts: offspring and parent. Our assumption is that cultural products are rarely completely original. Therefore, every meme, to some extent, is derived from at least one other pre-existing meme. The pre-existing meme is called a parent. The derived meme is the parent's offspring. Hereafter, we use the following formal definitions of offspring and parent.
Definition 4 (Offspring)
 is the set of all memes.
  is the set of all memes that had an implementation at a timestep x ≤ t. Every meme
  (the set of the “original” memes present at timestep 0) is an offspring and the timestep t > 0 of its first implementation will be referred to as its appearance timestep.
For example, if a meme o has no implementation before February 2012 ( ), it means that o is an offspring with appearance time t = 4.
Definition 5 (Parent)
Consider an offspring o whose appearance timestep is t. The meme arg
 , i.e. the meme p for which the similarity function s
t
(the similarity function that considers only information generated at all timesteps t′ < t) is maximum, is the parent of o.
, i.e. the meme p for which the similarity function s
t
(the similarity function that considers only information generated at all timesteps t′ < t) is maximum, is the parent of o.
In the definition, the meme similarity function s is the one defined in the Methods section. Examples and explanations about the concepts defined in this section are provided in the Supplementary Material.
Similarity Map
We now define the shape of the meme similarity space. The meme similarity space is based on the meme similarity function s as defined in Methods. We calculate s for all meme pairs, resulting in the symmetric matrix S. Then, we create a network visualization of S. To increase readability, we impose the following constraints on the structure of the resulting graph: (i) it has to include all memes; (ii) it has to be composed by a single component; (iii) its edge density should not exceed the typical average degree of real world complex networks. The implemented procedure is a standard approach to visualize a matrix through a graph43. An analysis of the robustness of the network map and of the stability of the similarity measure used in the paper is provided in the Supplementary Material.
The result is depicted in Fig. 1 (left). Large successful memes tend to scatter in the outside of the network layout. There is a negative relationship between success and network centrality. We calculate such correlation and we report the results in Tab. I. Different network centrality measures and the number of instances and of votes of a meme per timestep present significant negative correlations.

The relationship between similarity and success.
(Left) The meme similarity space. Each node in the network is a meme. The size is proportional to the average number of implementations per timestep of the meme. Memes with more votes per timestep are coloured in orange, the opposite holds for nodes colored in light blue. Edge size and colour is proportional to the similarity between the memes. The network layout has been calculated with the spring embedded algorithm, from the software Cytoscape. No human intervention was involved in moving nodes. (Right) The relationship between similarity and success for all memes. Each area of the heat map reports how much unexpected are the observed memes with a given combination of average similarity (x axis) and popularity (y axis, average instances, above and votes, below, per timestep). For each cell we calculate the expected number of memes by shuffling randomly the similarity and popularity of all memes. The reported value is then the number of observed memes over the number of expected memes in the cell.
The result could be an artefact of our network visualization procedure. The network is in fact a visualization with the purpose of illustrating the point, not proving it. To prove it, we integrate the network visualization with the heat maps in Fig. 1 (right). The heat maps highlight that there is a highly unexpected number of memes with low average similarity and high popularity (top left of the map). On the other hand, there are no memes with high average similarity and high popularity (top right of the map).
Our interpretation of this collection of facts is the suggestion that success eschews similarity. We now explore what are possible mechanisms explaining this anti-correlation.
Meme Parenthood
In biological systems, successful genes are more likely to be passed to offspring and to mutate. In cultural systems, original ideas are likely to generate new ones. For these reasons, success and similarity are the two ingredients we focus on to study the parenthood odds of a meme.
For each meme m we know if it had offspring or not in the observation period, thus making parenthood a binary variable. We explain parenthood using a logistic regression. The two predictors are the average number of votes per timestep and the average similarity of the meme with all other memes. For parents, both measures have been calculated over the time span that precedes the parenthood event, because the appearances of offspring would increase their average similarity, thus invalidating the analysis. For non parents, we considered the entire lifespan of the meme.
In our estimated logit model, both the number of votes and the average similarity are significant, with p < .05 and p < .001 respectively. The coefficient of similarity is much stronger than the one of votes, being equal to −15.9 and 1.8 × 10⁻⁴ respectively. This means that each .1 increment in the average similarity score of a meme decreases by around five times its odds of being a parent, while to achieve a 20% increment in parenthood odds a meme must have 1, 000 more votes per timestep, which is unrealistic. We can conclude that the success of a meme does not contribute much to its odds of having an offspring. What matters most is that the meme has to have a low degree of similarity with the other memes.
The fact that memes are on average similar to each other and that the distribution of similarities does not change over time could reduce this discovery to circular reasoning. In other words, the results of the regression could be explained by the fact that the appearance of the most similar meme for a meme appears at a random time, thus parent memes are the ones for which this happens later, for random reasons. We disprove this objection in the Supplementary Material.
Parenthood's Effect
In Fig. 2 (Left) we show three boxplots, showing the distributions of average votes per timestep for different classes of memes. The first box, labeled as “NP” ( = “Non Parents”), is the distribution for non-parent memes. The second box, labeled as “BP” ( = “Before Parenthood”), is the distribution for parent memes in all timesteps before the appearance of the offspring. Consistently with the results of the logistic regression, parents before parenthood have roughly an amount of votes comparable with non parents. In the figure, the two distributions substantially overlap. The third box, labeled as “AP” ( = “After Parenthood”), is the distribution for parent memes in all timesteps after the appearance of the offspring. We can see that there is a noticeable decrease for all percentiles. The figure suggests that the appearance of an offspring has a negative effect on the success of its parent. This effect is quite strong (notice that the y axis is in logarithmic scale) and the loss is of one order of magnitude. A likely explanation is that the new offspring is very similar to its parent and therefore it “fishes in the same pond”: users rarely use both.

Effect of parenthood on meme popularity.
(Left) Average votes per non parent (NP) and parent meme before (BP) and after (AP) parenthood. Whiskers represents the 10th and 90th percentile, boxes spans from the 25th to the 75th percentile and the line contained in the box represents the median. The same boxplot legend holds for all the boxplots hereafter. (Right) Average votes retained after parenthood against average votes before parenthood. The black line divides the space in two: above the line we have the memes that gained popularity after parenthood, below the line we have memes that lost popularity.
One could reject this explanation by arguing that memes are more popular at the beginning of their life cycle and that is when they are more likely to generate offspring too. This would mean that what is responsible for the decay in votes of a parent is not parenthood, but age. However, we observe that the peak in parenthood odds and in popularity appears at different ages, thus rejecting the hypothesis (see Supplementary Material).
Having an offspring seems to cause a loss in votes for the parent. We can quantify this affirmation by exploring the relationship between the average votes per timestep of a meme before parenthood and how much it lost after the parenthood. This relationship is depicted in Fig. 2 (Right). The figure suggests that the more popular a meme was before becoming a parent, the more popularity it lost after parenthood. Some very unpopular memes have actually gained popularity. However, all memes that had at least 20 votes per timestep lost popularity, with some of them reducing to 1% (in the plot 10−2) of their original popularity.
Offspring Popularity
The appearance of an offspring has a negative effect on the popularity of the parent. We now address the question: what best explains the popularity of the offspring itself? A first answer may come by looking at the popularity of the parent. It is possible that the parent is passing to the offspring those characteristics that made it successful (or not). To test this hypothesis, we classified offspring memes in three equipopulated classes (i.e. each class contains the same number of offspring) according to the average number of votes per timestep of their parents before parenthood. So a parent meme can have either high, medium or low popularity. We then looked at the number of votes the offspring of these parents got in the timestep they appeared. This relationship is depicted in Fig. 3 (Left), where we have a boxplot indicating the offspring's votes on the logarithmic y axis. From the figure, we see that the popularity class of the parent is not able to explain a lot about the popularity of the offspring. There is a positive effect, but it does not appear significant. The median number of votes goes from 9 for the “low popular parent” offspring to 14 for the “high popular parent” offspring. The largest difference appears to be in the outliers from the 90th percentile on.

Influence of a parent's success over the offspring's success.
(Left) Distribution of votes of offspring according to the degree of popularity of their parents. (Right) Distribution of votes of offspring according to their degree of similarity with their parents. In both cases, we are controlling for the age of the offspring by measuring the votes relatively to the meme's birth, since older offspring have a higher chance of getting more votes and of being dissimilar to their parents. Our control is to calculate the popularity of the offspring relative to their appearance times.
We test a second hypothesis. Given the shown anti-correlation between similarity and success, we expect to find significantly higher numbers of votes for the memes which are the most dissimilar from their parents. We explore this relationship with the same boxplot we examined previously. In Fig. 3 (Right), we put the offspring in three equipopulated bins according to how similar they are to their parent. As we can see, now we have significant differences between the three classes (please remember that the y axis has a logarithmic scale). As expected, the offspring that have low similarity with their parents have a median amount of votes equal to the 75th percentile of the “Medium” class. The “Low” similarity class offspring have also a median amount of votes ten times higher than the median amount of votes of the “High” similarity class. We conclude that while the popularity of the parent meme does not necessarily imply anything about the popularity of the offspring, their degree of similarity does, with higher number of votes connected to a lower degree of similarity.
Evaluating Meme Uniqueness
One could be tempted to predict a meme's future popularity by using average similarity and network topological measures shown in Tab. I, given their anti-correlation with the success of memes. However, both measures have some downsides. The average similarity does not control for groups of memes similar to each other but dissimilar from everything else. In this case, some high similarity values may increase the average similarity of memes that are indeed dissimilar to almost any other meme. Network topological measures, on the other hand, are highly dependent on how the network map has been built. If the criterion to select significant edges is not capturing the relevant information, the network map usefulness may be questionable.
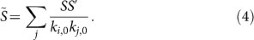
We propose a method based on matrix factorization. We aim to evaluate what we define as “Meme Uniqueness” u. In our method, we make use of the entire similarity matrix S: we recursively correct the average similarity of a meme with all other memes' average similarities. In other words, if a meme is very similar only to highly dissimilar memes, then its uniqueness u is still high. First, we calculate the sums of the rows/columns of S. S being symmetric, the sum of row i is equal to the sum of column i:  . To correct these sums recursively we need to calculate the average level of similarity of the memes by looking at the average similarity of the memes they are similar to and then use it to update the average similarity of the original meme and so forth. This can be expressed as follows:
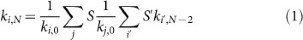
 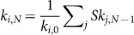 . We then insert kj,N−1 into ki,N obtaining:
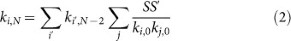
and rewrite this as:
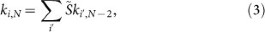
where:
We note in the last formulation ki,N is satisfied when ki,N = ki,N−2 and this is equal to a certain constant a. This is the eigenvector associated with the largest eigenvalue, that is equal to one. Since this eigenvector is a vector composed by the same constant, that is the average similarity of the meme, it is not informative. We look, instead, for the eigenvector associated with the second largest eigenvalue. This is the eigenvector associated with the variance in the system, i.e. how fast the meme is converging to the average similarity. The faster a meme converges to the average similarity the less unique it is and thus we can formulate the meme uniqueness as:
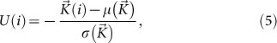
where  is the eigenvector of
  associated to the second largest eigenvalue, µ is the function calculating its average and σ is the function calculating its standard deviation.
Numerical Results
We now have to test if meme uniqueness is a good predictor of meme success. We calculate U for each timestep. We then calculate the Spearman correlation between Un (U calculated at the n-th timestep) with the popularity in number of votes of the memes at the timestep n + 1. We use the Spearman correlation because we are not interested in predicting the actual number of votes but only what meme will be ranked among the top memes. Correlation and p-values are reported in Tab. II. We focused on the timesteps after the ninth, because that is when we have a fixed number of memes. We can see that the correlations are much stronger than the one reported in Tab. I. The correlations are weak, but nevertheless significant, showing that uniqueness carries information about a meme's success and it could be used in a prediction task.
When trying to predict which of the newly born memes will be successful in the future, the meme uniqueness measure can be used to have an educated guess in the absence of any other external information. Without any information about the social network or social media through which the memes are shared, currently one can only do a random guess. In Tab. III we confront the number of correct guesses based on the meme uniqueness measure and on random trials. Again, we stop at timestep #8 because there are no more offspring after that time. While not perfect, the meme uniqueness measure still represents an objective alternative to random guess, yielding better results.
Discussion
The present findings demonstrate that the intrinsic characteristics of memes and their similarity with one another is connected with their likelihood of going viral. This is a remarkable result: it allows researchers to detect meme characteristics and use them to objectively explain why a meme is popular, or having an educated guess about which memes are going to be popular, in absence of the social network they are shared through. The only source of information in our model is the degree of similarity of memes with one another; the original creator of the meme and her social network are unknown.
In the context of social media, several authors explored the theme of high popularity heterogeneity in memes and how predictable it is. Weng et al.7 showed that the social network structure and the finite user attention are sufficient conditions to explain broad diversity in meme popularity. However, they also remarked that their “results do not constitute a proof that exogenous features, like intrinsic values of memes, play no role in determining their popularity”7. In fact, they proved only the emergence of the broad distribution, not which memes are going to be popular. Not all memes starting from the same source in a power position in the network eventually dominate the network's attention: only some of them do and those memes have particular characteristics. Also, reposts of memes from different users go viral anyway, showing independence from network position and dependence on meme content. In fact, Borondo et al.44 proved that, in given network topologies, meritocracy, i.e. the characteristics of the product, plays a major role in the final outcome of the product success. Thus, our results can be used as complementary approach to the one studied by Weng et al. Many other papers focused on the role of social networks in meme popularity, whether to model cascade of information10,18 or to identify the users in a position of power19,45. These models share with Weng et al. the focus on the social network, which we proved not to be the sole source of information to explain a meme's popularity.
Other works have suggested that it is possible to study meme's characteristics independently from the social network where they appear20,34,35,36. While touching upon the subject of meme popularity, these works are mostly focused on proving that memes indeed have some similarities with genes in their dynamics. In particular, in46 the main focus is to study meme mutations. Our model provides a first attempt to use meme characteristics, in particular the similarity between them, to explain why they are popular.
Our results do not mean to make obsolete the analysis of social structure to explain meme popularity. However, we have shown that, at some level, meme similarity has some explanatory power over meme popularity. The results presented in this paper could increase our understanding of global dynamics of memes. Our results in isolation are not sufficient to explain meme popularity, but they become more significant when taking into account the complimentary part of literature. This appears to warrant a word of caution about abandoning the epidemic metaphor when studying information epidemics. While it is true that intrinsic features are less relevant in determining the winning strains of memes than of pathogens, they are nevertheless relevant with a varying degree of importance, that can be predominant when in presence of particular network structures, as shown by44. Rather than considering the informational and biological worlds as radically different, we envision the emergence of a unified framework for the analysis of competition among ideas and strategies for the optimization/suppression of their spread. In such framework, the aspect of the social structure underlying meme spreading, less relevant in the biological world, could be complemented by the study of the intrinsic characteristics of memes.
Methods
The data analysed in this paper was obtained through Memegenerator's public APIs. We crawled the data from June to July, 2013. We removed from our data the memes for which we did not have at least 40 voted implementations with at least one vote. We ended up with 326, 181 meme implementations from 562 memes. The distribution of votes per implementation resembles a power-law, with more than 10% of memes having only one upvote and a meme having a rating of around 2, 000, see Fig. 4 (left). Memegenerator's APIs do not provide the meme implementation's submission date but only a progressive ID that is a proxy of the submission time. We pinpoint some meme implementation dates using the cache of the Internet Archive and derive the creation date of all other memes from these points, obtaining 12 bimonthly snapshots, covering the span of two years (from June 2011 to June 2013). The number of meme implementations submitted per timestep is depicted in Fig. 4 (right).

Descriptive statistics of our initial dataset.
(Left) Log-binned distribution of the implementations' votes. (Right) Number of implementations per timestep.
We estimate the meme similarity of two memes mi and mj using a compound of three different similarity measures. First, we evaluate the meme template similarity (stempl(mi, mj)) via an established computer vision algorithm called SURF47: Speeded Up Robust Features. We used the open source implementation provided in the OpenCV library. Second, we quantify the meme name similarity. A meme's name is represented by a string, thus the meme name similarity (sname(mi, mj)) is the inverse of the Jaro distance48 of the name representations. Finally, we estimate the content similarity of two memes by applying Latent Semantic Indexing49 to the stemmed and stopworded textual content of their meme implementations. Each meme is then described as a vector of topics and the meme content similarity (scont(mi, mj)) is the Spearman-rank correlation of these vectors. We used the implementation provided by the gensim Python package. To achieve a single quantitative estimate of similarity between meme templates, we made a linear combination of our three similarity measures (we support this decision by showing that the three measures are normally distributed, see Supplementary Material). The resulting score, referred to as s(mi, mj), is calculated as follows:

The weight parameters α, β, γ are dependent on how much we want to weigh the different similarity measures. We do not find any reason to favour a measure over another. Thus, we decided to weigh all the similarities equally, i.e. α = β = γ = 1/3. Analysis of the effect of different weighing strategies, as well as examples of memes which this measure classifies as similar, are provided in the Supplementary Material.
To build the graph visualization in Fig. 1, we used the maximum spanning tree extraction algorithm developed by Kruskal. Then, we added to the result the 1, 000 edges with the highest weights that were not already included in the spanning tree. The number of edges to add was chosen to keep the average degree around 5. In other words, on average, each meme will be connected to other 5 memes in the network map. The choice was made following the average degree of many natural networks50.
References
Dawkins, R. The Selfish Gene (Oxford University Press, 1976).
Brodie, R. Virus of the Mind: The New Science of the Meme (Integral Press, 2004).
Hofstadter, D. R. Metamagical Themas (Basic Books, 1991).
Lynch, A. Thought Contagion: How Belief Spreads Through Society (Basic Books, 1999).
Tapscott, D. & Williams, A. D. Wikinomics: How Mass Collaboration Changes Everything (Portfolio Hardcover, 2006).
Wei, X. et al. Competing memes propagation on networks: a case study of composite networks. SIGCOMM Comput. Commun. Rev. 42, 5–12 (2012).
Weng, L., Flammini, A., Vespignani, A. & Menczer, F. Competition among memes in a world with limited attention. Scientific reports 2, 335; 10.1038/srep00335 (2013).
Fowler, J. H. & Christakis, N. A. Cooperative behavior cascades in human social networks. PNAS 107, 5334–5338 (2010).
Myers, S. A. & Leskovec, J. Clash of the contagions: Cooperation and competition in information diffusion. In: ICDM, 539–548 (IEEE Computer Society, 2012).
Watts, D. J. A simple model of global cascades on random networks. PNAS 99, 5766–5771 (2002).
Bakshy, E., Rosenn, I., Marlow, C. & Adamic, L. The role of social networks in information diffusion. In: WWW, 519–528 (ACM, New York, NY, USA, 2012).
Huffaker, D. A., Teng, C., Simmons, M. P., Gong, L. & Adamic, L. A. Group membership and diffusion in virtual worlds. In: SocialCom/PASSAT, 331–338 (IEEE, 2011).
Weng, L., Menczer, F. & Ahn, Y.-Y. Virality Prediction and Community Structure in Social Networks. Scientific reports 3, 2522; 10.1038/srep02522 (2013).
Ratkiewicz, J., Fortunato, S., Flammini, A., Menczer, F. & Vespignani, A. Characterizing and modeling the dynamics of online popularity. Phys. Rev. Lett. 105, 158701 (2010).
Danescu-Niculescu-Mizil, C., Cheng, J., Kleinberg, J. & Lee, L. You had me at hello: How phrasing affects memorability. In: ACL, 892–901 (The Association for Computer Linguistics, 2012).
Leskovec, J., Backstrom, L. & Kleinberg, J. Meme-tracking and the dynamics of the news cycle. In: SIGKDD, 497–506 (ACM, New York, NY, USA, 2009).
Nguyen, H. & Zheng, R. Influence spread in large-scale social networks a belief propagation approach. In: ECML/PKDD, 515–530 (Springer Berlin Heidelberg, 2012).
Prakash, B. A., Chakrabartiy, D., Faloutsos, M., Valler, N. & Faloutsos, C. Threshold conditions for arbitrary cascade models on arbitrary networks. In Knowledge and information systems. 33, 549–575 (2012).
Pandit, S., Yang, Y. & Chawla, N. V. Maximizing information spread through influence structures in social networks. ICDM-Workshops 258–265 (2012).
Simmons, M. P., Adamic, L. A. & Adar, E. Memes online: Extracted, subtracted, injected and recollected. In: ICWSM 17–21 (The AAAI Press, 2011).
Christakis, N. A. & Fowler, J. H. The spread of obesity in a large social network over 32 years. New England Journal of Medicine 357, 370–379 (2007).
Christakis, N. A. & Fowler, J. H. The collective dynamics of smoking in a large social network. The New England journal of medicine 358, 2249–2258 (2008).
Lee, K., Mahmud, J., Chen, J., Zhou, M. & Nichols, J. Who will retweet this?: Automatically identifying and engaging strangers on twitter to spread information. In: IUI, 247–256 (ACM, New York, NY, USA, 2014).
Goyal, A., Bonchi, F. & Lakshmanan, L. V. S. Discovering leaders from community actions. In: CIKM, 499–508 (2008).
Berger, J., Bradlow, E. T., Braunstein, A. & Zhang, Y. From karen to katie using baby names to understand cultural evolution. Psychological science 23, 1067–1073 (2012).
Danescu-Niculescu-Mizil, C., West, R., Jurafsky, D., Leskovec, J. & Potts, C. No country for old members: user lifecycle and linguistic change in online communities. In: WWW, 307–318 (ACM, New York, NY, USA, 2013).
Kooti, F., Yang, H., Cha, M., Gummadi, P. K. & Mason, W. A. The emergence of conventions in online social networks. In: ICWSM (The AAAI Press, 2012).
Weng, L., Menczer, F. & Ahn, Y.-Y. Predicting Successful Memes using Network and Community Structure. ArXiv e-prints (2014) 1403.6199.
Borodin, A., Braverman, M., Lucier, B. & Oren, J. Strategyproof mechanisms for competitive influence in networks. In: WWW, 141–150 (ACM, New York, NY, USA, 2013).
Kamath, K. Y., Caverlee, J., Lee, K. & Cheng, Z. Spatio-temporal dynamics of online memes: a study of geo-tagged tweets. In: WWW, 667–678 (ACM, New York, NY, USA, 2013).
Morstatter, F., Pfeffer, J., Liu, H. & Carley, K. M. Is the sample good enough? comparing data from twitter's streaming api with twitter's firehose. In ICWSM (The AAAI Press., 2013).
Lehmann, J., Gonçalves, B., Ramasco, J. J. & Cattuto, C. Dynamical classes of collective attention in twitter. In: WWW, 251–260 (ACM, New York, NY, USA, 2012).
Bakshy, E., Hofman, J. M., Mason, W. A. & Watts, D. J. Everyone's an influencer: Quantifying influence on twitter. In: WSDM, 65–74 (ACM, New York, NY, USA, 2011).
Bauckhage, C. Insights into internet memes. In: ICWSM (The AAAI Press, 2011).
Bauckhage, C., Kersting, K. & Hadiji, F. Mathematical models of fads explain the temporal dynamics of internet memes. In: ICWSM (The AAAI Press, 2013).
Coscia, M. Competition and success in the meme pool: a case study on quickmeme.com. In: ICWSM (The AAAI Press, 2013).
Ferrara, E. et al. Clustering memes in social media. In: ASONAM (IEEE, 2013).
Tan, C., Lee, L. & Pang, B. The effect of wording on message propagation: Topic- and author-controlled natural experiments on twitter. (2014). 1405.1438.
Figueiredo, F., Almeida, J. M., Benevenuto, F. & Gummadi, K. P. Does content determine information popularity in social media?: A case study of youtube videos' content and their popularity. In: CHI, 979–982 (ACM, New York, NY, USA, 2014).
Cheng, J., Adamic, L. A., Dow, P. A., Kleinberg, J. & Leskovec, J. Can Cascades be Predicted? ArXiv e-prints (2014) 1403.4608.
Pearson, H. Genetics: What is a gene? Nature 441, 398–401 (2006).
http://goo.gl/UHnGvM (Unknown year, Date of access: 06/17/2014).
Hausmann, R. et al. The Atlas of Economic Complexity (Puritan Press, 2011).
Borondo, J., Borondo, F., Rodriguez-Sickert, C. & Hidalgo, C. To each according to its degree: The meritocracy and topocracy of embedded markets. Scientific reports 4, 3784; 10.1038/srep03784 (2014).
Goyal, A., Bonchi, F. & Lakshmanan, L. V. Discovering leaders from community actions. In: CIKM, 499–508 (ACM, 2008).
Adamic, L., Lento, T., Adar, E. & Ng, P. Information evolution in social networks. http://www.ladamic.com/papers/infoevolution/MemeEvolutionFacebook.pdf (2014, Date of access: 07/02/2014).
Bay, H., Ess, A., Tuytelaars, T. & Gool, L. J. V. Speeded-up robust features (surf). Computer Vision and Image Understanding 110, 346–359 (2008).
Winkler, W. E. String comparator metrics and enhanced decision rules in the Fellegi-Sunter model of record linkage. Tech. Rep. (1990).
Hofmann, T. Probabilistic latent semantic analysis. In: UAI, 289–296 (Morgan Kaufmann, Stockholm, 1999).
Newman, M. E. J. The structure and function of complex networks. SIAM Review 45, 167–256 (2003).
Acknowledgements
We want to thank César Hidalgo and Clara Vandeweerdt for useful discussion in the writing of this paper. We also want to thank Muhammed Yildirim for his idea concerning the meme uniqueness measure.
Author information
Authors and Affiliations
Contributions
M.C. is the sole author of the paper and performed all tasks (experiments, writing the paper and creating the figures).
Ethics declarations
Competing interests
The author declares no competing financial interests.
Electronic supplementary material
Supplementary Information
Supplementary Material
Rights and permissions
This work is licensed under a Creative Commons Attribution-NonCommercial-ShareAlike 4.0 International License. The images or other third party material in this article are included in the article's Creative Commons license, unless indicated otherwise in the credit line; if the material is not included under the Creative Commons license, users will need to obtain permission from the license holder in order to reproduce the material. To view a copy of this license, visit http://creativecommons.org/licenses/by-nc-sa/4.0/
About this article

Cite this article
Coscia, M. Average is Boring: How Similarity Kills a Meme's Success. Sci Rep 4, 6477 (2014). https://doi.org/10.1038/srep06477
Received:
Accepted:
Published:
DOI: https://doi.org/10.1038/srep06477
This article is cited by
-
Posts on central websites need less originality to be noticed
Scientific Reports (2022)
-
Entropy and complexity unveil the landscape of memes evolution
Scientific Reports (2021)
-
Dank or not? Analyzing and predicting the popularity of memes on Reddit
Applied Network Science (2021)
-
Sleeping beauties in meme diffusion
Scientometrics (2017)
Comments
By submitting a comment you agree to abide by our Terms and Community Guidelines. If you find something abusive or that does not comply with our terms or guidelines please flag it as inappropriate.
