
Abstract
The formation of intermolecular bonds in C60 has been investigated in detail at pressures below 2.2 GPa and up to 750 K. Fullerene samples were heated in a temperature gradient to obtain data on the formation of dimers and low-dimensional polymers along isobars. Intermolecular bonding was analyzed ex situ by Raman scattering, using both intramolecular modes and intermolecular stretching modes. Semi-quantitative reaction maps are given for the formation of dimers and chains. The activation energy for dimer formation decreases by 0.2 meV pm−1 when intermolecular distances decrease and dimer formation is noticeably affected by the rotational state of molecules. Above 400–450 K larger oligomers are formed; below 1.4 GPa most of these are disordered, with small domains of linear chains, but above this the appearance of stretching modes indicates the existence of ordered one-dimensional polymers. At the highest pressures and temperatures two-dimensional polymers are also observed.
Introduction
The physical properties of Buckminsterfullerene, C60, can be tuned over wide ranges by high pressure treatment. Although the C60 molecule is much less compressible than diamond1,2, the weak intermolecular interactions make solid bulk C60 three times more compressible (“softer”) than graphite3,4. However, irradiation of solid C60 by light5 or particles, or compression of the material6, changes its properties dramatically. In both cases, covalent intermolecular bonds may form by a [2+2] cycloaddition reaction in which reactive C = C sp2 (“graphite-type”) intramolecular bonds on nearest neighbours break up to form two parallel intermolecular sp3 (“diamond-type”) C-C bonds. The polymerization reaction changes the mechanical and electrical properties and high pressure treated C60 has been reported to have band gaps from7 almost zero to8 2.35 eV, while its bulk modulus and hardness approach, or possibly even exceed9, those of diamond.
The possibility to tune the properties of C60 over wide ranges in this way has attracted much interest. Pressure-induced polymerization has been extensively studied6,7,8,9,10,11,12,13,14,15,16,17,18,19 by treating C60 at different pressure-temperature conditions and measuring its structural and vibrational properties both in situ and ex situ. Some investigations have involved over a hundred individual high pressure experiments11,12 and the results have been used to draw reaction maps for the products obtained under different conditions11,12,13,14,15,16,17. The experiments show that compression at room temperature produces random intermolecular bonds, initially at a low rate. However, near 10 GPa a more rapid reaction is reported20 followed by a sudden lattice collapse20,21 near 20 GPa, probably due to massive three-dimensional (3D) intermolecular bond formation. The original lattice can be stabilized to higher pressures by inserting metal ions22 or solvents23 as spacers to prevent the reaction. At elevated temperatures and modest pressures (1–5 GPa), pure C60 forms several well defined covalently bonded structures6,8,10,11,12,13,14,15,16,17,18,19 ("polymers"). The first step is the formation of (C60)2 dimers, but with increasing pressure and/or temperature larger oligomers grow. Below 10 GPa and 1000 K, three long-range ordered structures are found8,10,11,12,13,14,15,16,17,19: an orthorhombic phase containing parallel linear molecular chains (one-dimensional polymer, 1D), a pseudo-tetragonal phase, where such chains are linked by bonds in the perpendicular direction and a rhombohedral phase where all molecules in the original (111) planes of the face-centered cubic (fcc) C60 lattice are covalently bonded. The last two both contain two-dimensional (2D) polymer planes. Once formed, polymers are metastable at room temperature but break down to monomers on heating at atmospheric pressure; they are stable to higher pressures24 than monomeric C60 but may transform into 3D polymers under extreme conditions7,9,11,12,13,14,15,16,17,25,26,27.
Although the general features of this polymerization process are known, there is surprisingly little agreement on details. The main reasons are the random disorder inherent in the process, which complicates the structural analysis and uncertainties in the pressures and temperatures. Pressure is often calculated from applied load and temperature is measured using thermocouples. Both methods give a reasonable accuracy, but in small pressure cells small changes in the dimensions or materials properties may give significant changes in pressure, heating changes the pressure by softening the pressure transmitting medium or by thermal expansion and large temperature gradients up to 104 to 105 K m−1 increase uncertainties in temperature measurements. Polymerization is also sensitive to anisotropic strain which promotes the reaction by locally bringing molecules into contact. Furthermore, X-ray diffraction or Raman scattering results are often presented in a non-quantitative way, identifying only the majority phase. Creating a reliable reaction diagram from the results of experiments using samples of different purity, different high pressure devices, reaction pressures, pressure media, temperatures and reaction times, analyzed by different methods and treated at widely different pressure-temperature coordinates, is thus a challenging task.
Recently, a simple method was developed28 to map reaction diagrams by heating a long sample in a temperature gradient under pressure, then quenching to ambient conditions for analysis. Each experiment investigates an isobar in the pressure-temperature plane and a small number of experiments provide a complete two-dimensional view. For metastable phases each experiment provides a semi-permanent record which can be studied ex situ and interesting regions can be re-analyzed in detail if desired. Although the absolute temperature and pressure accuracy is limited by the same factors as in other experiments, the pressure is constant along each sample and relative temperatures are extremely well defined. Here, this method has been applied to the reaction diagram of C60. The results have been analyzed using Raman scattering, focusing on the intermolecular bonding rather than on lattice structure and a semi-quantitative map of the reaction products at any point in the pressure-temperature plane has been obtained. The data verify that the rotational and probably also the orientational, states of the molecules influence the intermolecular bonding reaction.
Experimental results
This report is based on data from 16 samples, each treated for one hour at pressures from 0.7 to 2.2 GPa. Except at the lowest temperatures this should be long enough for the reaction to reach equilibrium. The heater power was usually chosen to give a temperature range from about 375 to 550 K, but three samples were run with maximum temperatures near 750 K to study the onset of two-dimensional polymerization. As described in the Methods section, samples were well characterized and great care was taken to avoid photo-induced effects before and after high pressure treatment.
Raman spectra
The presence of intermolecular bonds has been identified using NIR Raman scattering. Raman spectra were measured at 20–150 points on each sample and the corresponding treatment temperatures calculated from the measured mechanical position. Including tests on pristine samples, 841 Raman spectra were measured, most of these using 830 nm laser excitation.
The number of intermolecular bonds to each C60 molecule is determined from the shift of the Ag(2) intramolecular Raman mode15,19, but this method provides no information about lattice structure. However, it was also possible to observe the longitudinal lattice mode of linear C60 chains near 117 cm−1 and the dimer stretching mode at 96 cm−1. Fig. 1a shows Raman data for four samples: the pristine material before pressurization, a sample containing mainly dimers, another containing a high concentration of the “linear chain” phase and a fourth containing both chains and 2D polymer. For the pristine material all ten Raman modes allowed by symmetry, two Ag modes (at 495 and 1469 cm−1) and eight Hg modes, are easily identified and because isotopes and defects break the local symmetry some further peaks may be observed in the noise (not visible on this scale). Although ordered dimer lattices have been predicted29,30 and may have been observed31, most experiments show16,30,32 that dimers form at random in the lattice. The resulting disorder breaks the lattice symmetry creating a very rich Raman spectrum. When ordered polymer lattices form, the symmetry again becomes higher and the number of peaks decreases. The evolution of the Raman spectrum with polymerization has been well investigated15,18,19,32,33,34,35,36. Features of particular importance for the present work are: i) the Ag(2) mode at 1469 cm−1 shifts in a predictable way with the number of sp3 covalent intermolecular bonds: for each cycloaddition link formed, the peak shifts by approximately −5 cm−1. ii) The Ag(1) radial breathing mode at 495 cm−1 shifts by about −6 cm−1 on dimerization. iii) Polymerization also gives rise to new modes; in particular, both dimers and chains show low frequency longitudinal stretching modes and iv) the formation of intermolecular bonds causes new modes in the range 900–1000 cm−1, the so called “polymer modes” associated with37 vibrations in the four-membered ring of the intermolecular bonds. The first three features are used here to identify the polymeric structures after treatment and polymer modes were also observed: lines near 950 and 975 cm−1 appear when dimers form and with increasing polymerization these lines broaden and merge into a band with several peaks, extending from about 940 to 1010 cm−1. With NIR excitation these lines were weak and no systematic study was possible but with visible light excitation their intensity is similar to that of the Ag(1) or low Hg modes and clear structures are seen.

Raman scattering data.
(a) Raw Raman data for four samples after pressure treatment. As indicated by the curve labels, spectra are shown both for the pristine material, a sample dominated by dimers, a sample dominated by chains and a sample containing both chains and a high fraction of 2D tetragonal C60 (“planes”). Top two curves have been magnified and shifted vertically for improved clarity but the original background has been preserve to indicate data quality. (b) Fitted components of the Ag(2) mode for the same four samples as in (a), after removal of baseline. The peaks have been rescaled to approximately the same total amplitudes. The fitted curves are labeled pristine, dimer, chain, fork and plane, indicating signals originating from free molecules and from molecules covalently bonded to 1, 2, 3 and 4 neighbours, respectively.
The Ag(2) modes from the spectra in Fig. 1a are analyzed in detail in Fig. 1b. Voigt functions with peak positions near 1469, 1464, 1459, 1454 and 1448 cm−1, implying covalent intermolecular bonds to 0–4 nearest neighbours, respectively, have been fitted to the data. For simplicity these peaks will be referred to as originating from monomers, dimers, chains, forked (branched) chains and planes, respectively. All measured spectra were analyzed in this way and in most cases the signal-to-noise ratio was sufficient to give stable values for the relative peak areas. The peak near 1448 cm−1, associated with the tetragonal 2D polymer, was only found in samples treated at the highest pressures and temperatures and was usually associated with a line near 1432 cm−1, believed36 to be a sub-peak of the Hg(7) mode. A small peak near 1454 cm−1 often significantly improved the fit but does not correspond to any known lattice structure. Its position suggests bonding to three molecular neighbours, i.e. a structure with branched chains or oligomers. The relative fitted areas of the Ag(2) sub-peaks are used as semi-quantitative measures of the numerical fractions of molecules with different numbers of intermolecular bonds. Accurate Raman cross sections for different C60 structures and excitation wavelengths are not known, since pure structural phases are rare and it is thus not possible to deduce the true fractions of the structures observed. However, where measurements were carried out using all three excitations lasers the results usually agreed to within the experimental scatter. Figure 1a shows that the sensitivity of the detector drops off rapidly with increasing wavenumber near the Ag(2) mode, which might overestimate the intensity from polymerized C60 relative to monomers. Compared to other possible errors this is no large effect and no correction for this has been applied.
For each experiment, the fitted relative intensities from different molecular states were plotted as functions of treatment temperature as shown in Fig. 2. At low temperatures all samples contained mainly C60 monomers, but a weak dimer line was usually observed. Although relative intensities at the single percent level are difficult to quantify by fitting, the spectra always showed indications of other dimer peaks in the noise when the 1464 cm−1 peak reached this level. In the intermediate pressure range, 1.1–1.8 GPa, the relative intensities evolved in an interesting multi-step sequence. At low temperature the intensity from dimers was practically constant. At some threshold temperature this intensity started to grow and a small constant intensity from chains appeared. When the area of the dimer peak reached 20–35 percent of the total Ag(2) area, a sudden step increase in dimer intensity by about a factor of two occurred. This step was very sharp, with a width of often less than 1 K, from 1.2 to 1.6 GPa. Above the step the dimer intensity was constant or increased slowly with temperature, the intensity from monomers decreased rapidly and the intensity from chains increased approximately linearly with increasing temperature. Usually the dimer intensity showed a plateau or a rounded maximum, 20–40 K wide, before dropping off at the same rate as the chain intensity increased. At the highest temperatures the NIR Raman measurements showed constant, small relative intensities from monomers and dimers, a dominating contribution from chains and for the higher pressures significant contributions from “branched chains” and 2D tetragonal polymers. No signals were found from the rhombohedral phase. Considering that polymerization is a random process the scatter in the data was surprisingly small. However, in most samples grains were found which differed strongly from their neighbours, possibly because of local strain during treatment.

Relative intensities of Ag(2) sub-modes versus treatment temperature.
The relative intensities of the five Ag(2) sub-modes for a sample treated at 1.4 GPa, plotted as functions of treatment temperature. Signals originate from monomers and from C60 molecules covalently bonded to one (“dimer”), two (“chain”), three (“fork”) and four (“plane”) nearest neighbours.
Reaction map for dimers
The relative intensities of the Raman peaks may be plotted as functions of temperature and pressure to create semi-quantitative reaction maps for each molecular state. Although the scatter in the data (Fig. 2) suggests that the map will be rather crude, it may still be significantly more detailed than earlier maps11,12,13,14,15,16,17 because points can be spaced arbitrarily close in temperature on each isobar. Figure 3a shows a map of the relative intensity of the 1464 cm−1 dimer line. The diagram was drawn by connecting the points in graphs of intensity versus temperature (Fig. 2) by straight lines and noting where these lines cross selected percentage levels. To minimize artifacts the curves were not statistically smoothed and the experimental scatter is intentionally preserved. Most contours in Fig. 3a were interpolated between experimental points using cubic spline functions, manually modified when obvious artifacts, such as crossing curves, occurred. The highest intensities are found only in small areas at a few pressures and for these the contours have been drawn manually. The scatter in the data also creates small hills or valleys, again drawn manually. Data were extrapolated by 50–100 MPa for the final map to cover the range 0.65 to 2.3 GPa.

Reaction map for dimer formation.
(a) Reaction map obtained from the fitted intensities of the molecular Ag(2) mode. Colour shows the fitted relative intensity of the 1464 cm−1 component of the Ag(2) mode as a function of pressure p and temperature T. (b) Reaction map obtained by plotting the ratio Idimer/IAg(1) between the intensities of the longitudinal stretching mode at 96 cm−1 and the total intensity of the Ag(1) breathing mode at 489–495 cm−1. The dashed lines indicate the transition between the low temperature phase with orientationally ordered molecules and the high temperature phase with quasi-free molecular rotation, extrapolated from low temperatures using literature data4,13.
Because dimers are often considered as precursors to larger oligomers most earlier reaction maps11,12,13,14,15,16 do not show under what conditions they form and even when dimerization is discussed such information is qualitative only17,29,31,38. In contrast, Fig. 3a clearly shows that dimers are the major reaction product when C60 is annealed for one hour under certain pressure-temperature conditions. Both formation and breakdown of intermolecular bonds are believed to be thermally activated processes and the observed reaction diagram is in good general agreement with this assumption. The dimer Raman intensity increases with reaction temperature, until the dimers start coalescing into larger oligomers and the intensity drops. However, a surprisingly large intensity (10–30 percent) remains at high pressure and temperature, where larger oligomers should dominate.
The Ag(2) line originates from vibrations along the C = C bonds on individual molecules and a shift of this line might be caused by other mechanisms than dimerization. Another way to detect dimers is through their Raman active stretching mode, low frequency longitudinal vibrations of the heavy molecules along the intermolecular bond. The dimer spectrum in Fig. 1a was selected to show a strong stretching mode at low wavenumber, 96 cm−1. The intensity was quantified by calculating the ratio between the intensities of this mode and of the nearby radial breathing Ag(1) mode. Because the latter shifts from 495 cm−1 for the monomer to 489 cm−1 for dimers and linear chains, the sum of the intensities of these two sub-modes was used. A weak third line near 485 cm−1, tentatively identified39 as Gg(1), usually had to be included in the fit but was not included in calculating the ratio. Figure 3b shows a map of the intensity ratio Idimer/IAg1 as a function of temperature and pressure, plotted using the same procedure as for the Ag(2) line; note that a different numerical scale has been used because of the low intensities. The two reaction maps in Fig. 3 are virtually identical, except that Fig. 3b contains areas at both high and low temperature where no signals were detected.
Figure 3 shows that dimers are produced in high yield in a region extending from 430 K near 1 GPa to 400 K near 2 GPa. At lower temperatures few dimers form and at higher temperatures larger oligomers grow. The results from inter- and intramolecular modes agree that the highest intensities, above 80%, are obtained at rather low pressures, 1.15 ± 0.05 GPa, probably because the reaction rate and thus the formation of larger oligomers, increases with pressure. The peak yield is comparable to that found in matrix-assisted dimer synthesis40. Five features merit special comments:
-
i
The dashed line indicates the phase line for the rotational transition found near41 260 K at atmospheric pressure, extrapolated using literature data13,42. Surprisingly high intensities were found near this line for both molecular and stretching modes even at quite low temperatures and the data suggest the existence of a low pressure “tail” of the dimerization reaction close to this transformation. (Note that a small shift (+100 MPa) of the position of the line would bring it into excellent agreement with areas of local maximum intensity from 0.8 to 1.2 GPa; the normal phase line curvature should modify the linear extrapolation in this direction.) The resolution of earlier experiments has been too low to detect effects of molecular rotation and orientation on the rate of intermolecular bonding. However, the dimerization enhancement is unexpected. Although the reaction rate increases with temperature the rotational transformation is associated with a lattice expansion which should decrease the reaction rate. The high dimerization rate at low temperatures below 1 GPa rather suggests that transformation-induced dynamic disorder locally brings molecules into close contact, enhancing the reaction rate.
-
ii
In the low-temperature simple cubic phase the onset of rapid dimerization is surprisingly sudden between 1.1 and 1.8 GPa. The intensity from dimers jumps from 20–30 to 50–60 percent for a temperature increase of less than 1 K (Fig. 2). This is particularly surprising considering the drift in treatment temperature with time (see section Methods). Below this jump the intensity from the Ag(2) dimer line increases approximately linearly with temperature, while above it is almost constant. The rapid increase might be caused by positive feedback. Dimerization locally reduces the lattice volume and the resulting dynamic disorder may allow other molecules to take up positions favourable for further dimer formation.
-
iii
Pressure forces molecules together, decreasing the dimerization onset temperature. Although the experimental scatter is large, Figs 3a and 3b agree that the temperatures for both dimerization onset and maximum dimer intensity change with pressure at a rate of (−28 ± 5) K GPa−1. The more interesting relation between dimerization temperature and intermolecular distance is presented in Fig. 4. Defining dimerization onset temperatures from the sharp increase in dimer intensity discussed above and using intermolecular distances in C60 from an internally consistent set of compression data4,43,44,45 and a linear coefficient of thermal expansion46 of 1.52·10−5 K−1 gives a well-defined straight line valid for both rotating and non-rotating molecules. Here the volume change at the rotational transition has been taken into account, but it should be remembered that the definition of “dimerization temperature” is arbitrary and that the lattice spacing is overestimated, since the sample at this point contains 20–35 percent dimers. Extrapolation shows that at 293 K the onset of rapid dimerization should occur at a volume compression of 20 percent, in excellent agreement with the report of significant diffraction line broadening by Haines and Léger20 and an anomaly in the data of Horikawa et al.45 at this compression. The slope 2.45 K pm−1 indicates that when fullerene molecules are pushed together the bond formation energy threshold decreases by about 0.2 meV pm−1 in the range investigated. As expected from the nearly isothermal dimerization behavior this is small compared to the activation energy, for which calculations47,48 show values of 3–4 eV while experimental data range from49 0.4 to38 1.4 eV.
Figure 4 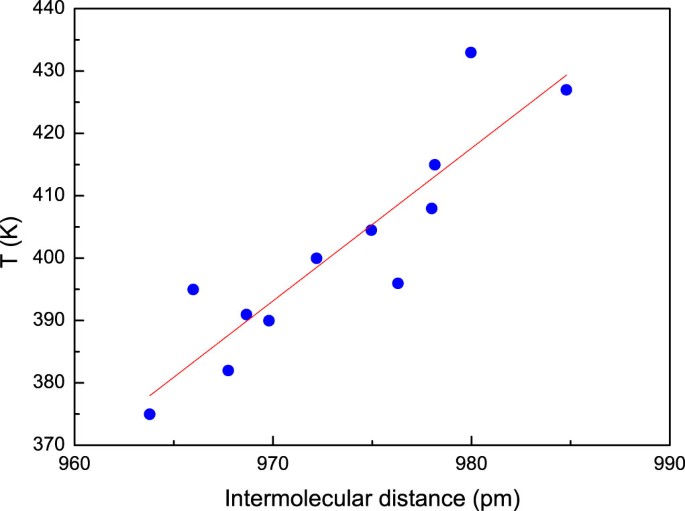
Dimerization onset versus intermolecular distance.
The characteristic temperature for the sudden onset of intense dimerization, as defined in the text, plotted as a function of estimated nearest-neighbour spacing under the corresponding pressure-temperature conditions. The three points at the largest spacing corresponds to a face-centered lattice with almost free molecular rotation, all other to the low-temperature simple cubic lattice with partial orientational order.
-
iv
A second anomaly may exist near 2 GPa, where the dimer intensity drops off rapidly. This may be correlated with the transition15 into an orientationally ordered lattice, which from a linear extrapolation of low-temperature data15 should occur near 1.5 GPa at 350 K and 2 GPa at 500 K. Again, the normal phase line curvature should push these values to higher pressures. The absence of molecular ratcheting in the ordered lattice might delay initial dimerization to higher temperature. Once intermolecular bonding starts, however, molecular orientation might facilitate growth of larger oligomers, leading to a decrease in maximum dimer intensity, in agreement with the data.
-
v
Finally, above 450 K the Ag(2) mode (Fig. 3a) indicates significant dimer intensities but there is practically no signal from stretching modes (Fig. 3b). There is no obvious explanation for this difference, but a strong 1464 cm−1 Ag(2) line is often observed also in tetragonal36 (2D) C60. The reason is unknown; possibly, surface reconstruction adds a high density of terminal molecules attached to the edges of planes by cycloaddition bonds.

Reaction map for fullerene chains
Using the same procedure, similar maps were drawn for C60 molecules covalently bonded to two neighbours, usually associated with an orthorhombic lattice containing linear chains10,11,12,13,14,15,16,17,18,19. The map in Fig. 5a shows the relative intensity of the 1459 cm−1 Ag(2) sub-line, extrapolated to 0.65 and 2.3 GPa as before. Three experiments were extended to about 750 K. The selected pressures were 1.15 GPa, to check the position of the reported equilibrium phase line50 between C60 monomer and polymer, 1.3 GPa, because early runs indicated that 2D structures begins to form here and 1.9 GPa, to study the evolution of 2D polymers. White areas denote either that no signals were detected (low temperatures) or that no measurements were made (high temperature) and the dashed line is again the (extrapolated) rotational transition boundary of molecular C60. A comparison with Fig. 3a shows that the decreasing dimer Raman intensity is matched by an increase in intensities from chains, rising steeply at temperatures between 400 and 450 K. Near 1 GPa, 60–85 percent of the Ag(2) intensity originates from chain molecules above 450 K and we showed earlier51 that under these conditions well ordered 1D polymers formed in large C60 single crystals. Above 1.6 GPa the chain intensity is lower and with increasing temperature it rapidly drops to below 50 percent, suggesting that chains link up to form a 2D polymer. These results are in excellent agreement with literature data11,12,13,14,15,16,17,30,33,35,38,51, especially the work of Davydov et al.11

Reaction map for chain formation.
(a) Reaction map obtained from the fitted intensities of the molecular Ag(2) mode. Colour shows the fitted relative intensity of the 1459 cm−1 component of the Ag(2) mode as a function of pressure p and temperature T. (b) Reaction map obtained by plotting the ratio Ichain/IAg(1) between the intensities of the longitudinal chain stretching mode at 117 cm−1 and the total intensity of the Ag(1) breathing mode at 489–495 cm−1. The dashed lines in these figures are identical to those shown in Fig. 3 while the full lines indicate the equilibrium between polymeric and monomeric C60 phases as given by Bashkin et al.50 The latter lines have been extrapolated linearly to low temperatures.
Like dimers, chains can also be identified from a longitudinal lattice mode (near 117 cm−1) and Fig. 5b shows the corresponding map, drawn in the same way as for the dimer stretching mode (Fig. 3b). It is immediately obvious that Figs 5a and 5b are very different. In the high intensity area of Fig. 5a no stretching mode intensity is observed. The stretching mode intensity instead peaks near 2 GPa and 600 K. (Note that the figure shows the ratio relative to the radial breathing Ag(1) mode which rapidly loses intensity with an increasing number of intermolecular bonds.) A reasonable explanation for the difference between the figures is found by realizing that the lattice stretching mode is only excited if sufficiently long, straight chains exist, while the intramolecular mode is the same for all molecules bonded to two neighbours. Combining the present data with earlier results11,33,51 suggests that below 1.4 GPa dimers coalesce to form small (200 Å) ordered domains51 of short chains in a matrix of disordered oligomers like non-linear, randomly zig-zagging chains. A significant (5–15 percent) intensity from an Ag(2) sub-line near 1454 cm−1 suggests that such oligomers form branched structures. Both the dimer and chain “phases” are thus strongly disordered below 1.4 GPa and large crystallites of ordered orthorhombic (chain) phase should only be expected at higher pressures where the stretching mode is observed (Fig. 5b).
The full lines in Fig. 5 are extrapolations from high temperature of the equilibrium line between monomers and polymers reported by Bashkin et al.50Figure 5a shows excellent agreement with this line near 750 K; near the line the intensity drops rapidly. (The parallel arrangement of the contour lines is a reasonable guess.) Near 500 K, Bashkin et al. found about 50% polymerization at 0.8 GPa; Fig. 5a shows a higher polymer fraction, but considering hysteresis effects the agreement is quite good. Again, effects of the rotational state might be present. Below the rotational phase line (dashed) the polymerization onset shifts with pressure at about the same rate as for dimerization, but above the line the slope is an order of magnitude larger, 3–400 K GPa−1, indicating an intermolecular distance too large for efficient bond formation.
Two-dimensional polymers
Above 1.2 GPa a further Ag(2) sub-mode can be detected near 1448 cm−1, indicating that each molecule has formed bonds to four neighbours. This line is usually associated with the pseudo-tetragonal10,11,12,13,14,15,16,17,36,52,53,54 2D phase. The NIR signal-to-noise ratio rapidly degraded with increasing treatment temperature and pressure, but control experiments using visible lasers gave very similar results. Fig. 6 shows the relative intensity of the 1448 cm−1 line as a function of treatment temperature and pressure. At and below 1.2 GPa this mode was just detectable at a few points, but at 1.3 GPa weak lines were clearly observed above 520 K. At and above 1.4 GPa the intensity increased rapidly and linearly with temperature, with the onset temperature gradually falling from 480 K to near 400 K. The observation of such low onset temperatures and pressures for the formation of the 2D phase was unexpected; most earlier studies observe this phase only under much more severe conditions. One reason might be the long reaction time used; the tetragonal phase may grow from the linear chain phase55 and one hour should be long enough for the material to evolve from monomers into dimers, linear chains and finally 2D planes. Although Fig. 6 indicates maximum relative intensities below 50 percent, the true 2D polymer fraction may be higher because the Raman response was found to weaken with increasing polymerization. The results agree well with our earlier studies: X-ray diffraction indicated52 that a single crystal treated for four hours under hydrostatic conditions at 700 K and 2 GPa was almost completely converted into 2 D polymers. The tetragonal phase was the majority phase, but in contrast to the present samples a small amount of rhombohedral phase was also found. Raman studies on the polymerized single crystals52 also showed signals from dimers and linear chains. In particular, the dimer Ag(2) peak at 1464 cm−1 was quite strong, in agreement with the data shown in Fig. 3a above.

Relative intensity of the Ag(2) Raman mode from 2D polymer.
The relative intensity of the Ag(2) sub-mode associated with molecules covalently bonded to four nearest neighbours, believed to indicate the presence of the tetragonal 2D polymer of C60, as a function of temperature at several pressures. Three points deviating very far from the general behaviour have been removed for clarity.
Discussion
In contrast to most earlier studies of the polymerization of C60 this work focuses on the early stages of intermolecular bond formation rather than on the lattice structure of the resulting material. In particular, it was shown that (C60)2 dimers are a stable, dominating structural feature in a certain temperature interval at all pressures above 800 MPa and that the rotational transition is associated with an enhanced dimer formation rate, possibly due to dynamic disorder. The results strongly emphasize the inherent randomness of the polymerization process, implying that no pure structural phases are obtained in any pressure-temperature region studied here. In particular, at “low” pressure (below about 1.5 GPa) polymerization of C60 always results in very strong structural disorder. Above 450 K randomly oriented dimers grow or merge by rapid formation of intermolecular bonds, producing a disordered structure consisting of oligomers with a random structure and little long-range order. In this range most molecules are connected to two or three neighbours, probably forming networks of branching, non-linear chains and the absence of lattice stretching modes indicates that only few and/or small domains of ordered orthorhombic polymers exist. These features may be invisible in X-ray studies, which “see” only long-range order. Surprisingly, two-dimensional polymers are detected already near 1.3 GPa and 500 K, conditions much more gentle than commonly believed necessary for the formation of such structures. The detailed information presented here thus gives new possibilities to improve our understanding of thermally induced polymerization of C60; however, much remains to learn, particularly considering the fact that irradiation with light is known to further affect both thermal polymerization56 under pressure and thermal depolymerization57.
Methods
Sample material
The material investigated was pre-sublimed, nominally 99.98 percent pure C60 obtained from Term USA, CA. Before use the material was slowly heated to 200°C and kept at this temperature for 24–48 h in a dynamic vacuum (10−4 mbar) to remove atmospheric gases and water and to break up any photopolymers formed during storage. The samples were removed from the vacuum chamber in a glove-box and stored under dark conditions in argon until use.
High pressure cell
All samples were treated in a piston-cylinder device, 45 mm in inside diameter and similar to that described by Andersson et al.58 In each cell, the sample was distributed in the form of powder on a 4 mm wide strip cut from 0.3 mm thick copper foil, placed horizontally in the center plane of the Teflon™ pressure cell. The amount of material was chosen to form a 200 μm thick layer after compression. The copper substrate was heated at one end using a Kanthal™ wire heater on pyrophyllite insulation. The useful sample length was usually at least 25 mm. Six Constantan wires, 0.25 mm in diameter, were placed on the copper surface with wire positions as close as possible to being equally spaced and perpendicular to the substrate axis. A 35 μm Cu foil strip was placed on top of this assembly before a layer of talc powder was added to fill out voids and minimize non-hydrostatic pressure. Although the intended function of this foil was to minimize mixing of the sample with the talc powder, it also proved to be a very convenient aid in determining the final positions of the thermocouples, since the Constantan wires usually left clear impressions in its surface. The area close to the heater was packed with (heat-resistant) talc powder, usually mixed with glass beads to improve thermal insulation59. Finally, the top half of the cell was filled with Teflon, to create a symmetrical cell structure and a top layer of talc powder. To measure the temperature at six points, a copper wire was soldered to the cold end of the substrate and used with the six Constantan wires to form six thermocouples. Thermocouples made from identical materials were calibrated against a calibrated diode sensor (Lake Shore Cryotronics) up to 175°C and a standard Pt-100 sensor above. Pressure was estimated from the load, using a calibration function derived from measurements in a fluid medium using a Manganin wire calibrated against the melting point of mercury. A photograph of a typical pressure cell before sample loading is presented as Figure S1 in Supplementary Material.
High pressure treatment
All samples were nominally treated for one hour at the final pressure-temperature conditions; because the rate of approach to equilibrium varied, the effective treatment period was a few minutes longer in some experiments. After one hour at the reaction conditions the heater power was switched off and after rapid cooling to room temperature the pressure was slowly decreased to zero. Because the final reaction products of C60 depend more on temperature than pressure, the low pressure experiments were carried out by first increasing the pressure to 0.5 GPa, then heating to the final temperature and finally increasing pressure to the final value. The reaction then proceeds directly from the monomer phase to the final structure and earlier work on single crystals51,52 and thin films60 showed that this gave better phase purity. However, increasing pressure at high temperature increases the risk for broken connections and for all pressures above 1.15 GPa the traditional path, with pressurization followed by heating, was used. At 1 GPa two experiments were made, one using each method. The results were even quantitatively very similar, except that the results for the sample compressed before heating were consistently shifted to about 10 K higher temperature compared to the sample heated before compression. The heater power was 30–80 W, depending on heater design and the reaction conditions chosen. This was enough to give a significant temperature increase in the whole vessel with time. The indicated temperature at a single thermocouple could easily be kept constant within better than 0.5 K by slowly decreasing the heater power, but this led to a slow cooling of the hot part of the sample and a slow heating of the cooler part. Neither effect was very large; the maximum change noted over one hour was about 5 K. However, the effect complicated the definition of the exact reaction temperature. Noting that the polymerization reaction usually runs to near completion in a few minutes33 and that the polymerization is not easily reversible55, the solution was to define the reaction temperature at each point as the average value during the 15 minutes when the measured temperature was the highest. Usually this meant the first 15 minutes for the hot part of the sample and the last 15 minutes for the cool part. The actual temperature at each point was then calculated from the position relative to the nearest thermocouples, usually interpolated using a second order polynomial.
Analysis
To avoid post-treatment photo-polymerization all pressure cells were opened under red light in a photographic darkroom. Most cells could be cut open and disassembled without much sample damage. The Constantan wires conveniently divided each pressed sample into five rectangular platelets which could be carefully removed individually. Each platelet was then fixed to a glass plate coated with glue (with the heated side up) and stored in a dark box. In some cases platelets broke and pieces were lost, but for most samples a reasonably complete record of the reaction process could be obtained. The reaction conditions at each point on the platelets could then be found from the measured temperatures and the position. The estimated temperature gradients varied between 3 and 50 K mm−1 and with a simple micrometer stage the highest theoretical temperature resolution was thus of the order of 10 mK. All samples were analyzed using a Renishaw 1000 filter-based Raman spectrometer with three excitation lasers (wavelengths 514, 632 and 830 nm). All measurements presented in the paper were carried out using 830 nm excitation, because the energy of this laser is not high enough to cause photo-polymerization. The 514 nm laser gave very clear spectra for material polymerized at high temperature, but for monomer samples a significant degree of additional oligomerization could be observed as soon as the exposure time was long enough to provide a reasonable signal-to-noise ratio. The 632 nm laser gave very strong fluorescence signals for monomeric C60 but produced good signals for well polymerized material. The 830 nm NIR laser gave excellent spectra for pristine C60 as well as for most polymerized phases, but for two-dimensional polymers or partially decomposed (“amorphized”) C60 it gave weak signals with a very strong background. A small thermal drift was observed in the laser wavelength, causing spectra to shift by about ±1 cm−1 during a day, but since peak positions are well known this was not a problem. The sensitivity of the detector also decreased significantly at long wavelengths and with NIR excitation both signal and background fell rapidly for Raman shifts larger than 600 cm−1. Spectra were still good enough for accurate analysis even at the “pentagonal pinch” mode near 1469 cm−1. All spectra were analyzed using Peakfit® software (Seasolve Software, Inc.), assuming a Voigt lineshape. Line positions, widths and shapes were allowed to vary to obtain the best possible overall fit and the peak areas obtained were used to find the relative intensities of the lines analyzed.
References
Ruoff, R. S. & Ruoff, A. L. Is C60 stiffer than diamond? Nature 350, 663–664 (1991).
Peón-Escalante, R., Villanueva, C., Quintal, R., Avilés, F. & Tapia, A. The bond force constant and bulk modulus of C60 . Comp. Mater. Sci. 83, 120–126 (2014).
Fischer, J. E. et al. Compressibility of solid C60 . Science 252, 1288–1290 (1991).
Schirber, J. E., Kwei, G. H., Jorgensen, J. D., Hitterman, R. L. & Morosin, B. Room-temperature compressibility of C60: intercalation effects with He, Ne and Ar. Phys. Rev. B 51, 12014–12017 (1995).
Rao, A. M. et al. Photoinduced polymerization of solid C60 films. Science 259, 955–957 (1993).
Iwasa, Y. et al. New phases of C60 synthesized at high pressure. Science 264, 1570–1572 (1994).
Yamanaka, S. et al. Electron conductive three-dimensional polymer of cuboidal C60 . Phys. Rev. Lett. 96, 076602 (2006).
Makarova, T. L. et al. Electrical conductivity of polymerized C60 states. Tech. Phys. Lett. 22, 985–988 (1996).
Blank, V. D. et al. Ultrahard and superhard phases produced from C60 by heating under high pressure: structural and Raman studies. Phys. Lett. A 205, 208–216 (1995).
Núñez-Regueiro, M., Marques, L., Hodeau, J.-L., Béthoux, O. & Perroux, M. Polymerized fullerite structures. Phys. Rev. Lett. 74, 278–281 (1995).
Davydov, V. A. et al. Pressure-induced polycondensation of C60 fullerene. JETP Lett. 63, 818–824 (1996).
Blank, V. D. et al. High-pressure polymerized phases of C60 . Carbon 36, 319–343 (1998).
Sundqvist, B. Fullerenes under high pressure. Adv. Phys. 48, 1–134 (1999).
Sundqvist, B. Fullerenes under high pressure in Fullerenes: Chemistry, Physics and Technology (eds. Kadish, K. M. & Ruoff, R. S.) 611–690 (Wiley & Sons, N.Y. 2000).
Sundqvist, B. Polymeric fullerene phases formed under pressure. Structure & Bonding 109, 85–106 (2004).
Moret, R. Structures, phase transitions and orientational properties of the C60 monomer and polymers. Acta Cryst. A 61, 62–76 (2005).
Brazhkin, V. V. & Lyapin, A. G. Hard and superhard carbon phases synthesized from fullerites under pressure. J. Superhard Mater. 34, 400–423 (2012).
Rao, A. M. et al. Properties of C60 polymerized under high pressure and temperature. Appl. Phys. A 64, 231–239 (1997).
Senyavin, V. M. et al. Spectroscopic properties of individual pressure-polymerized phases of C60 . Chem. Phys. Lett. 313, 421–425 (1999).
Haines, J. & Léger, J. M. An X-ray diffraction study of C60 up to 28 GPa. Solid State Commun. 90, 361–363 (1994).
Núñez Regueiro, M., Monceau, P., Rassat, A., Bernier, P. & Zahab, A. Absence of a metallic phase at high pressures in C60 . Nature 354, 289–291 (1991).
Poloni, R. et al. High-pressure stability of Cs6C60 . Phys. Rev. B 77, 125413 (2008).
Wang, L. et al. Long-range ordered carbon clusters: a crystalline material with amorphous building blocks. Science 337, 825–828 (2012).
Mases, M. et al. In situ electrical conductivity and Raman study of C60 tetragonal polymer at high pressures up to 30 GPa. Phys. Status Solidi B 247, 3068–3071 (2010).
Marques, L. et al. “Debye-Scherrer ellipses” from 3D fullerene polymers: an anisotropic pressure memory signature. Science 283, 1720–1723 (1999).
Chi, D. H. et al. Bond switching from two- to three-dimensional polymers of C60 at high pressure. Phys. Rev. B 68, 153402 (2003).
Meletov, K. P. & Kourouklis, G. A. Pressure- and temperature-induced transformations in crystalline polymers of C60 . J. Exp. Theor. Phys. 115, 706–722 (2012).
Sundqvist, B. Detailed mapping of reaction diagrams for metastable phases. MRS Online Proc. Libr. 1519, 1685 (2012).
Dzyabchenko, A. V., Agafonov, V. & Davydov, V. A. A theoretical study of the pressure-induced dimerization of C60 fullerene. J. Phys. Chem. A 103, 2812–2820 (1999).
Davydov, V. A. et al. Particularities of C60 transformations at 1.5 GPa. J. Phys. Chem. B 103, 1800–1804 (1999).
Papoular, R. J. et al. First observation of the fcc to trigonal/rhombohedral transition of pure dimerized C60 under high pressure. Fullerenes, Nanotubes & Carbon Nanostruct. 18, 386–391 (2010).
Moret, R. et al. Single-crystal structural study of the pressure-temperature-induced dimerization of C60 . Eur. Phys. J. B 37, 25–37 (2004).
Persson, P.-A. et al. NMR and Raman characterization of pressure polymerized C60 . Chem. Phys. Lett. 258, 540–546 (1996).
Lebedkin, S. et al. Raman scattering study of C120, a C60 dimer. Chem. Phys. Lett. 285, 210–215 (1998).
Wågberg, T., Jacobsson, P. & Sundqvist, B. Comparative Raman study of photopolymerized and pressure-polymerized C60 films. Phys. Rev. B. 60, 4535–4538 (1999).
Wågberg, T. & Sundqvist, B. Raman study of the two-dimensional polymers Na4C60 and tetragonal C60 . Phys. Rev. B 65, 155421 (2002).
Adams, G. B. & Page, J. B. Theoretical studies of Raman spectra for planar polymerized C60 . phys. stat. sol. (b) 226, 95–106 (2001).
Davydov, V. A. et al. Pressure-induced dimerization kinetics of fullerene C60 . JETP Lett. 72, 557–560 (2000).
Dong, Z.-H. et al. Observations of higher-order Raman modes in C60 films. Phys. Rev. B 48, 2862–2865 (1993).
Iwasa, Y. et al. High yield selective synthesis of C60 dimers. Chem. Commun. 1411–1412 (1998).
David, W. I. F., Ibberson, R. M., Dennis, T. J. S., Hare, J. P. & Prassides, K. Structural phase transitions in the fullerene C60 . Europhys. Lett. 18, 219–225 (1992).
Samara, G. A. et al. Effect of pressure and ambient species on the orientational ordering in solid C60 . Phys. Rev. B 47, 4756–4764 (1993).
Lundin, A. & Sundqvist, B. Compressibility of C60 in the temperature range 150-335 K up to a pressure of 1 GPa. Phys. Rev. B 53, 8329–8336 (1996).
Pintschovius, L., Blaschko, O., Krexner, G. & Pyka, N. Bulk modulus of C60 studied by single-crystal neutron diffraction. Phys. Rev. B 59, 11020–11026 (1999).
Horikawa, T., Kinoshito, T., Suito, K. & Onodera, A. Compressibility measurement of C60 using synchrotron radiation. Solid State Commun. 114, 121–125 (2000).
Vogel, W. High-temperature structure of C60 . Appl. Phys. A 62, 295–301 (1996).
Fagerström, J. & Stafström, S. Formation of C60 dimers: a theoretical study of electronic structure and optical absorption. Phys. Rev. B 53, 13150–13158 (1996).
Ozaki, T., Iwasa, Y. & Mitani, T. Elementary processes in pressure-induced polymerization of C60 . Chem. Phys. Lett 285, 289–293 (1998).
Soldatov, A., Prassides, K., Andersson, O. & Sundqvist, B. Vibrational and thermal properties of pressure polymerized C60 . Electrochem. Soc. Proc. 98-8, 769–777 (1998).
Bashkin, I. O. et al. A new phase transition in the T-P diagram of C60 fullerite. J. Phys.: Condens. Matter 6, 7491–7498 (1994).
Moret, R., Launois, P., Persson, P.-A. & Sundqvist, B. First X-ray diffraction analysis of pressure polymerized C60 single crystals. Europhys. Lett. 40, 55–60 (1997).
Moret, R., Launois, P., Wågberg, T. & Sundqvist, B. High pressure synthesis, structural and Raman studies of a two-dimensional polymer crystal of C60 . Eur. Phys. J. B 15, 253–263 (2000).
Chen, X. & Yamanaka, S. Single-crystal X-ray structural refinement of the ‘tetragonal’ C60 polymer. Chem. Phys. Lett. 360, 501–508 (2002).
Narymbetov, B. et al. The crystal structure of the 2D polymerized tetragonal phase of C60 . Chem. Phys. Lett. 367, 157–162 (2003).
Wågberg, T., Soldatov, A. & Sundqvist, B. Spectroscopic study of phase transformations between orthorhombic and tetragonal C60 polymers. Eur. Phys. J. B 49, 59–65 (2006).
Meletov, K. P., Davydov, V. A., Rakhmanina, A. V., Agafonov, V. & Kourouklis, G. A. High pressure photoinduced polymerization of the orthorhombic polymeric phase of C60 . Chem. Phys. Lett. 416, 220–224 (2005).
Persson, P.-A., Jacobsson, P., Stafström, S. & Sundqvist, B. Enhanced thermal dissociation of optically excited C60 chains. Europhys. Lett. 49, 631–636 (2000).
Andersson, O., Sundqvist, B. & Bäckström, G. A low-temperature high-pressure apparatus with a temperature control system. High Pressure Res. 10, 599–605 (1992).
Sundqvist, B. Improving thermal insulation in high-pressure experiments. Rev. Sci. Instrum. 69, 3433–3434 (1998).
Wågberg, T., Persson, P.-A. & Sundqvist, B. Structural evolution of low-pressure polymerized C60 with polymerization conditions. J. Phys. Chem. Solids 60, 1989–1994 (1999).
Acknowledgements
This work was financially supported by the Swedish Research Council, grant no. 621-2010-3732.
Author information
Authors and Affiliations
Contributions
The single author conceived, planned and carried out all experiments, analyzed all results and wrote the manuscript.
Ethics declarations
Competing interests
The author declares no competing financial interests.
Electronic supplementary material
Supplementary Information
Pressure cell with typical experimental assembly.
Rights and permissions
This work is licensed under a Creative Commons Attribution-NonCommercial-NoDerivs 4.0 International License. The images or other third party material in this article are included in the article's Creative Commons license, unless indicated otherwise in the credit line; if the material is not included under the Creative Commons license, users will need to obtain permission from the license holder in order to reproduce the material. To view a copy of this license, visit http://creativecommons.org/licenses/by-nc-nd/4.0/
About this article

Cite this article
Sundqvist, B. Mapping intermolecular bonding in C60. Sci Rep 4, 6171 (2014). https://doi.org/10.1038/srep06171
Received:
Accepted:
Published:
DOI: https://doi.org/10.1038/srep06171
This article is cited by
-
Investigation of the polymerization mechanism of ferrocene doped C60 under high pressure and high temperature
Scientific Reports (2017)
-
Photoluminescence changes of C70 nano/submicro-crystals induced by high pressure and high temperature
Scientific Reports (2016)
-
Thermal Transport in Fullerene Derivatives Using Molecular Dynamics Simulations
Scientific Reports (2015)
Comments
By submitting a comment you agree to abide by our Terms and Community Guidelines. If you find something abusive or that does not comply with our terms or guidelines please flag it as inappropriate.
