
Abstract
Inspired by ultrastructural analysis of ex vivo human tissues as well as the physiological importance of structural density, we fabricated nanogrooves with 1:1, 1:3 and 1:5 spacing ratio (width:spacing, width = 550 nm). In response to the nanotopographical density, the adhesion, migration and differentiation of human mesenchymal stem cells (hMSCs) were sensitively controlled, but the proliferation showed no significant difference. In particular, the osteo- or neurogenesis of hMSCs were enhanced at the 1:3 spacing ratio rather than 1:1 or 1:5 spacing ratio, implying an existence of potentially optimized nanotopographical density for stem cell function. Furthermore, such cellular behaviors were positively correlated with several cell morphological indexes as well as the expression of integrin β1 or N-cadherin. Our findings propose that nanotopographical density may be a key parameter for the design and manipulation of functional scaffolds for stem cell-based tissue engineering and regenerative medicine.
Introduction
Stem cells are characterized by their unique ability to differentiate into various types of cells, allowing for many alternatives and opportunities in tissue engineering and regenerative medicine1,2,3. It is therefore important to develop a platform to regulate or improve stem cell functions from an integrative aspect of biology and engineering1,2,3,4,5,6,7,8,9,10,11,12,13,14,15,16,17,18. Stem cells reside within instructive and tissue-specific niches in the body, such as complex and controlled biochemical mixtures of soluble and insoluble factors7,19. In particular, it is widely accepted that stem cells display high sensitivity to the extracellular matrix (ECM) composed of complex and well-defined nanostructures of protein fibers such as fibrillar collagens and elastins with feature sizes (diameter and spacing) ranging from tens to several hundreds of nanometers. In conjunction with these observations, previous ex vivo and in vitro studies suggest that the use of nanotopographical cues hold great potentials to control stem cell functions1,2,3,4,5,6,7,19.
The structure of the natural ECM in various tissues including bone, tooth, nerve, skin, muscle and heart usually reveals highly oriented grooved structures with various length scales in nanometers (Fig. 1A)1,5. For example, the concentric nanoscale-thick cylinders enhance mechanical properties of cortical bone, while the aligned collagen matrix in the dermis of skin layer presents anisotropic mechanical properties1. Inspired by such ultrastructural observations, the utilization of nanoengineering technology to develop a nanogrooved matrix has been greatly attractive to biologists and engineers in the fields of classical stem biology and regenerative medicine1,5,20,21,22,23,24. According to previous studies, the controlled polarity and subsequent mechanical tension turned out to be crucial for the cell behaviors such as spreading25,26, migration27,28, proliferation29, cell division30, tissue function31 and tissue formation32 and more importantly differentiation in stem cells20,21,22,33,34,35. For example, Leong's group demonstrated that molded nanogrooves could enhance migration20, stemness21 and neurogenesis22 of hMSCs by inducing nuclear polarity. Dalby's group reported that slightly disordered arrangement of nanoimprinted nanopit arrays could further induce osteogenesis compared to the regularly ordered organization33,34. In the case of electrospun fibers, Xia's group showed that unidirectionally aligned matrices elicited more neurogenesis than the randomly oriented ones presumably due to an increased stem cell polarity35. In this context, ongoing research has provided important insights into the role of nanotopographical cues as an enabling tool to advance the current stem cell-based tissue engineering and regenerative medicine.

Rational design and fabrication of bio-inspired anisotropic nanotopography with various nanogroove sizes.
(A) Graphical illustrations and SEM images of ex vivo bone, nerve and skin of human, showing the well aligned nanostructures with various nanogrooves. The white arrows indicate different sizes of nanogrooves. (B) A photograph of tissue-inspired nanopattern on 1-inch scale coverslip fabricated with PUA. (C) Flat and various nanogroove pattern matrices of 1:1, 1:3 and 1:5 spacing ratios (ridge to groove width) used in this study.
Despite the significant findings mentioned above, there appear a large gap and limitation in several aspects, in order to fully understand the response of stem cells to an anisotropic nanopographical cue such as nanoridges and nanogrooves. First, most studies have dealt with a simple structural design (e.g., nanopattern vs. flat) partly because the nanofabrication techniques were complex, time-consuming and expensive with less control over feature sizes20,21,22,23,24. Second, the underlying mechanisms behind the nanotopography-guided stem cell differentiation have remained unexplored in terms of cell-substrate and cell-cell interactions. Finally, the fate and functions of stem cells in response to a nanotopographical density have been largely unknown not to mention the differentiation of stem cells via various nanotopographical densities even though the density of ECM is known as a critical mediator in maintaining integrity, homeostasis and remodeling of mechano-sensitive tissues such as bone and skin36,37,38.
To address these challenges, we designed and fabricated nanogrooved matrices with various groove densities using ultraviolet (UV)-assisted capillary force lithography (CFL)39. It is hypothesized that the defined nanotopographical density would an important factor for controlling morphology and function of stem cells. We investigated whether the focal adhesion, cytoskeletal organization, migration, proliferation and differentiation of stem cells were regulated by the nanotopographical density. Furthermore, the correlations among the topography-induced morphologies, intracellular and produced protein levels and stem cell functions were analyzed.
Results
Design and fabrication of nanogrooved matrices
In the body, various ECMs exist in the form of well-organized nanoscale protein fibers and they are naturally oriented toward certain directions for tissue-specific functions1,5. Thus the ECM's aligned architectures or oriented nanotopographic features may regulate the morphology and function of stem cells through specific cell-surface interactions such as mechanotransduction2,40,41,42. To examine the human tissue organization in detail, we performed ultrastructural analysis of ex vivo human bone, nerve and skin. The results indicate that there are naturally anisotropic ECM nanostructures with various length scales in the human bone, nerve and skin (Fig. 1A). This observation suggests that the nanotopographical control of ECM may provide a simple route to guiding the structure and function of stem cells in bone, nerve and skin of human. It is hypothesized in this regard that the nanotopographical density (i.e., changing the spacing between nanogrooves) is a key parameter in engineering cell responses, which would allow us to better understand stem cell behaviors as well as to control stem cell functions.
Inspired by the highly oriented nanogrooved structures of natural ECMs in human body (Fig. 1A), we fabricated nanotopographically variable grooved matrices using UV-assisted CFL with UV-curable polyurethane acrylate (PUA) polymer (Figs. 1B, C and S1)43. The 550 nm-wide parallel nanoridges (depth of 600 nm) with the three different inter-groove widths of 550, 1,650 and 2,750 nm (spacing ratios of 1:1, 1:3 and 1:5, respectively) were fabricated onto the glass cover slip along with the flat control (no patterns on PUA surface). Here, the spacing ratio is defined as the ratio of the width of inter-groove spacing to that of nanoridges. The PUA nanogrooved matrices were then coated with gelatin prior to cell plating. As can be seen from Figs. 1B and C, the structures were well-defined with high physical integrity and uniformity over an area of 2.5 × 2.5 cm2.
Analysis of hMSC shape and orientation by nanotopographical density in single and multi-cell level
To investigate the effects of stem cell shape and orientation by the nanotopographical density in the single cell level, the immunofluorescence staining analysis was used. As shown in Figs. 2A and B, the nanotopographical density greatly influenced the hMSC polarity as supported by the aligned cytoskeletal structure of hMSCs in response to various nanotopographical densities. The hMSCs on the sparser nanogrooves elongated more strongly than those on the relatively denser nanogrooves (i.e., 1:5 > 1:3 > 1:1 nanogrooved pattern) (Fig. 2A). Also, the hMSCs showed relatively spherical shapes on the flat control (unpatterned substrate) compared to those on the nanogrooved matrices (Fig. 2A). To quantify the observed cell polarities, cell elongation factors [CEF; defined as (major axis)/(minor axis)] of hMSCs were calculated. Surprisingly, the CEF of hMSCs on the 1:5 nanogrooved pattern was approximately 2 times higher than that on the 1:1 nanogrooved matrices (Fig. 2B).

Effect of nanotopographical density on the cell morphology.
(A) Representative immunofluorescent images of F-actin (red), vinculin (green) and DAPI (blue) of hMSCs cultured on the flat and various nanopatterned surfaces, indicating that the structure of hMSCs was sensitively regulated by nanotopographical density. (B and C) Quantification of cell body and nucleus. The values of perimeter and area were normalized to the flat substrates. The 50–100 cells were used for quantification. Error bars represent the SD about the means. (D) Correlation between cell body and nucleus.
We also analyzed the nucleus of hMSCs on the nanogrooved matrices since it has been known that the nuclear architecture and organization may influence cell function24,43. It was reported earlier that the presence of nanogrooves strongly influenced the structural changes of nucleus of hMSC24. As shown in the immunofluorescence staining images of Fig. 2A, the nucleus of hMSCs on the sparser nanogrooves elongated more than those on the denser nanogrooves, which was also confirmed with a quantitative analysis of the nuclear elongation factor [NEF; defined as (major axis)/(minor axis)] (Fig. 2C). Interestingly, the increase of NEF was correlated with the decrease of short axis, not with the increase of long axis.
Unlike the monotonic trends of CEF and NEF, the perimeter of cell body and nucleus pertinent to a specific nanotopographical density was lowest at the 1:3 pattern as compared to the other 1:1 and 1:5 patterns (Figs. 2B and C). In parallel, the spreading area of cell body and nucleus monotonically decreased with the decrease of the nanotopographical density (Figs. 2B and C). As an alternative morphological index, we introduce here the cell shape index which is calculated as follows: cell shape index (CSI) = (cell area)/(cell perimeter)2; and nucleus shape index (NSI) = (nucleus area)/(nucleus perimeter)244,45,46. Unlike the increasing trend of CEF and NEF, the CSI and NSI showed higher values at the 1:3 pattern. Interestingly, strong correlations were observed between the calculated values of the cell body and nucleus (Fig. 2D), indicating that the body and nucleus of hMSCs might be closely interconnected each other to regulate their functions47,48.
To investigate the polarity of stem cells by the nanotopographical density in the multi-cells level, we cultured hMSCs on the nanogrooved matrices for 148 h, after cell seeding (Fig. S2). Two notable findings were derived from this experiment. First, the hMSCs on the nanogrooves with larger spacing ratio were more orientated along the direction of nanogrooves than those on the denser nanogrooves in the multi-cell level (i.e., 1:5 > 1:3 > 1:1 nanogrooved pattern). Second, the hMSCs were becoming more orientated along the direction of nanogrooves with time even for the dense nanogroove pattern (1:1 nanogrooved matrix), which was confirmed via a time-resolved quantitative analysis (Fig. S2). Taken together, these findings suggest that the density of nanogrooves can determine the morphology and orientation of stem cells and, thus, may be employed as an efficient regulator of stem cell adhesion and functions.
Analysis of hMSC adhesion by nanotopographical density
Scanning electron microscope (SEM) observations clearly showed the controlled hMSC adhesion according to the nanotopographical density (Fig. 3). As can be seen, the nanogrooved matrices could control the shape and orientation of hMSCs by the density of nanogrooves, suggesting that they may influence interactions at the cell-substrate.

Representative SEM images of cellular morphologies on various nanopatterned surfaces.
(A) SEM images of cellular morphologies on 1:1, 1:3 and 1:5 nanogrooved matrices (top view). (B) Low- and (C) high- magnification images of the tilted view of hMSCs on the flat and nanogrooved matrices. The (*) indicates the flat substrate. The black arrows indicate that the cells were adhered on the ridge of the nanogrooved matrices. The deformation of ridges on the nanopattern was observed (white arrow).
We observed that the focal adhesions (FAs) of hMSCs were polarized along the direction of nanogrooved matrices (Figs. 4A and B), being more polarized with the sparser nanogrooved density as compared to the relatively denser nanogrooved density. On the other hand, un-polarized FAs on the 1:5 nanogrooved pattern were observed, which was marked with yellow arrows in Fig. 4A, suggesting that some portions of the hMSCs were directly penetrated into the 1:5 nanogrooved pattern (at the bottom of the sparser grooves). In addition, the nanotopographical density affected the size of FAs such that larger FA sizes were observed on the sparser nanogroove patterns (Fig. 4). The FAs and cytoskeletal structures of hMSCs were organized along the ridges of the nanogrooved matrices with a high co-localization of the FAs and actin cytoskeleton (Fig. 4A); the ridge regions were typically characterized by higher fluorescence intensity compared to the groove regions regardless of the size of nanogrooves.

Effect of nanotopographical density on the organization of focal adhesions.
(A) Immunostaining images and colorimetric plot of F-actin and focal adhesions, showing the high co-localization between the FAs and actin cytoskeleton of hMSCs. F-actin (red) and vinculin (green). (B) Angular distribution of focal adhesions. An orientation of 0° represents perfect alignment with the ridge/groove direction. The 200 cells were used for quantification. (C) Probability colorimetric map of focal adhesion (FA) area. Increased portion of large FA in 1:3 (white arrow) and 1:5 (yellow arrow). The 1:5 spacing ratio show dual-peak at 6–8 and 24–26 μm2 ranges. The 200 cells were used for quantification. (D) Focal adhesion clustering index. The focal adhesion clustering index was calculated by diving the area of top 10% of large focal adhesion sites with the area of unit FA (5 μm2). The radius of circle represents SD.
From the analysis of FAs of hMSCs with the nanotopographical density cues, we have shown several interesting findings (Fig. 4): (1) The high co-localization of the FAs and actin cytoskeleton of hMSCs was observed regardless of the nanotopographical density. (2) The FAs of hMSCs were differently formed by the direction and nanotopographical density; the FAs were more polarized on the sparser nanogrooved patterns as compared to the relatively denser ones. (3) The lower density (1:5 nanogrooved pattern in our case) led to the formation of un-polarized FAs at the bottom of the grooves (yellow arrows in Fig. 4A; 1:5 pattern), thus showing less polarized FA organization (Fig. 4B; 1:5 pattern). (4) The larger sizes of FAs were observed on the sparser patterns than those on the relatively denser patterns. As shown in the probability map of FA area (Fig. 4C), the 1:3 pattern shows increased portion of large FA (indicated in white arrows) and the 1:5 pattern demonstrated dual-peaks at 6–8 and 24–26 μm2 ranges (indicated in yellow arrows). (5) The increasing trend of FA size from flat to 1:5 was presumably due to the clustering of integrin at the nanogrooves (Figs. 4C and D). Here, the focal adhesion clustering index was calculated by dividing the area of top 10% of large FA sites with that of unit FA (area of unit FA was known in the range of 1–5 μm2, here we used 5 μm2 as a mean value for the quantification)56. As shown in Fig. 4D, the FA was highly clustered as the spacing ratio increased from 1:1 to 1:5.
Together, our data strongly suggest that the modified FAs and cytoskeletal structures of hMSCs may have reconstructed their mechanotransduction pathways, guiding the differentiation in a certain direction47.
Analysis of hMSC migration by nanotopographical density
In general, migration of cells is an important cell behavior for wound healing49. As shown in Fig. 1A, aligned collagen nanofibers with different groove density were observed in the human skin, indicating that the stem cells in skin may be mediated by aligned collagen nanofibers. To investigate whether stem cell migration is affected by the nanotopographical density, we cultured hMSCs on the nanogrooved matrices in the in vitro wound healing model; the hMSCs migrated into the cell free area (target area) and the covering rate of hMSCs was evaluated with a similar method reported earlier49,50. We observed that the hMSCs on the nanogrooved matrices showed a significantly higher cell migration speed (i.e., covering rate of hMSCs along the direction of nanogrooved matrices) compared to those on the flat control (Fig. S3). In parallel, the covering rate of hMSCs on the 1:5 nanogrooved pattern was significantly lower compared to those on the 1:1 or 1:3 nanogrooved patterns. Our data suggest that the migration of stem cells may be sensitive to the density of nanogrooves and the denser nanogrooved matrices may elicit faster migration of stem cells than the sparser ones.
Analysis of hMSC proliferation by nanotopographical density
We cultured hMSCs on the nanogrooved matrices for 148 h and analyzed the cell viability of hMSCs. It turned out that no significant difference among the flat and nanogrooved matrices (Fig. S4) was observed despite the fact that the proliferation of 1:3 nanogrooved pattern was slightly lower than the other samples. These results corroborate with previous observations that the proliferation of cells may be not strongly influenced by the nanogrooves49,51.
Analysis of hMSC differentiation by nanotopographical density
Given that naturally anisotropic nanostructures were observed in the human bone (Fig. 1A), we cultured hMSCs on the nanogrooved matrices with osteogenic induction media for 21 days. Then, we analyzed hMSC osteogenesis by the mineralization. The images of Alizarin Red S staining (Fig. 5A) and von Kossa staining (Fig. 5B) demonstrated that the calcium expression was higher for the nanogrooved patterns than that of the flat control. Specifically, the intensity was highest at the 1:3 nanogrooved pattern, while recognizing that the 1:5 case was comparable to the flat control (Figs. 5A and B). To quantify the degree of osteogenesis, the stained calcium deposits by Alizarin Red S staining were destained with cetylpyridinium chloride and then the extracted stains were measured using an ELISA reader. As shown in Fig. 5C, we observed that the 1:3 nanogrooved pattern exhibited the highest osteogenesis, while the cell viability in terms of the number of cells was not altered among the different samples (Fig. 5D). It is noted that the osteogenesis showed a biphasic trend; the intensity first increased from the flat control to the 1:3 nanogrooved pattern and then decreased at the 1:5 nanogrooved pattern, revealing possible existence of an optimum nanotopographical density in the stem cell differentiation. We further examined osteocalcin (OCN) as one of the osteogenic genes to confirm the enhanced osteogenic differentiation of hMSCs on the 1:1 nanogrooved pattern as compared to the 1:5 nanogrooved pattern (Fig. 5E). Together, we showed that the nanotopographical density could regulate the osteogenesis of hMSCs.

Osteogenesis of hMSCs on various nanopatterned surfaces.
(A) Alizarin Red S and (B) Von Kossa staining of hMSCs cultured on the nanogrooved matrices and flat as a control for 21 days in osteogenic medium. The arrows indicate the mineralized bone nodules formed. Quantification of (C) the degree of mineralization as measured by Alizarin red S staining (D) cell viability of cells for 21 days and. All values were normalized to the control. Error bars represent the SD about mean (n = 3 for each group). (E) Representative immunofluorescent staining of OCN (osteogenesis marker; green) of hMSCs on the nanogrooved matrices for 7 days in osteogenic medium, showing the higher expression of the OCN of cells on the 1:1 nanopattern than that on the 1:5 nanopattern.
Next, the effect of nanotopographical density on the neurogenesis of hMSCs was investigated inspired by the aligned nanofibril ECMs in the human nerve (Fig. 1A). Here, we hypothesized that the nanotopographical density would also be a key factor to regulate the neurogenesis of stem cells. The effect of nanotopographical density on the neurogenesis was investigated by employing immunostaining of neural stem cell markers such as Tuj1 (early neural marker) and NeuN (later neural marker). As shown in Figs. 6A and B, the differentiated cells showed different Tuj1 (neuron-specific class III beta-tubulin) and NeuN (neuronal nuclei) levels depending on the pattern spacing ratio. The number of Tuj1- and NeuN-positive cells was increased at the flat control and the 1:1, 1:3 nanogrooved patterns and then decreased at the 1:5 nanogrooved pattern, demonstrating a similar biphasic trend to the case of osteogenesis (maximum at the 1:3 nanogrooved pattern). The density of nanopatterns also affected apparent cellular morphologies such as number of neurites, length of neurites and elongation of nucleus. The number of neurites of the cells was lower on the grooved patterns compared to the flat control, with its value being lowest at the 1:3 nanogrooved pattern, an opposite trend to the case of neurogenesis. Interestingly, the length of neurites followed the same trend with the osteogenesis, being the highest at the 1:3 nanogrooved pattern. Arguably, the nuclear shape index (elongation of nucleus) did not show a biphasic response, displaying a plateau with the increase of the groove spacing, suggesting that there may be some complex interactions at the cell-surface interface.

Neurogenesis of hMSCs on various nanopatterned surfaces.
(A) Representative immunofluorescent staining of Tuj1 (red), NeuN (green) and DAPI (blue) of hMSCs on flat and nanogrooved matrices with the use of neurogenesis medium. (B) Quantification of the degree of neurogenesis (number of cells stained with Tuj1 and NeuN/total number of cells (DAPI)), number of neuritis, length of neuritis and nuclear shape index. The nuclear shape index was normalized to the flat substrate. The ten images per each substratum were used for quantification, respectively.
Based on our experimental observations with the literatures, we studied how the nanotopographical density could control the differentiation of hMSCs by considering three major factors and their roles: (1) biochemical soluble factors, (2) cell-substrate, (3) cell-cell interactions.
-
Biochemical soluble factors: It is widely accepted that the soluble chemical factors including cytokine are important for the regulation of cellular function3,19,53. For example, the bone morphogenetic protein-2 (BMP-2) and vascular endothelial growth factor (VEGF) are known as important cytokines for osteogenesis54. However, our analysis demonstrated that the nanotopographical density did not greatly influence the production of BMP-2 or VEGF during culturing hMSCs on the flat and nanogrooved matrices (Figs. 7A and B). Thus it appears that the nanotopographical density may influence the differentiation of hMSCs by altering the cell-substrate or cell-cell interactions.
Figure 7 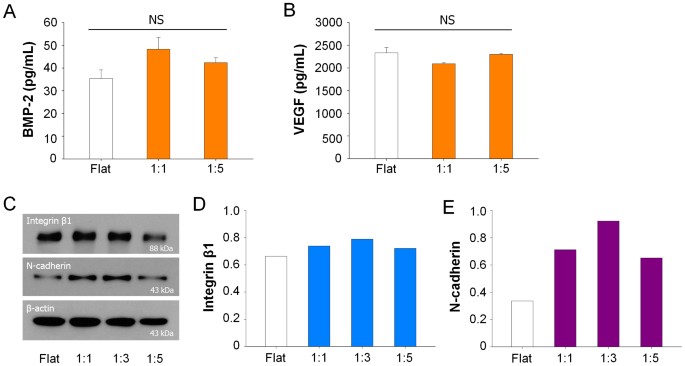
Quantification of biochemical soluble factors and proteins according to nanotopographical density.
Quantification of (A) BMP-2 and (B) VEGF protein in conditioned medium of hMSCs on the nanogrooved matrices and flat substrate for 21 days. The results indicate no significant difference between the nanotopography and flat (P > 0.05). (C) Western blot analysis and (D) quantification of the values of integrin β1 and N-cadherin expression of hMSCs cultured on nanogrooved matrices and flat substrate. The hMSCs were cultured for 7 days and the western blot study was performed under same experimental conditions.
-
Cell-substrate interactions: To investigate whether the nanotopographical density is capable of altering the interactions at the cell-substrate, we cultured hMSCs on the nanogrooved matrices for 7 days before complete confluence of hMSCs. We observed that the hMSCs were mostly adhered on the ridges of the nanogrooved matrices (Fig. 3C) although some portions of the hMSCs made direct adhesions at the bottom of 1:5 nanogrooved pattern (Fig. 4A). Western blot analysis clearly showed the decreased expression of the integrin β1 in hMSCs cultured on the 1:5 nanogrooved pattern compared to that on the 1:1 or 1:3 nanogrooved patterns (Figs. 7C and D). The expression of the integrin β1 showed a biphasic trend, i.e., increasing from flat to 1:3 nanogrooved pattern and decreasing thereafter to the 1:5 nanogrooved pattern. In an alternative analysis, the change of integrin β1 was similar to the CSI and NSI, but not to the CEF and NEF (Figs. 2B and C).
-
Cell-cell interactions: Next, we discuss the cell-cell contacts on the nanogrooved matrices. To this end, we checked the expression levels of the N-cadherin. We found higher expressions of N-cadherin on the nanogrooved matrices regardless of the nanogroove density compared to the flat substrate (Figs. 7C and E). We also showed that the expression of N-cadherin was increased on the 1:1 and 1:3 nanogrooved pattern whereas it was reduced on the 1:5 nanogrooved pattern.

Discussion
Designing materials from the concept of “stem cell niche” has been emerging as a powerful strategy for quantitative analysis of stem cell behaviors as well as stem cell-based regenerative therapies7,40. In this study, we designed various anisotropic nanotopographical cues inspired from our observations that the ECMs in skin, bone and nerve of human exist in the form of nanogroove structures with various length feature scales (diameter and spacing) (Fig. 1A). We thus fabricated variable grooved matrices, which have proven effective for investigating the effects of nanotopographical density on the morphology and function of stem cells. Using our platforms, we found considerable differences in the morphologies of hMSCs according to the nanotopographical density (Figs. 2 and 4A). This finding is especially important because it has been recently reported that shape of hMSCs may lead to regulating the cell functions, in particular for differentiation, by regulating the levels of RhoA, ROCK and myosin light chain phosphorylation47. Namely, one can expect that the nanotopographical density may play a key role in controlling the differentiation of stem cells by regulation of cytoskeletal tension as well as its related signaling pathways.
Kirmizidis et al. reported that the microfabricated grooved substrates decreased the osteoblast differentiation compared to the flat substrates even though the cells on the microgrooved substrates were highly elongated52. In contrast to this study, we found that the nano grooved substrates increased the osteoblast differentiation of hMSCs, where the topographical density played a key role in the detailed morphological changes and functions of the cells. It appears that the interaction or contact at the cell-bound interface may be more important that the elongated cell shape itself for the regulation of stem cell differentiation.
We also showed that the anisotropic nanotopography enhanced the neurogenesis of hMSCs as well as neurite growth. In this experiment, the nanotopographical density per se could control the neural differentiation of hMSCs and their cellular morphologies such as number of neurites, length of neurites and elongation of nucleus. We further observed that the later neural markers such as NeuN were more expressed by culturing hMSCs on the 1:3 nanogrooved pattern than those on the 1:5 nanogrooved pattern even though their nuclear elongation was not significantly different (Fig. 6), suggesting that the interactions associated with the hMSCs and nanotopographical density might be important for the neurogenesis of hMSCs.
Previous studies have proven the role of various nanotopographical cues such as feature size4,20,21,22,23 and degree of ordering33,34 to direct stem cell fate. Especially for the last several years the elongation of nucleus or cytoskeleton has been recognized as a crucial factor for the topography-induced stem cell differentiation2,3,20,21,22,23,24,47. In this study, only the spacing of nanogrooves was varied with the fixed width of nanoridges, thus modulating the pattern densities. As a result, although the nuclear shape index showed less significant difference between 1:3 and 1:5 spacing ratio, the osteo- and neurogenesis were even decreased with increasing the spacing ratio from 1:3 to 1:5 cases. This indicates that the elongation of nucleus might not be a major indicator for the stem cell fate despite that a further basic research on this issue is required to elucidate the specific signaling pathway.
At this stage, the analysis of FAs may give guidance in explaining the biphasic trends of osteo- and neurogenesis via polarization of the cell body and nucleus. FA is known as a potential mechanosensor to be important in cellular functions47,55 and it has been reported that nanogrooved topographies may influence directly the formation of FAs in stem cells20,23,47. As shown in Fig. 4, the results suggest that nanotopographical density may control the formation of FAs of stem cells, which would be an important regulator of stem cell functions. In terms of the polarity, the 1:5 spacing ratio showed maximum polarity due to the presence of (i) very large FA cluster size (Fig. 4A yellow arrows), thick F-actin bundles and (ii) highly oriented FA clusters. These observations were strongly supported by the increasing trend of cell body and nucleus elongation (Fig 2B). Such polarization may induce anisotropic organization of F-actin and internal tension and accordingly migration and differentiation behaviors. Our findings suggest that too much polarization might decrease the differentiation of hMSCs as supported by the reduced osteo- and neurogenesis with the 1:5 spacing ratio compared to the 1:3 ratio. Such a hypothesis was further supported by the controlled elongation of cell body through the microcontact printing of ECM57,58,59. In this work, when comparing the aspect ratios of 1:1, 1:3 and 1:5 islands, reduced differentiation of hMSCs was observed with the aspect ratio of 1:5, suggesting that there might be an optimum polarity for stem cell differentiation.
Taken together, our data collectively suggest that the nanotopographical density may be able to control the interactions at cell-substrate and cell-cell interfaces. Specifically, our analyses based on biochemical soluble factors, western blot assay and FAs reveal that the nanotopographical density provides specific cues to the differentiation of hMSCs (Figs. 8A–D). Namely, according to the western blot assay, the expression of integrin β1 and N-cadherin showed a similar biphasic trend to osteo- and neurogenesis. As shown in Figs. 8B and C, the expression and organization of integrin and cadherin can be controlled by the topography-induced cell body and nucleus shape through the cell-substrate or cell-cell interactions on nanotopographical density. These results further confirm that the anisotropic topographical density per se has ability to mediate the cell-substrate and cell-cell interactions and thus osteo- and neurogenesis of the cells. We showed a highly positive correlation coefficient between the expression of integrin β1 or N-cadherin and the osteo- and neurogenesis (Figs. 8C and D).

Relative trends of morphological factors, intracellular protein levels and cell functions with respect to the nanotopographical densities.
(A) Illustrative summary of cellular responses on various nanopatterned surfaces. (B) Trends of morphological index according to the nanotopographical density such as cell body elongation, nuclear elongation, CSI [(area)/(perimeter)2] and a reciprocal of CSI [(perimeter)2/(area)]. (C) Trends of intracellular proteins for cell-substrate interaction (integrin β1) and cell-cell interaction (N-cadherin). (D) Relative trends of osteogenesis, neurogenesis, migration and proliferation according to the pattern density. All values obtained in this study were normalized from 0 and 1.
Further discussion follows regarding additional correlation between the morphology (CEF, NEF, CSI and NSI) and the osteo- and neurogenesis of hMSCs. Overall, it seems that the elongation of nucleus mediates stem cell differentiation through tethered intracellular tension. However, the results shown in Fig. 2 indicate two interesting aspects: (i) the difference of nucleus shapes according to various nanopatterns was less correlated to the trend of cell body and (ii) the tendency of osteo- and neurogenesis decreased between 1:3 and 1:5 spacing ratio in spite of the increasing trend of NEF, showing discrepancy with previous studies22. These results imply the necessity of alternative factors instead of the CEF and NEF which simply describes cell morphology with the ratio of long and short axes. For example, although the trend of CSI and NSI could not explain the osteo- and neurogenic trends between flat vs. nanopatterned surfaces, they showed interesting coincidence with the osteo- and neurogenesis on various nanotopographical densities. Such difference of CEF/NEF and CSI/NSI is due to the relatively less deformed nucleus. As shown in Fig. 2, the increased elongation factor of cell body mainly resulted from the decrease of the short axis, not from the elongation of the long axis. However, as the spacing ratio increased from 1:3 to 1:5, the short axis of cell body became similar to the short axis of nucleus. For this reason, in the 1:5 spacing ratio the cells showed bulged morphology in the position of nucleus, with a slender cell body. Therefore, the elongation factor itself cannot present sufficient information as to whether the cell body is smooth or bulged, except for the aspect ratio. On the other hand, as an alternative indicator, CSI and NSI can present more reasonable quantification on the cell and nucleus morphologies since they contain ‘perimeter’ and ‘spreading area’ as parameters. The correspondence between the osteo- and neurogenic trends and CSI and NSI strongly support the significance of cell and nucleus shape as an indirect, complementary indicator (Figs. 8B and D). Therefore, CEF and NEF may possess better ability when simply comparing flat vs. nanopatterned surfaces, but CSI and NSI present more valuable information when various patterned surfaces are involved. Our results therefore imply that the elongation of nucleus or cell body, which has been identified as a key regulator, may be not the sufficient condition for the stem differentiation, but the moderate cell polarity-induced cell-substrate (up-regulation) and cell-cell interactions (up-regulation) may be more responsible for the stem cell fate and functions.
In this work, we used the gelatin to improve the initial cell attachment on the nanogrooves. To verify whether the gelatin coating truly affects the cell behavior, we cultured the hMSCs on the gelatin-uncoated nanogrooved matrices for 7 days before complete confluence of hMSCs (Supplementary information S5). We checked the expression levels of the N-cadherin in the absence of gelatin coating. The western blot assay showed that higher expressions of N-cadherin on the nanogrooved matrices (1:1 and 1:3 spacing ratio) compared to the flat substrate and the expression of N-cadherin was significant on the 1:1 and 1:3 nanogrooved pattern whereas it was reduced on the 1:5 nanogrooved pattern, which is similar trend to the gelatin-coated nanogrooved matrices (Fig. 7C). Furthermore, to verify whether the nanotopographical density can affect molecular signaling, we checked the upregulation of phosphorylated-ERK (p-ERK) in the absence and presence of gelatin coating. As shown in Figs S5 and S6, we found that the nanotopographical density affected the p-ERK pathway, which is involved in mediating cell functions (especially in differentiation). Interestingly, the ERK was upregulated at the 1:1 and 1:3 nanogrooved patterns and then decreased at the 1:5 nanogrooved pattern, showing a similar biphasic trend to the case of differentiation of hMSCs (maximum at the 1:3 nanogrooved pattern). Although the in-depth studies are still required to understand the underlying molecular mechanisms accurately, the current work has revealed that the density of nanotopography may be able to regulate the cell signaling pathway.
In summary, we demonstrated the effects of nanotopographical density on the morphology and differentiation of mesenchymal stem cells. Using nanogrooved matrices mimicking the native tissues, we found that the body and nucleus of hMSCs with the sparser nanogrooved pattern elongated and orientated more along the direction of nanogrooves than those with the relatively denser nanogroove patterns. In contrast, the perimeter of the cells was lower at the 1:3 pattern as compared to the 1:1 and 1:5 patterns. We also found that the topographical density-dependent shape of cell body and nucleus, formation of FAs and interactions at the cell-substrate and cell-cell interfaces might collectively regulate the functions of hMSCs. In addition, we have investigated the role of nanotopographical density on the function of hMSCs. It was observed that the denser nanogrooved matrices guided faster migration of hMSCs than the sparser nanogrooved matrices. Furthermore, the effect of nanotopographical density on the osteo- or neurogenesis of hMSCs was significant at the 1:1 and 1:3 nanogrooved patterns, but not significant at 1:5 nanogrooved pattern compared to that at the flat substrate. We showed a high positive correlation between the expression of integrin β1 or N-cadherin and the osteo- and neurogenesis. We also found some intriguing correlations between the cell body- or nucleus perimeter/spreading-based shape index and the osteo- and neurogenesis of hMSCs. Although the in-depth studies are still required to understand the underlying molecular mechanisms accurately, the current work has revealed that the density of nanogrooves may be able to regulate the structure and enhanced osteo- or neurogenesis of stem cells, which would allow us to set up an efficient strategy for designing scaffolds for stem cell and tissue engineering applications as well as for understanding fundamental stem cell biology.
Methods
The nanopatterned surfaces were fabricated by UV-assisted capillary molding technology. The hMSCs were isolated from human adipose tissues and the approval of the Institutional Review Board of the Ajou University of Medicine (Suwon, Korea). SEM, immunostaining and western blot analysis were performed. A commercially available ELISA kits (R&D Systems, USA) was used to measure the level of total BMP-2 and VEGF production from cells. Quantitative analysis was performed by using custom-written MATLAB scripts. Details are described in the SI Text.
References
Kim, H. N. et al. Nanotopography-guided tissue engineering and regenerative medicine. Adv. Drug Deliv. Rev. 65, 536–558 (2013).
Guilak, F. et al. Control of stem cell fate by physical interactions with the extracellular matrix. Cell Stem Cell 5, 17–26 (2009).
Nelson, T. J., Behfar, A., Yamada, S., Martinez-Fernandez, A. & Terzic, A. Stem cell platforms for regenerative medicine. Clinical and Translational Science 2, 222–227 (2009).
Chen, W. et al. Nanotopography influences adhesion, spreading and self-renewal of human embryonic stem cells. Acs Nano 6, 4094–4103 (2012).
Kim, D. H., Provenzano, P. P., Smith, C. L. & Levchenko, A. Matrix nanotopography as a regulator of cell function. J. Cell Biol. 197, 351–360 (2012).
Vunjak-Novakovic, G. & Scadden, D. T. Biomimetic platforms for human stem cell research. Cell Stem Cell 8, 252–261 (2011).
Lutolf, M. P., Gilbert, P. M. & Blau, H. M. Designing materials to direct stem-cell fate. Nature 462, 433–441 (2009).
Shi, X., Chen, S., Zhao, Y., Lai, C. & Wu, H. Enhanced osteogenesis by a biomimic pseudo-periosteum-involved tissue engineering strategy. Adv. Healthcare Mater 2, 1229–1235 (2013).
Place, E. S., Evans, N. D. & Stevens, M. M. Complexity in biomaterials for tissue engineering. Nat. Mater. 8, 457–470 (2009).
Stevens, M. M. & George, J. H. Exploring and engineering the cell surface interface. Science 310, 1135–1138 (2005).
Zorlutuna, P. et al. Microfabricated biomaterials for engineering 3D tissues. Adv. Mater. 24, 1782–1804 (2012).
Fisher, O. Z., Khademhosseini, A., Langer, R. & Peppas, N. A. Bioinspired materials for controlling stem cell fate. Acc. Chem. Res. 43, 419–428 (2010).
Coelho, M. B., Cabral, J. M. & Karp, J. M. Intraoperative stem cell therapy. Annu. Rev. Biomed. Eng. 14, 325–349 (2012).
Ferreira, L., Karp, J. M., Nobre, L. & Langer, R. New opportunities: The use of Nanotechnologies to manipulate and track stem cells. Cell Stem Cell 3, 136–146 (2008).
Bettinger, C. J., Langer, R. & Borenstein, J. T. Engineering substrate topography at the micro- and nanoscale to control cell function. Angew. Chem. Int. Edit. 48, 5406–5415 (2009).
Pham, Q. P., Sharma, U. & Mikos, A. G. Electrospinning of polymeric nanofibers for tissue engineering applications: A review. Tissue Eng. 12, 1197–1211 (2006).
Atala, A., Kasper, F. K. & Mikos, A. G. Engineering complex tissues. Sci. Transl. Med. 4, 160rv112 (2012).
Fong, E. L. S., Watson, B. M., Kasper, F. K. & Mikos, A. G. Building bridges: leveraging interdisciplinary collaborations in the development of biomaterials to meet clinical needs. Adv. Mater. 24, 4995–5013 (2012).
Lutolf, M. P. & Blau, H. M. Artificial stem cell niches. Adv. Mater. 21, 3255–3268 (2009).
Kulangara, K., Yang, Y., Yang, J. & Leong, K. W. Nanotopography as modulator of human mesenchymal stem cell function. Biomaterials 33, 4998–5003 (2012).
Zhao, F. et al. Low Oxygen tension and synthetic nanogratings improve the uniformity and stemness of human mesenchymal stem cell layer. Mol. Ther. 18, 1010–1018 (2010).
Yim, E. K. F., Pang, S. W. & Leong, K. W. Synthetic nanostructures inducing differentiation of human mesenchymal stem cells into neuronal lineage. Exp. Cell Res. 313, 1820–1829 (2007).
Yim, E. K. F., Darling, E. M., Kulangara, K., Guilak, F. & Leong, K. W. Nanotopography-induced changes in focal adhesions, cytoskeletal organization and mechanical properties of human mesenchymal stem cells. Biomaterials 31, 1299–1306 (2010).
Chalut, K. J., Kulangara, K., Giacomelli, M. G., Wax, A. & Leong, K. W. Deformation of stem cell nuclei by nanotopographical cues. Soft Matter 6, 1675–1681 (2010).
Kim, D. H. et al. Mechanosensitivity of fibroblast cell shape and movement to anisotropic substratum topography gradients. Biomaterials 30, 5433–5444 (2009).
Prager-Khoutorsky, M. et al. Fibroblast polarization is a matrix-rigidity-dependent process controlled by focal adhesion mechanosensing. Nat. Cell Biol. 13, 1457–1465 (2011).
Kim, D. H. et al. Guided cell migration on microtextured substrates with variable local density and anisotropy. Adv. Funct. Mater. 19, 1579–1586 (2009).
Jiang, X. Y., Bruzewicz, D. A., Wong, A. P., Piel, M. & Whitesides, G. M. Directing cell migration with asymmetric micropatterns. Proc. Natl. Acad. Sci. USA 102, 975–978 (2005).
Yim, E. K. F. et al. Nanopattern-induced changes in morphology and motility of smooth muscle cells. Biomaterials 26, 5405–5413 (2005).
Thery, M., Jimenez-Dalmaroni, A., Racine, V., Bornens, M. & Julicher, F. Experimental and theoretical study of mitotic spindle orientation. Nature 447, 493–496 (2007).
Kim, D. H. et al. Nanoscale cues regulate the structure and function of macroscopic cardiac tissue constructs. Proc. Natl. Acad. Sci. USA 107, 565–570 (2010).
Bettinger, C. J., Zhang, Z. T., Gerecht, S., Borenstein, J. T. & Langer, R. Enhancement of in vitro capillary tube formation by substrate nanotopography. Adv. Mater. 20, 99–103 (2008).
Dalby, M. J. et al. The control of human mesenchymal cell differentiation using nanoscale symmetry and disorder. Nat. Mater. 6, 997–1003 (2007).
McMurray, R. J. et al. Nanoscale surfaces for the long-term maintenance of mesenchymal stem cell phenotype and multipotency. Nat. Mater. 10, 637–644 (2011).
Xie, J. W. et al. The differentiation of embryonic stem cells seeded on electrospun nanofibers into neural lineages. Biomaterials 30, 354–362 (2009).
Fisher, G. J., Varani, J. & Voorhees, J. J. Looking older: fibroblast collapse and therapeutic implications. Arch. Dermatol. 144, 666–672 (2008).
Klein-Nulend, J., Bacabac, R. & Bakker, A. Mechanical loading and how it affects bone cells: The role of the osteocyte cytoskeleton in maintaining our skeleton. Eur. Cells Mater. 24, 278 (2012).
Burger, E. H. & KLEIN-NULEND, J. Mechanotransduction in bone–role of the lacuno-canalicular network. FASEB J. 13, S101–S112 (1999).
Suh, K. Y., Park, M. C. & Kim, P. Capillary force lithography: a versatile tool for structured biomaterials interface towards cell and tissue engineering. Adv. Funct. Mater. 19, 2699–2712 (2009).
McNamara, L. E. et al. Nanotopographical control of stem cell differentiation. J. Tissue Eng. 1, 120623; 10.4061/2010/120623 (2010).
Teixeira, A. I., Abrams, G. A., Bertics, P. J., Murphy, C. J. & Nealey, P. F. Epithelial contact guidance on well-defined micro- and nanostructured substrates. J. Cell Sci. 116, 1881–1892 (2003).
Cha, C. B, L. W., Khademhosseini, A. & Peppas, N. A. Designing biomaterials to direct stem cell fate. Acs Nano 6, 9353–9358 (2012).
Choi, S. J., Kim, H. N., Bae, W. G. & Suh, K. Y. Modulus- and surface energy-tunable ultraviolet-curable polyurethane acrylate: properties and applications. J. Mater. Chem. 21, 14325–14335 (2011).
Malek, A. M. & Izumo, S. Mechanism of endothelial cell shape change and cytoskeletal remodeling in response to fluid shear stress. J. Cell Sci. 109, 713–726 (1996).
Kim, J. et al. Charged nanomatrices as efficient platforms for modulating cell adhesion and shape. Tissue Eng. Part C Methods 18, 913–923 (2012).
Versaevel, M., Grevesse, T. & Gabriele, S. Spatial coordination between cell and nuclear shape within micropatterned endothelial cells. Nat. Commun. 3, 671 (2012).
McBeath, R., Pirone, D. M., Nelson, C. M., Bhadriraju, K. & Chen, C. S. Cell shape, cytoskeletal tension and RhoA regulate stem cell lineage commitment. Dev. Cell 6, 483–495 (2004).
Tang, J., Peng, R. & Ding, J. D. The regulation of stem cell differentiation by cell-cell contact on micropatterned material surfaces. Biomaterials 31, 2470–2476 (2010).
Kim, H. N., Hong, Y., Kim, M. S., Kim, S. M. & Suh, K. Y. Effect of orientation and density of nanotopography in dermal wound healing. Biomaterials 33, 8782–8792 (2012).
Kim, J. et al. Bacterial cellulose nanofibrillar patch as a wound healing platform of tympanic membrane perforation. Adv. Healthc. Mater. 2, 1525–1531 (2013).
Liliensiek, S. J., Campbell, S., Nealey, P. F. & Murphy, C. J. The scale of substratum topographic features modulates proliferation of corneal epithelial cells and corneal fibroblasts. J. Biomed. Mater. Res. A 79A, 185–192 (2006).
Kirmizidis, G. & Birch, M. A. Microfabricated grooved substrates influence cell-cell communication and osteoblast differentiation in vitro. Tissue Eng. Part A 15, 1427–1436 (2009).
Kim, D. H., Lee, H., Lee, Y. K., Nam, J. M. & Levchenko, A. Biomimetic nanopatterns as enabling tools for analysis and control of live cells. Adv. Mater. 22, 4551–4566 (2010).
Grellier, M., Bordenave, L. & Amedee, J. Cell-to-cell communication between osteogenic and endothelial lineages: implications for tissue engineering. Trends Biotechnol. 27, 562–571 (2009).
Biggs, M. J. P., Richards, R. G. & Dalby, M. J. Nanotopographical modification: a regulator of cellular function through focal adhesions. Nanomed.-Nanotechnol. 6, 619–633 (2010).
Owen, G. R., Meredith, D. O., ap Gwynn, I. & Richards, R. G. Focal adhesion quantification - a new assay of material biocompatibility? Review. Eur. Cell Mater. 9, 85–96 (2005).
Peng, R., Yao, X. & Ding, J. D. Effect of cell anisotropy on differentiation of stem cells on micropatterned surfaces through the controlled single cell adhesion. Biomaterials 32, 8048–8057 (2011).
Yao, X., Peng, R. & Ding, J. Effects of aspect ratios of stem cells on lineage commitments with and without induction media. Biomaterials 34, 930–939 (2013).
Kilian, K. A., Bugarija, B., Lahn, B. T. & Mrksich, M. Geometric cues for directing the differentiation of mesenchymal stem cells. Proc. Natl. Acad. Sci. USA 107, 4872–4877 (2010).
Acknowledgements
We all deeply appreciate the late Professor Kahp-Yang Suh for his valuable contribution on this study. This study was supported by the grant from the Korea Healthcare Technology R&D Project, Ministry for Health, Welfare and Family Affairs (A120485) and the National Research Foundation of Korea (NRF) grant funded by the Korea government (MEST) (2011-0028922).
Author information
Authors and Affiliations
Contributions
J.K., H.K., Y.C., K.S. and J.C. conceived and designed the experiments. J.K., H.K., K.L., Y.K., H.S., S.P. and H.L. carried out experiments. J.K. and H.K. analyzed the results. J.K., H.K., D.K., P.C., Y.C., K.S. and J.C. discussed the results in detail. J.K., H.K., Y.C., K.S. and J.C. wrote the manuscript.
Ethics declarations
Competing interests
The authors declare no competing financial interests.
Electronic supplementary material
Supplementary Information
SUPPLEMENTARY INFO
Rights and permissions
This work is licensed under a Creative Commons Attribution-NonCommercial-NoDerivs 3.0 Unported License. To view a copy of this license, visit http://creativecommons.org/licenses/by-nc-nd/3.0/
About this article
Cite this article
Kim, J., Kim, H., Lim, KT. et al. Designing nanotopographical density of extracellular matrix for controlled morphology and function of human mesenchymal stem cells. Sci Rep 3, 3552 (2013). https://doi.org/10.1038/srep03552
Received:
Accepted:
Published:
DOI: https://doi.org/10.1038/srep03552
Comments
By submitting a comment you agree to abide by our Terms and Community Guidelines. If you find something abusive or that does not comply with our terms or guidelines please flag it as inappropriate.
