
Abstract
Disclosing the main features of the structure of a network is crucial to understand a number of static and dynamic properties, such as robustness to failures, spreading dynamics, or collective behaviours. Among the possible characterizations, the core-periphery paradigm models the network as the union of a dense core with a sparsely connected periphery, highlighting the role of each node on the basis of its topological position. Here we show that the core-periphery structure can effectively be profiled by elaborating the behaviour of a random walker. A curve—the core-periphery profile—and a numerical indicator are derived, providing a global topological portrait. Simultaneously, a coreness value is attributed to each node, qualifying its position and role. The application to social, technological, economical and biological networks reveals the power of this technique in disclosing the overall network structure and the peculiar role of some specific nodes.
Introduction
The portrait of a network divided into a dense core and a sparse periphery originated a few decades ago from scholars in economics and social sciences1,2,3, where such a dichotomy is of utmost importance to explain unequal economic growth and development among countries. But the same paradigm is undoubtedly crucial in other fields too, e.g., in communication networks4,5,6 or biology7,8,9, namely wherever one is aimed at revealing whether there exists a central core through which most of the network flow passes. This issue has clearly important connections with the many notions of node centrality10 although, when dealing with core-periphery, attention is mostly paid on the overall network structure rather than on the features of the individual nodes.
Following the seminal work by Borgatti and Everett11, network scientists have formalized several methods to check whether a given network is actually featuring a core-periphery structure, or some form of generalized representation (e.g., core-semiperiphery-periphery) and to properly assign each node to the relevant subnetwork8,12,13. Block-modeling approaches postulate a discrete network partition in two (i.e., core-periphery) or more blocks, with consequent constraints on the links allowed (i.e., periphery nodes cannot communicate each other). The fitness of such a model to network data is then assessed11,13. Other methods are aimed at defining a global, numerical indicator of core-periphery separation, based on the remark that core nodes should have large closeness centrality, i.e., small average distance from the rest of the network8,12.
We propose a technique which avoids an explicit (and often artificial) partition in subnetworks, like block-modeling requires and does not rely on any notion of distance, which is not univocally defined and is therefore ambiguous, in the important case of weighted networks. We associate a core-periphery profile to the network, namely a discrete, non-decreasing function α1, α2, …, αn (n is the number of nodes) that: provides a graphical portrait of the network structure; induces a numerical indicator quantifying to what extent an actual centralization exists; assigns a coreness value to each node. Thanks to the latter property, we introduce the generalized notion of α-periphery by grouping all nodes with coreness below a prescribed threshold α. The core-periphery profile is derived by a standard random walk (Markov chain) model and can be obtained in a very general modeling framework (directed and weighted networks).
In the paper, we first introduce the iterative algorithm that yields the core-periphery profile (leaving all technical details to the Methods section and to the Supplementary Information file). This paves the way to introducing an overall network centralization index and a notion of node coreness. By means of several examples, mostly based on real-world networks data, we show how the set of tools we have introduced allows one in classifying the overall core-periphery network structure. Moreover, it can reveal the peculiar role of some specific nodes, providing information which is complementary to, but independent from, other measures of node-centrality.
Results
Let wij be the weight of the edge i → j in a (possibly) directed, strongly connected10,14 network with nodes N = {1, 2, …, n}. At each (discrete) time step, a random walker which is in node i jumps to j with probability  . Let πi > 0 be the asymptotic probability of visiting node i, i.e., the fraction of time steps spent on i. Given a subnetwork S (defined by the node subset
  with all the edges of the original network linking pairs of nodes in S), the persistence probability αS denotes the probability that a random walker which is currently in any of the nodes of S remains in S at the next time step. It is thus a measure of cohesiveness and, indeed, it proved to be an effective tool for finding and testing the community structure of networks15. The value of αS can be made explicit (see Methods) as

If the network is undirected, π has the closed form solution  , where
  is the strength of node i (see Methods), so that the above expression simplifies to
 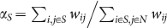 , i.e., the fraction of the weight emanating from the nodes of S remaining within S. Note that αS = 0 when S contains a single node (provided self-loops are ruled out), whereas αS = 1 when S is the entire network.
Core-periphery profile
In a network with ideal core-periphery structure11, peripheral nodes (p-nodes) are allowed to link to core nodes only, namely no connectivity exists among p-nodes. This implies that αS = 0 for any subnetwork S composed of p-nodes only, since a random walker is constrained to immediately escape from the set of p-nodes. This suggests a strategy to identify the periphery: find the largest subnetwork with zero persistence probability. In most real-world networks, however, the structure is not ideal although the core-periphery structure is evident: a weak (but not null) connectivity exists among the peripheral nodes. This calls for the generalized definition of α-periphery, which denotes the largest subnetwork S with αS ≤ α: a random walker which is in any of the nodes of the α-periphery, will escape, at the next step, with probability 1 – α.
For a general network, finding the α-periphery falls in a class of problems known to be computationally untractable16. We propose a heuristic algorithm to find, for any given α, an approximation of the α-periphery. We start by the node i with weakest connectivity (see Methods) and generate a sequence of sets  by adding, at each step, the node attaining the minimal increase in the persistence probability. Correspondingly, we obtain the core-periphery profile, that is the sequence 0 = α1 ≤ α2 ≤ … ≤ αn = 1 of the persistence probabilities of the sets Pk. It is a non-decreasing sequence, as formally stated in the Methods section and proved in the Supplementary Information. We then take the largest Pk such that αk ≤ α as our approximation of the α-periphery.
Although heuristic, the above “greedy” algorithm has a convincing rationale (and it provides a good approximation in small networks where the exact α-periphery can be computed – see Supplementary Information). We start from the least connected node because typically peripheral nodes have less connections than core nodes. Then we grow our periphery set by adding one node at a time, trying to keep it as disconnected (or weakly connected) as possible, as a periphery should be. We use the persistence probability to quantify this. While growing the periphery set, we will typically leave the inclusion of the most connected nodes to the last steps, since they would otherwise sharply enhance connectivity. Indeed, highly connected nodes are typically found at the core of the network.
Figure 1a displays the core-periphery profile of four types of artificial networks (see Supplementary Information for details), highlighting the inherent diversity in their structure. The limiting cases are: the pure star network (one center node, n – 1 peripheral nodes connected to the center only) for which α1 = … = αn–1 = 0, αn = 1; and the complete (unweighed, undirected, all-to-all) network, with no core-periphery structure by definition, for which αk grows linearly as αk = (k – 1)/(n – 1) (see Methods). The Erdős-Rényi and Barabási-Albert networks10,14 stand in the middle, with the former more similar to a complete network and the latter displaying a rather stronger core-periphery characterization17.

Core-periphery profile and centralization of four types of artificial networks.
(a). The core-periphery profile of the star network (the n – 1 peripheral nodes are connected to the center node only), of the complete (all-to-all) network and of a few realizations of Erdős-Rényi (ER) and Barabási-Albert (BA) networks (10 realizations each, n = 100, average degree 〈k〉 = 4). (b). The histograms of the distribution of the cp-centralization C over 103 realizations of ER and BA networks (n = 100, 〈k〉 = 4). The values of C for the complete and star networks are higlighted for comparison.
Centralization and coreness
The above algorithm provides, as byproducts, two other important tools of analysis. The first one is a measure of core-periphery centralization (cp-centralization) C that naturally descends from the profile of Fig. 1a. Here we consider a network to be the more centralized, the more its core-periphery profile αk is similar to that of the star network. We can therefore quantify such a similarity by measuring the area between the αk-curve of a given network and that of the star network and normalizing (see Methods) to assign C = 1 to the star network itself (maximal centralization) and C = 0 to the complete network (no centralization). If we randomly generate 103 instances of Erdős-Rényi and Barabási-Albert networks, we obtain the distributions of C reported in Fig. 1b, whose mean values are C = 0.490 and C = 0.668, respectively.
If a network displays a definite core-periphery structure (large C), then the sequence αk naturally provides a measure of coreness of each node. Indeed, nodes are iteratively selected to build the sets Pk starting from the more peripheral and terminating with the most central ones. Thus, αk can be naturally regarded as a measure of coreness of the node inserted at step k. We have αk = 0 for all p-nodes (the periphery in the strict sense), whereas the coreness of the last inserted node is maximal and equal to αn = 1. Note, however, that such an αk-ranking is not relevant when the cp-centralization C is small, since in that case nodes are selected in a more or less random order (as for the complete network).
Figure 2a displays the core-periphery profile of a number of networks (see Supplementary Information for details). The social network describing the interactions within a troop of monkeys11 seems not to display any significant core-periphery structure. Indeed, it is not very different from a complete network, as testified by the αk-curve (C = 0.261) and by the graph itself (panel b). The situation is different with Zachary's karate club network18, having C = 0.709 and featuring 20 p-nodes over 34, i.e., a large periphery even if intended in the strict sense (panel c). The remaining profiles refer to networks that reveal a larger and larger level of core-periphery characterization. They are: the netscience network19, which describes the coauthorships (up to 2006) of scholars working on network science (C = 0.645); the protein-protein interaction network of Saccharomyces cerevisiae7 (C = 0.768); the international network of airports20,21 (C = 0.824); the Internet at the level of autonomous systems10,22 (C = 0.942); and the neural network of the worm Caenorhabditis elegans23 (C = 0.940). They all reveal a very broad periphery, as the number of p-nodes ranges from about 45% to 85% of n.

Core-periphery analysis of real-world networks.
(a). The core-periphery profiles of the networks describing: the social interactions within a troop of monkeys, n = 20 (graph in panel (b)); the friendship among the members of a karate club, n = 34 (graph in panel (c)); the coauthorships among scientists working on networks (netscience), n = 379; the protein-protein interaction (ppi) network of Saccharomyces cerevisiae, n = 1458; the international airports network, n = 2868; the Internet in 2006, at the level of autonomous systems, n = 11745; and the neural network of the worm Caenorhabditis elegans, n = 239. In graphs (b) and (c), nodes are coloured according to their coreness: p-nodes (αk = 0) are in black.
The statistical significance of the above results can be assessed by comparing the values obtained for the cp-centralization C with those resulting from a procedure of network randomization. For each network under scrutiny (Fig. 2a), we generate 100 randomizations which preserve the in- and out-strength of each node i (the in- and out-degree, if the network is unweighed - see Methods). For that, we use a standard switching method24 or, when needed, its extension to weighted networks25. For each randomization, we compute the cp-centralization Crand. Then we compare the C value of the original network with the statistics of the Crand values, obtaining the z-score
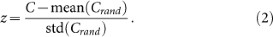
A large value of z indicates that the network under scrutiny has a significant, non-random core-periphery structure. As a matter of fact, given that a very mild (if not even null) connectivity exists among peripheral nodes in a network with strong core-periphery characterization, such a feature should be partially destroyed by randomization, resulting in a strong decrease of the corresponding Crand. Table 1 reveals that, in most cases, those networks which have larger C tend also to have larger mean(Crand) and larger z. The large mean(Crand) reveals that the entire ensemble of randomized networks, where edge shuffling can only be partial since individual node strength must be preserved, has a rather large centralization for structural reasons. But the large z reveals that the specific real-world network, which has been shaped by social, biological or technological forces, is much more peculiar than its random counterparts, as it displays a significantly much larger cp-centralization C.
Weighted networks
Weights associated to edges may have a crucial role in determining the core-periphery structure, adding much information to the pure topological (i.e., binary) structure. The world trade network (wtn), which models the flows of commodities among countries26,27, is a case in point. In 2008 its largest connected component includes virtually all world countries (n = 181) and has a very large density (65% of the possible pairwise connections are active). As a consequence, its core-periphery profile does not substantially differ from that of a complete network (C = 0.349) if weights are ignored, since most countries trade with most of their potential partners (see Fig. 3a). However, countries (and their pairwise connections) are extremely diversified if weights are accounted for: import flows (in US dollars) range from 160 × 106 for Tonga to 2 × 10¹² for the United States. Consequently, the weighted network displays a strong core-periphery characterization (C = 0.819), with a very small core composed of those few countries most of the world trade flow passes through. Indeed, the world map of Fig. 3b highlights that only very few countries have large coreness values (only United States, Germany, China, France, United Kingdom, Japan, Italy and the Netherlands, in order, have αk > 0.5).

Core-periphery analysis of the world trade network.
(a). The core-periphery profiles of the binary (i.e., unweighed) and weighted network, n = 181: the weighted network displays a much stronger core-periphery characterization. (b). A world map where countries are coloured according to their coreness in the (weighted) world trade network: countries with αk < 0.01 are in black.
Core-periphery profile and k-shell decomposition
It is instructive to compare the technique of core-periphery profiling, above introduced, with k-shell (or k-core) decomposition6,28,29, a widely used method aimed at partitioning a network in layers, from the external to the more central ones. We first compare the two approaches on the toy-network of Fig. 4 (a slight modification of a previously discussed example30): we will see that the same peculiarities emerging from this example will be found in real-world networks too.

Comparing k-shell decomposition and core-periphery analysis.
(a). k-shell decomposition: black, green and red nodes compose, respectively, the 1-, 2 and 3-shell. Node B is in the 1-shell (black) if weights are ignored, in the 2-shell (green) otherwise (see text). (b). Core-periphery profile: nodes are coloured according to their coreness (setting wAB = 1 or 3 yields negligible variations): p-nodes (αk = 0) are in black.
Assume the network is undirected and binary: in the k-shell decomposition, we begin by putting in the 1-shell the degree-1 nodes, as well as, recursively, those having degree 1 after removal of the former. Similarly, we put in the 2-shell the nodes with degree 2 after removal of the 1-shell, as well as, recursively, those having degree ≤ 2 after removal of the former and so on. In the network of Fig. 4, three shells are found moving from the less connected nodes to those with largest connectivity (see panel a). The method can be extended to weighted networks30 by replacing the degree di with a weighted degree  which reinforces nodes with large strength σi. In Fig. 4a, for example, if the link AB is given a weight wAB = 3 while keeping all the others to 1, then node B moves from the 1- to the 2-shell, highlighting the stronger tie with the most central group of nodes30.
The classification obtained by core-periphery analysis is qualitatively similar for most nodes, but a few important differences exist (Fig. 4b). First, node B is qualified as a p-node (αk = 0) regardless of wAB. Second, despite its rather large degree, node C is classified as a p-node too. These two apparent “anomalies” are, however, fully consistent with the block-modeling paradigm put forward by Borgatti and Everett11, according to whom the standard pattern of connection is that “core nodes are adjacent to other core nodes, core nodes are adjacent to some periphery nodes and periphery nodes do not connect with other periphery nodes” (p. 377-378). Thus B is peripheral because its only connection, regardless of the weight, is with a core node: as such, it is excluded from any relevant transmission of information. Perhaps surprisingly, C is peripheral too: but it is connected to core nodes only and thus, despite its rather large connectivity, it essentially fails in bridging core and periphery.
We find similar features if we move to real-world networks. The graph of Fig. 5a illustrates the k-shell decomposition of the karate network (see Supplementary Information) and it should be directly compared with the graph of Fig. 2c to assess the role of each node. The two methods give consistent classifications “on average”, as testified by the trend highlighted in Fig. 5b, but many nodes are ranked rather differently from the two methods, for the reasons above discussed. The same type of results emerge if we analyze a medium-scale network (n = 1458) such as the ppi (see Fig. 2 and Supplementary Information), as put in evidence in Fig. 5c. Again, besides the overall consistency between the results of the two methods, we find nodes with large k-coreness ki (i.e., the shell to which the node belongs) but small αi, as node C in Fig. 4. But here we find the opposite too, namely nodes belonging to the external k-shells but having large αi: they are similar to node D in Fig. 4, which plays the important role of organizing center of a rather peripherical subnetwork. In summary, k-shell decomposition and core-periphery profiling appears to be capable of providing independent information in classifying the role and rank of nodes.

Comparing k-shell decomposition and core-periphery analysis in real-world networks.
(a). k-shell decomposition of the karate network: black, blue, green and red nodes compose, respectively, the 1-to 4-shells. (b, c). For the karate and ppi networks, the k-coreness ki (i.e., the shell to which the node belongs) and the coreness αi are compared for each node. Notice that many points coincide: e.g., 20 (over 34) and 996 (over 1458) nodes have αi = 0 for, respectively, the zachary and ppi network. The blue line is the best linear interpolation.
Revealing anomalous nodes
Using now the wtn as an example, we present further results in order to stress the capability of the core-periphery profile to highlight peculiarities in the role of some specific nodes. For each node i, we consider its ranking according to two different indicators, namely the strength σi, which represents in this example the country's total trade volume and the coreness αi above defined. Figure 6 compares the two rankings (panel a): anomalous nodes are those far from the bisectrix and, among them, economically relevant are obviously those with top σ-rankings (lower-left corner, magnified in panel b).

Comparing σ- and α-ranking in the world trade network.
(a). Each node (i.e., country) is represented by a dot whose coordinates are its position in the σ-ranking (i.e., total trade volume) and α-ranking (i.e., coreness). Note that top-ranking nodes are in the lower-left corner (lowest rank values). (b). Zooming into the top 20 countries of the σ-ranking. (c). Rich-club profile of the world trade network: each node (i.e., country) is represented by a dot whose coordinates are its strength σ (i.e., total trade volume) and the corresponding value Φ(σ) of the rich-club coefficient.
The most striking anomaly is Mexico, which is 14th in the σ-ranking but only 121st in α-ranking. As a matter of fact, Mexico devotes 62% of its trade to United States (the second partner being China with 6% only). Despite its large trade amount, Mexico is thus a peripheral country since, simplifying the picture, it is connected to one single core node, similarly to node B in the network of Fig. 4b. Canada and Switzerland, also highlighted in Fig. 6b, are examples of a less definite anomalous role. They are 9th and 20th in the σ-ranking, respectively, but fall to 34th and 46th positions in the α-ranking. For Canada the situation is the same as Mexico, with a strong bias towards the United States. The strongest relationships of Switzerland, instead, are shared among four core countries, i.e., Germany, Italy, France and U.S.: thus the role of Switzerland is comparable to that of node C in the network of Fig. 4b.
It is instructive to compare the above results with those given by another sort of network profiling, i.e, rich-club analysis25,31, which is aimed at disclosing the tendency of nodes with large strength to form tightly interconnected subnetworks. For weighted, directed networks, we straightforwardly adapt the definition of Zlatic et al.25 in defining, for a given strength σ, the rich-club coefficient as the density of the subnetwork induced by the nodes with σi > σ:
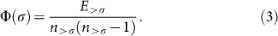
In the above equation, n>σ is the number of nodes with σi > σ and E>σ is the number of edges connecting them. The function Φ(σ), that we denote as rich-club profile, is defined over the interval σmin = miniσi ≤ σ ≤ maxiσi ≤ σmax; it is discontinuous at each σ = σi and we let conventionally Φ(σ) = 1 for n>σ ≤ 1. Figure 6c displays the rich-club profile for the wtn case. The final plateau (with Φ(σ) very close to 1) includes about 30 nodes, which correspond to a rich-club of countries forming an almost complete (all-to-all) trading network. Canada, Mexico and Switzerland are among them: this means that this type of network profiling hides their (semi-)peripheral topological role, not distinguishing them from the other members of the rich-club, mostly with a definite core position. We close by displaying two more (σ, α)-ranking plots, related to the netscience and airports networks (see Fig. 2 and Supplementary Information). The plots, which are in Fig. 7, confirm that the existence of anomalous nodes (large strength, small coreness) is not a feature of the wtn only, but is likely to be ubiquitous in medium/large scale, real-world networks. We report that we revealed the same anomalies when comparing the α-ranking to centrality measures other than the strength σi, namely closeness and betweenness centrality (with the standard mapping wij → 1/wij for weighted networks) and PageRank (which is equivalent to σi for undirected networks and strongly correlated for directed ones32).

Comparing σ- and α-ranking in the netscience and airports networks.
Each node is represented by a dot whose coordinates are its position in the σ-ranking (strength) and α-ranking (coreness). Note that top-ranking nodes are in the lower-left corner (lowest rank values). The two plots, which are restricted to the top countries of the σ-ranking, highlight the existence of anomalous nodes (large strength, small coreness).
Discussion
The case-studies above discussed have shown that the core-periphery network structure can effectively be assessed by elaborating the information provided by a random walk (Markov chain) model. This provides both a global network portrait and an individual characterization (coreness) of each node.
The results highlight the complementarity between the core-periphery and other types of network profiling, such as k-shell decomposition or rich-club analysis. As a matter of fact, the peculiar role of some specific nodes can be revealed, providing information which shows to be independent from other measures of node-centrality. Moreover, the introduced coreness indicator is unambiguously defined in the general framework of directed, weighted networks, whereas other centrality measures which are often related to core-periphery analysis are not (for example, average distance or betweenness depend on the weight-to-distance mapping which is used). For these reasons, the core-periphery profile deserves to enter the toolbox of the network analyst, to back up other profiling tools (e.g., k-shell decomposition, rich-club analysis) devoted to assess both the global network structure and the role of each single node.
Methods
Persistence probabilities
We consider (possibly) directed, strongly connected10,14, n-node networks with weight matrix W = [wij], i.e., wij > 0 denotes the weight of the edge i → j, which is set to 1 when the network is binary (i.e., unweighed), while wij = 0 if the edge i → j does not exist. We assume there are no self-loops, namely wii = 0 for all i = 1, 2, …, n. For a directed network, we denote by  and
and  , respectively, the in- and out-strength of node i and by
  the (total) strength. In the case of undirected network, we simply define the strength as
  . Notice that in-, out- and total strength reduce to the in-, out- and total node degree (
 ,
, and di) if the network is binary.
The standard description of the discrete-time evolution of a random walker on the network assumes that, at each time step,  is the probability that a random walker which is in node i jumps to j, so that the probability πi,t of finding the walker in node i at time t is governed by the n-state Markov chain πt+1 = πtM, with πt = (π1,t π2,t … πn,t). Since connectedness implies that M is an irreducible matrix, the stationary probability distribution π = πM is unique and strictly positive33. For an undirected network it has the closed form
  . For directed networks, the stationary probability distribution π is computed, in principle, by routinely solving the n × n linear system π = πM or by iterating πt+1 = πtM until convergence33. Both methods become challenging for very large networks, although the sparsity of M can be exploited. Note that the problem is essentially equivalent to the computation of the PageRank centrality34, for which a large body of research is currently active, with new approaches including, e.g., decentralized and/or randomized techniques35,36. This is out of the scope of the present work, however: for our purpose, we assume that the vector π has been computed with a suitable method. In our case studies (see Supplementary Information) we used the standard Matlab routines for linear systems solution.
Let us now partition the node set N = {1, 2, …, n} into q subsets S1, S2, …, Sq. This correspondingly defines q subnetworks, each one formed by including all the edges of the original network linking pairs of nodes of the subset. If we assume that the Markov chain πt+1 = πtM is in the stationary state π, then the dynamics of the random walker at the subnetwork scale can be described by the q-node lumped Markov chain37,38,39 Πt+1 = ΠtU, where the entries of the q × q matrix U are given by

The entry ucd is the probability that the random walker is at time (t + 1) in any of the nodes of Sd, provided it is at time t in any of the nodes of Sc. The diagonal term αc = ucc is the persistence probability15 of the subnetwork Sc: it can be regarded as an indicator of the cohesiveness of Sc, as the expected escape time from Sc is τc = (1 – αc)−1. From (4) we obtain 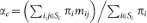 , which is equivalent40 to the ratio between the number of transitions of the random walker on the edges internal to Sc and the number of visits to the nodes of Sc. In the case of undirected networks, recalling that
  , αc simplifies to
  , which is the fraction of the strength of the nodes of Sc that remains within Sc.
Core-periphery profile
We define the core-periphery profile αk, k = 1, 2, …, n, of the network by the following algorithm:
Step 1: Select at random a node i among those with minimal strength (σi ≤ σj for all  ). Modulo a relabeling of the nodes, we can assume, without loss of generality, that the selected node is 1. Set P1 = {1}, hence α1 = 0.
Step k = 2, 3, …, n: Select the node attaining the minimum in:
If it is not unique, select at random one of the nodes with minimal strength σh among those attaining the minimum. Without loss of generality, we can assume that the selected node is k. Set  .
.
We note that the algorithm may have some randomicity (in the selection of the initial node and when, at step k, many nodes with the same strength attain the same αk), but we verified this has negligible impact in the analysis of real-world cases (see Supplementary Information for details). The main property of the core-periphery profile, namely monotonicity, is stated in the following proposition, whose proof is in the Supplementary Information.
Proposition
αk+1 ≥ αk for all k = 1, 2, …, n – 1.
The core-periphery profile of the (unweighed, undirected, all-to-all) complete network, which has wij = 1 for all i ≠ j, can readily be derived by using the above equation for αc and noting that, at step k, the set Pk is a k-node clique and thus contains k(k – 1)/2 edges. Therefore
Centralization
We derive the explicit expression of the core-periphery centralization C. The (discretized) area between a generic core-periphery profile αk and that of the star network (αk = 0 for k = 1, 2, …, n – 1, αn = 1) is given by  . For the complete network (see (6)) such expression becomes

Then we define the centralization C for a core-periphery profile αk as the complement to 1 of the normalized area, namely
References
Snyder, D. & Kick, E. L. Structural position in the world system and economic growth, 1955-1970: A multiple-network analysis of transnational interactions. Am. J. Sociol. 84, 1096–1126 (1979).
Chasedunn, C. & Grimes, P. World systems-analysis. Annu. Rev. Sociol. 21, 387–417 (1995).
Krugman, P. & Venables, A. Globalization and the inequality of nations. Q. J. Econ. 110, 857–880 (1995).
Zhou, S. & Mondragon, R. The rich-club phenomenon in the Internet topology. IEEE Commun. Lett. 8, 180–182 (2004).
Gastner, M. & Newman, M. Shape and efficiency in spatial distribution networks. J. Stat. Mech.-Theory Exp. P01015 (2006).
Carmi, S., Havlin, S., Kirkpatrick, S., Shavitt, Y. & Shir, E. A model of Internet topology using k-shell decomposition. Proc. Natl. Acad. Sci. U.S.A. 104, 11150–11154 (2007).
Jeong, H., Mason, S., Barabasi, A. & Oltvai, Z. Lethality and centrality in protein networks. Nature 411, 41–42 (2001).
Da Silva, M. R., Ma, H. & Zeng, A.-P. Centrality, network capacity and modularity as parameters to analyze the core-periphery structure in metabolic networks. Proc. IEEE 96, 1411–1420 (2008).
Bassett, D. S. et al. Core-periphery organisation of human brain dynamics (published October 12, 2012; accessed December 16, 2012). URL http://arxiv.org/abs/1210.3555.
Newman, M. E. J. Networks: An Introduction (Oxford University Press, 2010).
Borgatti, S. & Everett, M. Models of core/periphery structures. Soc. Networks 21, 375–395 (1999).
Holme, P. Core-periphery organization of complex networks. Phys. Rev. E 72, (2005).
Boyd, J., Fitzgerald, W. & Beck, R. Computing core/periphery structures and permutation tests for social relations data. Soc. Networks 28, 165–178 (2006).
Barrat, A., Barthlemy, M. & Vespignani, A. Dynamical Processes on Complex Networks (Cambridge University Press, 2008).
Piccardi, C. Finding and testing network communities by lumped Markov chains. PLoS One 6, e27028 (2011).
Sima, J. & Schaeffer, S. On the NP-completeness of some graph cluster measures. In Wiedermann, J., Tel, G., Pokorny, J., Bielikova, M. and Stuller, J. (ed.) SOFSEM 2006: Theory and Practice of Computer Science, Proceedings vol. 3831 of Lecture Notes in Computer Science, 530–537 (2006).
Chung, F. & Lu, L. The average distances in random graphs with given expected degrees. Proc. Natl. Acad. Sci. U.S.A. 99, 15879–15882 (2002).
Zachary, W. An information flow model for conflict and fission in small groups. J. Anthropol. Res. 33, 452–473 (1977).
Newman, M. E. J. Finding community structure in networks using the eigenvectors of matrices. Phys. Rev. E 74, 036104 (2006).
Opsahl, T. Why Anchorage is not (that) important: binary ties and sample selection (published August 12, 2011; accessed December 16, 2012). URL http://toreopsahl.com/2011/08/12/.
Openflights.org. Airport, airline and route data (accessed August 12, 2011). URL http://openflights.org/data.html.
Newman, M. E. J. Network data (accessed June 6, 2012). URL http://www-personal.umich.edu/~mejn/netdata/.
Watts, D. J. & Strogatz, S. H. Collective dynamics of ‘small-world’ networks. Nature 393, 440–442 (1998).
Milo, R., Kashtan, N., Itzkovitz, S., Newman, M. E. J. & Alon, U. On the uniform generation of random graphs with prescribed degree sequences (published May 30, 2004; accessed December 16, 2012). URL http://arxiv.org/abs/cond-mat/0312028.
Zlatic, V. et al. On the rich-club effect in dense and weighted networks. Eur. Phys. J. B 67, 271–275 (2009).
Serrano, M. A. & Boguñá, M. Topology of the world trade web. Phys. Rev. E 68, 015101 (2003).
Piccardi, C. & Tajoli, L. Existence and significance of communities in the world trade web. Phys. Rev. E 85, 066119 (2012).
Dorogovtsev, S., Goltsev, A. & Mendes, J. k-core organization of complex networks. Phys. Rev. Lett. 96, 040601 (2006).
Alvarez-Hamelin, J. I., Dall'Asta, L., Barrat, A. & Vespignani, A. K-core decomposition of Internet graphs: Hierarchies, selfsimilarity and measurement biases. Netw. Heterog. Media 3, 371–393 (2008).
Garas, A., Schweitzer, F. & Havlin, S. A k-shell decomposition method for weighted networks. New J. Phys. 14, 083030 (2012).
Colizza, V., Flammini, A., Serrano, M. & Vespignani, A. Detecting rich-club ordering in complex networks. Nat. Phys. 2, 110–115 (2006).
Fortunato, S., Flammini, A., Menczer, F. & Vespignani, A. Topical interests and the mitigation of search engine bias. Proc. Natl. Acad. Sci. U.S.A. 103, 12684–12689 (2006).
Meyer, C. Matrix Analysis and Applied Linear Algebra (SIAM, 2000).
Langville, A. N. & Meyer, C. D. Google's PageRank and Beyond: The Science of Search Engine Rankings (Princeton University Press, Princeton, NJ, 2006).
Parreira, J. X., Donato, D., Michel, S. & Weikum, G. Efficient and decentralized pagerank approximation in a peer-to-peer web search network. In Proceedings of the 32nd international conference on Very large data bases VLDB' 06, 415–426 (2006).
Ishii, H. & Tempo, R. Distributed Randomized Algorithms for the PageRank Computation. IEEE Trans. Autom. Control 55, 1987–2002 (2010).
Kemeny, J. G. & Snell, J. L. Finite Markov Chains (Springer-Verlag, 1976).
Buchholz, P. Exact and ordinary lumpability in finite Markov-chains. J. Appl. Probab. 31, 59–75 (1994).
Hoffmann, K. H. & Salamon, P. Bounding the lumping error in Markov chain dynamics. Appl. Math. Lett. 22, 1471–1475 (2009).
Kim, Y., Son, S.-W. & Jeong, H. Finding communities in directed networks. Phys. Rev. E 81, 016103 (2010).
Acknowledgements
Financial support was provided by MIUR-FIRB under contract RBFR08TIA4. The map in Fig. 3 was produced with the tools freely available at http://english.freemap.jp/.
Author information
Authors and Affiliations
Contributions
F.D.R., F.D. and C.P. designed and performed the research and wrote the manuscript.
Ethics declarations
Competing interests
The authors declare no competing financial interests.
Electronic supplementary material
Supplementary Information
Supplementary Information
Rights and permissions
This work is licensed under a Creative Commons Attribution-NonCommercial-NoDerivs 3.0 Unported License. To view a copy of this license, visit http://creativecommons.org/licenses/by-nc-nd/3.0/
About this article
Cite this article
Rossa, F., Dercole, F. & Piccardi, C. Profiling core-periphery network structure by random walkers. Sci Rep 3, 1467 (2013). https://doi.org/10.1038/srep01467
Received:
Accepted:
Published:
DOI: https://doi.org/10.1038/srep01467
This article is cited by
-
Metrics for network comparison using egonet feature distributions
Scientific Reports (2023)
-
Core-periphery models via integer programming: maximizing the influence of the core
Computational and Applied Mathematics (2023)
-
DC-GAN with feature attention for single image dehazing
Signal, Image and Video Processing (2023)
-
Estimating degree–degree correlation and network cores from the connectivity of high–degree nodes in complex networks
Scientific Reports (2020)
-
Examining of the actor collaboration networks around hazard mitigation: a hurricane harvey study
Natural Hazards (2020)
Comments
By submitting a comment you agree to abide by our Terms and Community Guidelines. If you find something abusive or that does not comply with our terms or guidelines please flag it as inappropriate.
