
Abstract
In the environments where stars and planets form, about one percent of the mass is in the form of micro-meter sized particles known as dust. However small and insignificant these dust grains may seem, they are responsible for the production of the simplest (H2) to the most complex (amino-acids) molecules observed in our Universe. Dust particles are recognized as powerful nano-factories that produce chemical species. However, the mechanism that converts species on dust to gas species remains elusive. Here we report experimental evidence that species forming on interstellar dust analogs can be directly released into the gas. This process, entitled chemical desorption (fig. 1), can dominate over the chemistry due to the gas phase by more than ten orders of magnitude. It also determines which species remain on the surface and are available to participate in the subsequent complex chemistry that forms the molecules necessary for the emergence of life.
Introduction
Eighty years ago, dust was first identified in the interstellar space as the ”something” which is obscuring the light coming from stars1. For several decades, dust grains were thought to be only passive and annoying entities present towards any astrophysical objects that astronomers wanted to observe. Only in the 60 s, the real nature of dust was revealed and it appeared that dust is a powerful interstellar catalyst2. The presence of several chemical species that cannot form efficiently in the gas only highlighted the need to explore the chemistry occurring on interstellar dust. At first, the use of chemistry occurring on dust to palliate the failure of gas phase chemistry was qualified as the refuge of the scoundrels3. However, while the role of dust as interstellar catalyst is now well recognized, the mechanism that allows the formed species on the surface to populate the gas phase is still unknown. This is a real paradox and issue of modern astrochemistry: to reconcile almost non-observable solid phase dust catalysis to observable products in the gas phase. Observations of deeply embedded protostars show that the disappearance of CO in the gas (because CO sticks on the dust) leads to a high abundance of CH3OH in the gas4. This anti-corelation demonstrates that CO converts into CH3OH on dust and is released into the gas phase through an efficient mechanism. It appears that many reactions occurring on dust grains are accompanied with an excess energy which is too large to dissipate. Consequently, the formed species are ejected in the gas phase upon formation. This process, called chemical desorption, implies that the chemistry occurring on interstellar dust affects the composition of the gas. Whereas the existence of this process, first suggested one decade ago5, has been shown theoretically6,7,8,9,10, it has been experimentally observed only for H2 molecules11,12,13,14 which is the most favorable expected case (very light, weakly bounded, very exothermic). In this work, we present the first experimental evidence of this process for several reactions occurring on dust analogs. We show that chemical desorption is very important (more than 90% of water formed through OH + H on the dust is released in the gas phase) and has been considerably underestimated by previous assumptions. We discuss the importance of this mechanism in comparison with the chemistry in the gas and show that it can dramatically change the chemical composition of the interstellar medium. In this sense, because the chemical composition of a medium is one of the main observational tool used to determine physical conditions, we show that current astrochemical models have to account for the catalytic role of dust due to chemical desorption in order to properly describe/predict observations. This new result also affects our current understanding of star formation. By changing the abundances of molecules present in the gas of a cloud that undergoes gravitational collapse to form a star, the gas cools more or less rapidly, which impacts the efficiency and characteristics (mass, binarity) of star formation.
Results
We study experimentally the formation of water on silicate surfaces. For this purpose, we deposit O2 molecules on silicates and deposit D atoms in a second step. The surface chosen in this study is usually used as interstellar dust analogs. After deposition at 10 K, the surface temperature is increased up to 200 K and molecules are measured in the gas with a mass spectrometer. The results of these experiments are presented in fig. 2. The solid lines represent the thermal desorption spectra of O2 (mass 32), the dashed lines the signal for D2O (mass 20), while dotted lines the signal of D2O2 (mass 36), as the temperature of the surface is increased at 0.04 K/s. The thermal desorption spectra of the 3 different species on silicate surfaces are represented in red. For comparison, we also report our experimental results for the formation of water on graphite (green) and non porous ice (blue).

Sketch that illustrates the chemical desorption process.
Species coming from the gas accrete on the dust surface and can meet each other to form other species. For some reactions shown in this study, the formed product is ejected in the gas.

Experimental evidence of chemical desorption.
Desorption peaks of O2 (solid), D2O (dashed) and D2O2 (dotted) species after the exposure of D atoms on 1 ML coverage of O2 ice deposited on different substrates (silicates SiOx in red, graphite in green and np-ASW ice in blue) held at 10 K. Inset: D2O, D2O2 and D2O monitored with the QMS during the exposure of D atoms on 1 ML coverage of O2 ice deposited on the silicate substrate at 10 K.
The black line represents the thermal desorption spectrum when only O2 is deposited on silicate surfaces. It desorbs as a single peak at around 35 K and the integrated signal corresponds to 1.0 monolayer (1 ML ~ 1015 atoms/cm2). The red lines (solid for O2, dashed for D2O and dotted for D2O2) represent the thermal desorption spectra when O2 is similarly deposited and is exposed to 4 1015 atoms/cm2 of D. In this case, the desorption of O2 around 35 K is very weak compared to the deposition of O2 only, meaning than most (≥90%) of the initial O2 molecules have disappeared. D2O and D2O2 desorption features are observed at 150 K and before 200 K, respectively. The location of these peaks in temperature allow to derive the binding energies of the different species on the substrate. These binding energies are reported in table 1. Previous studies showed that O2 reacts quickly with D, forming O2D, D2O2 and finally D2O16,17,18. The area of the desorbed peaks indicates that only 35% of the oxygen has been included in the D2O and D2O2 molecules, meaning than around 65% of the O2 molecules are missing from the surface.
The O2 molecules missing in the desorption spectra are believed to be ejected into the gas phase during exposure with D atoms, following chemical reaction. In this sense, once new species are formed and are unable to thermalize on the surface, they are released into the gas phase (the so called chemical desorption). To prove the existence of this process, we monitor the mass signal during D irradiation, with the quadrupole mass spectrometer placed in a position remote from the sample. The measurements are reported in the inset of fig. 2 before and during D irradiation for D2O (mass 20), DO2 (mass 34) and D2O2 (mass 36). We observe a direct D2O signal far above the noise level, indicating that D2O is chemically desorbed. On the other hand, we do detect a very small increase of the DO2 signal (in the noise) but no increase of the D2O2 signal. OD (mass 18) and O2 (mass 32) are also monitored, but the presence of H2O (mass 18) and O2 as minor contaminants in the vacuum decreases the signal to noise ratio, allowing only a one sigma detection of O2. The measurement before/during irradiation provides clear evidence of the chemical desorption and that the product concerns mainly D2O. The signal before and during irradiation cannot be directly compared since the QMS is not located at the same place during these experiments. For the TPDs, it is placed in front of the sample to maximize the signal. In the irradiation configuration, it is placed closed to the surface, but with an angle of about 45°.
Our experimental results show that in the case of water formation on a silicate substrate, 65% of the O2 molecules initially on the substrate are no longer present after D irradiation. By measuring the amount of species desorbing before/during the irradiation of O2 with D atoms, we show that repetitive addition of D to O2 leads to the detection of D2O in the gas phase. The possible reactions routes are the following:

The branching ratio of these two reactions are k and (1 − k). The table 2 reports the reactions involved in our experiment as well as their exothermicities. The reaction O2 + D leading to DO2 is slightly exothermic (2.3 eV) but we only see a slight increase of the mass signal (mass 34) when O2 is exposed to D atoms (this signal is in the noise). The reaction DO2 + D leading to D2O2 has an exothermicity of 3.7 eV, but D2O2 is not detected in the gas phase during irradiation. Previous studies showed that H2O2 (D2O2) can easily decompose in H2O (D2O) on the wall of chamber19, meaning that the H2O (D2O) signal obtained is due to molecules bouncing on the wall. In our experimental configuration, the number of bounced molecules that are detected are less than 10% (see Ref. 13) and can be neglected in our analysis. We know that D2O2 leaving in the gas phase cracks into D2O (for ~40%) but that ~60% stays under the form of D2O2. The cracking pattern of D2O2 is estimated during the TPD after 160 K, where we see a signal at the masses 20 (D2O) and 36 (D2O2) simultaneously. Therefore, if D2O2 is chemically desorbed into the gas phase, we should see an increased of the signal during irradiation. The reaction DO2 + D can also lead to OD + OD and has an exothermicity of 1.6 eV. However, we are not able to detect OD molecules since their mass coincide with H2O (mass 18) which is contaminating the mass spectra. We are therefore not able to derive the fraction that is chemically desorbed for this reaction. The reaction D2O2 + D → D2O + OD is exothermic with an energy of 3.1 eV and the reaction OD + D → D2O has an exothermicity of 5.2 eV. Since D2O is observed in the gas phase during exposition of O2 with D atoms, we can not differentiate which of these two routes is responsible for the important chemical desorption of D2O which is observed.
We perform complementary TPD experiments to address the origin of the very important chemical desorption of D2O. Here we use hydrogen instead of deuterium. Figure 3 represents the desorption spectra of water after its formation via 1015 atoms/cm2 of O2 followed by 7 × 10¹⁵ atoms/cm2 of H atoms on a surface held at 10 K (blue); 1015 atoms/cm2 of O3 followed by 7 × 10¹⁵ atoms/cm2 of H atoms on a surface held at 10 K (red) and 45 K (green). We can see that in the case of O3, there is a lower production of H2O, because the formation of water is made of two sub-routes O3 + H → OH + O2. Performing experiments at 45 K, where O2 is evaporating at a high rate, almost forbid the O2 + H sub-route, so the O3 + H at 45 K is almost like observing the OH + H reaction. We can see clearly that there is almost no water produced that way, indicating a very strong chemical desorption during exposure through the reaction OH + H. To check that the disappearance of the water signal for O3 + H at 45 K is not due to the fact that the reaction does not proceeds, we measure the amount of O3 present on the surface as O3 is exposed to H atoms. We see that the peak of O3, located at 67 K in the TPD, decreases as the exposure with H atoms increases. This shows that even if the residence time of H atoms on the surface is short at 45 K, it is long enough to proceed radical-radical reactions, as observed here for the reaction O3 + H and also observed for NO + H23. To summarize, we show that the OH + H route is the one responsible for the important amount of water during exposure of O2 with H or D. Since most of the water formed through this route is ejected in the gas phase, this allows us to bring further constrains on our first TPD experiment. The reaction O2 + D leads to the formation of D2O2 and then D2O + OD, or to the formation of 2 OD. Since OD on the surface reacts with a D to form D2O and is ejected in the gas, D2O and D2O2 observed in the TPD are the results of the reaction 1. This implies that the 35% of O2 found on the surface come from the reaction 1 and that the branching ratio is k = 0.35. The reactions occurring in our experiment, as well we the fraction of species chemically desorbed are reported in table 2.

Desorption spectra of water after its formation via 1 ML of O2 followed by 7 1015 H/cm2 on silicates held at 10 K (blue); 1 ML of O3 followed by 7 1015 H/cm2 atoms on a surface held at 10 K (red) and at 45 K (green).
Similar experiments have been performed on graphitic surface and on water ice substrate (Dulieu et al. in prep). For graphite, 80% of the O2 molecules initially on the substrate are no longer present after D exposure. For the water ice as a substrate, this percentage strongly depends on the morphology of the ice and can vary from almost 0% in the case of porous ice, to 40% in the case of non porous amorphous ice. These percentages are the fraction of the newly formed species that are ejected into the gas phase upon formation due to the high exothermicity of the reaction. Coupling to the substrate (phonons) is believed to be the source of the different rates observed for different substrates. Therefore, our results show (table 2) that the fraction of species released into the gas phase upon formation do not depend directly on the exothermicity of the reaction and on the binding energy of the products. The mass of the formed species also plays a fundamental role, as well as the type of substrate that is considered. Many follow-up experimental studies using different reactions/substrates are envisaged to understand the nature of the chemical desorption process.
Discussion
To estimate the impact of chemical desorption on the gas phase composition of astrophysical environments, we use a theoretical model10,24, but include the chemical desorption yields derived from the experiments presented in the previous section. In this sense, we quantify the direct impact of the chemistry on dust on the gas phase. For some reactions occurring on the surface, an important amount of the formed species are ejected in the gas phase. Therefore, within the parameter range at which these reactions dominate the chemistry on the dust surface, an important contribution in the gas phase is expected. Figure 4 illustrates the chemical desorption of H2O, OH and O2 as a function of the dust temperature. The calculations of these efficiencies are reported in the methods section. These efficiencies are the amount of O that is converted to OH, H2O and O2 on the dust and directly released into the gas phase. In this sense, the calculated efficiencies directly provide the conversion rate of gas phase atomic oxygen into another gas phase species by the use of grain surface chemistry. As OH is formed through O + H, O2 through O + O, or water through OH + H, an important fraction of the newly formed molecules is released into the gas phase. The formation efficiency is on the order of ~30% for OH (below 15 K) and ~70% for water (below ~25 K). For O2, there are two main temperature ranges where desorption into the gas phase is important. The first one, located around 17 K, has an efficiency of about 4%, while the second one, located around ~35 K, has an efficiency of 0.2%. If a strong UV field is considered in our calculations, then the species on the surface can be photo-dissociated and reform. We consider a strong radiation filed (G0 = 100, which corresponds to 100 times the ambient UV radiation field) and show that the efficiency of O2 formation is increased by a factor of 5. On the other hand, the formation of OH and H2O is unchanged.

Efficiency of chemical desorption as a function of dust temperature.
This efficiency represents the fraction of oxygen released into the gas as OH, H2O and O2. The first three reactions are computed for a UV field of G0 = 1, while the final three are for G0 = 100. Note that the amount of O2 released into the gas is significantly enhanced in the presence of a strong UV field.
It is now possible to describe analytically the formation rates of chemical species on dust with simple formulae usable for any astrochemical model. These rates kOH,dust,  and kO2,dust (in cm3 s−1) are reported in the supplementary material. The rate of the formation of species on dust (that are release in the gas) can be directly compared with gas phase rates in order to determine how molecules form in different environments with different physical conditions.
In the gas phase, the formation routes of water (OH + H2) and OH (O + H2) are associated with barriers of 1736 K, 3150 K, respectively25. While the gas phase formation rate of O2 through OH + O, is still subject to debates (no barrier until Tgas ~150 K see references in26). The rates kOH,gas,  (in cm3 s−1) are reported in the supplementary material.
If we compare the formation rates of species via gas or dust routes, we need to compare Rgas = nX · nY · kgas to Rdust = nX · nH · kdust. In our case, X is oxygen, since we are dealing with the formation of oxygenated species.
The formation of OH (and water) on dust surfaces dominates by 12 (9) orders of magnitude the gas phase route for a gas at 100 K, while this becomes of 0 (2) for a gas at 500 K. These estimations are made considering the dust temperature in the range (0–15 K) for OH and (0–25 K) for water (and with the density of gas phase O and OH as nOI = 10−4 nH, nOH = 10−7 nH).
Searches of O2 with ground based telescopes and space missions such as SWASS and ODIN indicated that O2 has a widespread low abundance. O2 remained unseen allowing to derive some upper limits (X(O2) ≤ 10−7 27,28). However, while recent Hershel observations confirmed the general trend that O2 has very low abundances (detection of O2 towards ρOph, X(O2)~10−8 29), one isolated high abundance of O2 has been reported towards ORION26. This high abundance has been attributed to the presence of warm dust, or to shocks. In this work, our model shows an alternative efficient way to form O2 in the gas phase through chemical desorption from dust. This efficiency is important only for very specific conditions (Tdust~30–40 K and high UV field), which could explain why the detection of O2 is seen only in isolated cases. This will be investigated in a forthcoming paper.
In summary, we report the first experimental evidence that species which form on the surface of interstellar dust grains can subsequently be released into the gas phase due to the exothermicity of the reaction. By depositing O2 molecules on several types of surfaces and depositing D atoms in a second step, we show that an important fraction of the newly formed species are released into the gas phase during their formation, therefore confirming the existence and importance of the chemical desorption process. We also show that chemical desorption is sensitive to the type of surface upon which the formation reaction occurs. We derive canonical expressions for the formation of water, OH and O2 in the gas phase due to chemical desorption. These expressions can be implemented in any astrophysical model to properly account for the chemistry occurring in space. We show that this process, that covers gas phase species to another though dust, dominates by many orders of magnitude gas phase chemistry in the typical astrophysical environments where water and water ice are forming.
The process highlighted in this study, chemical desorption, has an important impact on the chemistry and thermodynamics of our Universe. In regions where stars are forming, the presence of dust dramatically influences the gas phase composition, changing the abundances of molecules available to cool the gas. Therefore, a cloud that undergoes gravitational collapse to form a star will cool more or less rapidly, depending on the available coolants and this impacts the efficiency and characteristics (mass, binarity) of star formation. In this sense, the existence of chemical desorption, illustrated in this study, not only impacts the chemical composition of our Universe, but affects the way stars form.
Methods
Experimental setup
Experiments were performed using the FORMOLISM set-up13. In an ultra high vacuum chamber, a gold mirror covered with amorphous silicate (or a graphite substrate) is held at 10 K. All the experiments are performed in the sub-monolayer regime (1 monolayer means that the surface is covered at 100%), to ensure that the interactions of the species with the surface is not perturbed by layering effects. The surface coverage is determined using the specific desorption properties of the second layer15. One layer (or less) of O2 molecules is deposited at 10 K. Coincidently, or just after O2 deposition, a D beam (with a dissociation efficiency of 70%) is aimed at the solid sample covered with O2. In a second phase, the surface temperature is increased and the desorption flux is monitored using a movable quadrupole mass spectrometer, placed 3 mm away from the surface.
Microscopic model
To estimate the impact of chemical desorption on the gas phase composition of astrophysical environments, we use the chemical network presented in previous studies10,24, but include the chemical desorption yields derived from the experiments presented in this work (Table 1). We solve this chemical network using the rate equations method. We follow the evolution of the species on the surface in monolayers and calculate the amount of newly formed species that desorb into the gas phase due to chemical desorption.
The main processes that are necessary to describe the chemistry occurring on a grain surface are described in details in this section. Here we enumerate these different processes: (1) species from the gas accrete on the dust (2) species on the dust diffuse on the surface (3) species on the surface react to form a product that is released in the gas phase (illustrated in fig. 1 with probabilities listed in table 1) (4) same than 3 but the product stays on he surface (5) evaporation of the surface species into the gas phase (6) photo-dissociation of surface species by UV photon. Our rate equation model follows the evolution of surface species with time. For this, we take into account the different processes occurring to the different species and calculate their associated rates. These processes are the following:
-
1
Species from the gas phase accrete onto the dust with a rate:
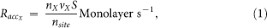
where nX and vX are, respectively, the gas phase density and velocity of the species X , nsite is the density of sites on the dust (1015 cm−2) and S is the sticking coefficient of the species on the dust. We consider that S = 1, meaning that when a species arrives on the dust, it directly sticks to the surface.
-
2
Species present on the surface evaporate from the surface with a rate:

where νX is the oscillation factor of the species (which is 1012 s−1 on physisorbed sites) and EX is the binding energy of species X, or in previous work30.
-
3
Species on the surface can diffuse on the surface with a mobility:

The first exponential represents the diffusion occurring through tunneling and the second through thermal hopping. EaX is the energy of the barrier between two physisorbed sites (which is considered here as 2/3 of the binding energies EX), a the width of the barrier (in Å) and mX the mass of the species X in amu. Note that the quantum tunneling is approximated20. Oxygen, even with its high mass, is observed to tunnel quite efficiently on the surface (Dulieu et al. submitted). We therefore adopt a barrier width of 1Å and barrier height of 500 K for the diffusion of oxygen on silicates. Oxygen can diffuse on the surface via quantum tunneling until Tdust = 25 K.
-
4
Species on the surface can be photodissociated by UV photons30 with a rate
 nX.
nX. -
5
Species on the surface can meet and react to form a product that will either stay on the surface or be released into the gas phase10.


 nX.
nX. The rate equation method couples the equations describing the different populations of the surface species. These equations are written as:

where Xi are the species on the surface. The six terms of this equation represent (1) the accretion of species Xi from the gas phase, (2) the formation of new species that involve species Xi, (3) the creation of species Xi by the encounter of species Xi and Xj that are present on the surface, (4) the evaporation of species Xi, (5) the photo-dissociation of Xi on the dust and (6) the creation of Xi by photo-dissociation of species Y.
The formation of OH, H2O and O2 are insured by several reactions routes on the dust but only the reaction O + H, OH + H and O + O see their products (OH, H2O and O2) released in the gas phase.The different gas phase efficiencies due to the chemistry on dust can be written as followed:


with fdes the chemical desorption fraction for the considered reaction as reported in table 2.
Formation rates on dust due to chemical desorption
The formation rates of species X can be written as:  , where ndust is the density of dust, σ the dust cross section and
  the efficiency of the formation of OH, H2O or O2 (eq. 5, 6 and 7) . If we consider a MRN grain size distribution (ndustσ/n(H) = 10−21 cm−2), then the rates for the formation of OH, H2O and O2 are written as:


where nHI and nOI are the densities of atomic hydrogen and oxygen in the gas phase, respectively. The rate for the formation efficiency of O2 is complex and the denominator of the expression (den) is written as:

With OH the approximate of the OH surface species on the dust:

As the temperature increases, some reactants evaporate and we enter a stochastic regime where the system should be treated with stochastic methods (Monte Carlo). Therefore, the rates we derive here overestimate the actual rates at temperatures greater than 30 K24 (when the rates decrease exponentially). Note that the value of Tdust for the validity of our estimates is higher at higher densities.
Formation rates in the gas phase
In the gas phase, the formation routes of water (OH + H2) and OH (O + H2) are associated with barriers of 1736 K, 3150 K, respectively25. These rates can be written as:


References
Trumpler, R. J. Absorption of Light in the Galactic System. PASP 42, 214 (1930).
Oort, J. H. & van de Hulst, H. C. Gas and smoke in interstellar space. Bull. Astron. Inst. Netherlands 10, 187 (1946).
Walmsley, C., Interstellar Dust, Allamandola, L. J. & Tielens, A. G. G. M. eds. (1989), vol. 135 of IAU Symposium, 263.
Kristensen, L. E. et al. Methanol maps of low-mass protostellar systems. I. The Serpens molecular core. A&A 516, A57 (2010).
Takahashi, J. & Williams, D. A. Chemically driven desorption of CO from icy grains in dark clouds. MNRAS 314, 273 (2000).
Andersson, S., Al-Halabi, A., Kroes, G.-J. & van Dishoeck, E. F. Molecular-dynamics study of photodissociation of water in crystalline and amorphous ices. Journal of Chemical Physics 124, 064715 (2006).
Morisset, S., Aguillon, F., Sizun, M. & Sidis, V. Quantum dynamics of H2 formation on a graphite surface through the Langmuir Hinshelwood mechanism. Journal of Chemical Physics 121, 6493 (2004).
Bergeron, H., Rougeau, N., Sidis, V., Sizun, M., Teillet-Billy, D. & Aguillon, F. OH Formation from O and H Atoms Physisorbed on a Graphitic Surface through the Langmuir Hinshelwood Mechanism: A Quasi Classical Approach. Journal Phys. Chem. A 112, 11921 (2008).
Garrod, R. T., Wakelam, V. & Herbst, E. Non-thermal desorption from interstellar dust grains via exothermic surface reactions. A&A 467, 1103 (2007).
Cazaux, S., Cobut, V., Marseille, M., Spaans, M. & Caselli, P. Water formation on bare grains: When the chemistry on dust impacts interstellar gas. A&A 522, A74+ (2010).
Pirronello, V., Liu, C., Shen, L. & Vidali, G. Laboratory Synthesis of Molecular Hydrogen on Surfaces of Astrophysical Interest . ApJL 475, L69+ (1997).
Pirronello, V., Liu, C., Roser, J. E. & Vidali, G. Measurements of molecular hydrogen formation on carbonaceous grains. A&A 344, 681 (1999).
Amiaud, L., Dulieu, F., Baouche, S., Fillion, J. H., Momeni, A. & Lemaire, J. L. Isotopic Segregation of Molecular Hydrogen on Water Ice Surface at Low Temperature: Importance for Interstellar Grain Chemistry. eds. (2006), vol. 855 of American Institute of Physics Conference Series, 55–61.
Congiu, E., Matar, E., Kristensen, L. E., Dulieu, F. & Lemaire, J. L. Laboratory evidence for the non-detection of excited nascent H2 in dark clouds. MNRAS 397, L96 (2009).
Noble, J. A. et al. The desorption of H2CO from interstellar grains analogues. A&A 543, A5 (2012).
Miyauchi, N., Hidaka, H., Chigai, T., Nagaoka, A., Watanabe, N. & Kouchi, A. Formation of hydrogen peroxide and water from the reaction of cold hydrogen atoms with solid oxygen at 10 K. Chemical Physics Letters 456, 27 (2008).
Ioppolo, S., Cuppen, H. M., Romanzin, C., van Dishoeck, E. F. & Linnartz, H. Laboratory Evidence for Efficient Water Formation in Interstellar Ices. ApJ 686, 1474 (2008).
Dulieu, F. et al. Experimental evidence for water formation on interstellar dust grains by hydrogen and oxygen atoms. A&A 512, A30 (2010).
Pettersson, M., Tuominen, S. & Räsänen, M. IR Spectroscopic Study of H2O2, HDO2 and D2O2 Isolated in Ar, Kr and Xe Matrices. JPC A 101 (6), 1166–1171 (1997).
Cazaux, S. & Tielens, A. G. G. M. H2 Formation on Grain Surfaces. ApJ 604, 222 (2004).
Fraser, H. J., Collings, M. P., McCoustra, M. R. S. & Williams, D. A. Thermal desorption of water ice in the interstellar medium. MNRAS 327, 1165 (2001).
Jing, D., He, J., Brucato, J., De Sio, A., Tozzetti, L. & Vidali, G. On Water Formation in the Interstellar Medium: Laboratory Study of the O + D Reaction on Surfaces. ApJL 741, L9 (2011).
Congiu, E., Chaabouni, H., Laffon, C., Parent, P., Baouche, S. & Dulieu, F. Efficient surface formation route of interstellar hydroxylamine through NO hydrogenation. I. The submonolayer regime on interstellar relevant substrates. JCP 137, 054713 (2012).
Meijerink, R., Cazaux, S. & Spaans, M. Enhanced H2O formation through dust grain chemistry in X-ray exposed environments. A&A 537, A102 (2012).
Manion, J. A. et al. NIST Chemical Kinetics Database NIST Standard Reference Database 17, Version 7.0 (Web Version), Release 1.4.3. Data version 2008.12, National Institute of Standards and Technology, Gaithersburg, Maryland, 20899 8320. Web address: http://kinetics.nist.gov/ (2008).
Goldsmith, P. F. et al. Herschel Measurements of Molecular Oxygen in Orion. ApJ 737, 96 (2011).
Goldsmith, P. F. et al. O2 in Interstellar Molecular Clouds. ApJL 539, L123 (2000).
Pagani, L. et al. Low upper limits on the O2 abundance from the Odin satellite. A&A 402, L77 (2003).
Liseau, R. et al. Multi-line detection of O2 toward ρ Ophuichi A. A&A 541, A73 (2012).
Cuppen, H. M. & Herbst, E. Simulation of the Formation and Morphology of Ice Mantles on Interstellar Grains. ApJ 668, 294 (2007).
Acknowledgements
S.C. is supported by the Netherlands Organization for Scientific Research (NWO), J.A.N. thanks The Leverhulme Trust and the Scottish International Education Trust and Royal Commission for the Exhibition of 1851 Research Fellow for fundings.
Author information
Authors and Affiliations
Contributions
S. Cazaux and F. Dulieu wrote the main manuscript. The experiements were perfomed by E. Congiu, J. A. Noble, S. Baouche, H. Chaabouni, A. Moudens, M. Minissale and F. Dulieu. S. Cazaux developed the theoretical model. All authors reviewed the manuscript.
Ethics declarations
Competing interests
The authors declare no competing financial interests.
Rights and permissions
This work is licensed under a Creative Commons Attribution-NonCommercial-NoDerivs 3.0 Unported License. To view a copy of this license, visit http://creativecommons.org/licenses/by-nc-nd/3.0/
About this article
Cite this article
Dulieu, F., Congiu, E., Noble, J. et al. How micron-sized dust particles determine the chemistry of our Universe. Sci Rep 3, 1338 (2013). https://doi.org/10.1038/srep01338
Received:
Accepted:
Published:
DOI: https://doi.org/10.1038/srep01338
This article is cited by
-
The underexposed effect of elastic electron collisions in dusty plasmas
Communications Physics (2021)
-
An infrared measurement of chemical desorption from interstellar ice analogues
Nature Astronomy (2018)
-
Grain Surface Models and Data for Astrochemistry
Space Science Reviews (2017)
-
Structural and physical properties of the dust particles in Qatar and their influence on the PV panel performance
Scientific Reports (2016)
Comments
By submitting a comment you agree to abide by our Terms and Community Guidelines. If you find something abusive or that does not comply with our terms or guidelines please flag it as inappropriate.
