
Abstract
Study design:
A cross-sectional analysis.
Objective:
To examine whether intramedullary stress is related to the appearance of symptoms in cervical spondylotic myelopathy (CSM).
Setting:
Japan.
Methods:
Thirty-three consecutive patients with CSM and 30 consecutive patients without CSM were enrolled. A total of 99 disc levels from C3 to C6 in 33 patients with CSM were divided into two groups: 33 disc levels with high signal intensity (HSI) on T2-weighted magnetic resonance image (HSI group) and 66 disc levels without HSI (Non-HSI group). Ninety disc levels from C3 to C6 in patients without CSM were set up in a control group. Intramedullary stress value at each level was analyzed using the finite element method. Stress was compared among the three groups. A cutoff value of stress to present HSI was investigated from receiver operator characteristics (ROC) curve.
Results:
In all the patients with CSM, the disc level with HSI presented the highest stress among the three disc levels evaluated. The stress was 3.16±0.86 kPa (mean±s.d.) in the HSI group, 1.81±0.72 kPa in the Non-HSI group and 1.01±0.37 kPa in the control group. The stress differed significantly among the three groups (P<0.0001). The qualified cutoff value derived from the ROC curve was 2.30 kPa (sensitivity 78.8%, specificity 91.9%). None of the disc levels in the control group exceeded 2.30 kPa.
Conclusion:
HSI was strongly associated with intramedullary stress. Threshold of intramedullary stress to present HSI that related closely to the symptoms of myelopathy was revealed.
Introduction
In patients with cervical spondylotic myelopathy (CSM), symptoms are attributed to compression of the spinal cord due to spinal canal stenosis. However, compression of the spinal cord does not always induce symptomatic myelopathy. It is observed in 7.6–26% of asymptomatic subjects.1, 2
Numerous factors that contribute to the onset of cervical myelopathy have been reported, including intramedullary ischemia due to mechanical distortion of the spinal cord,3 a pincer effect,4 developmental canal stenosis,5 watershed area of the spinal cord6 and repeated minor trauma presumed by the pathophysiological similarity to solid-type spinal cord injuries.7 However, biomechanical influence on the neural tissue damage remains inadequately understood.
Ozawa et al.8 reported that the distribution of pathological changes in a unilateral spinal cord compression model using rabbits is compatible with the stress distribution drawn from the finite element method (FEM) model. Also, there have been several reports that show the significance of intramedullary stress to the pathogenesis of CSM by biomechanical simulations of cervical spinal cord compression using FEM.9, 10, 11 However, there has been no research that clinically examines the relationship between neurological condition and intramedullary stress distribution in actual patients with CSM.
In the present study, we examined whether intramedullary stress was related to exhibiting symptoms of cervical myelopathy. The shapes of the spinal cords were extracted from magnetic resonance imaging (MRI). Intramedullary stress values at disc levels with and without high signal intensity (HSI) on T2-weighted MRI image (T2WI) were analyzed using the FEM in patients with CSM and controls. In addition, postoperative intramedullary stress values were analyzed.
Patients and methods
Patients
Thirty-three consecutive patients (21 males and 12 females) with CSM who underwent Kurokawa’s laminoplasty at one hospital were evaluated. These patients had been participants of another study designed as a prospective study.12 All patients with CSM clinically presented transverse lesion syndrome consisting of bilateral motor and sensory deficits of the upper and lower limbs with exaggerated knee and Achilles jerks. These patients underwent preoperative MRI and then postoperative MRI 2 weeks after surgery. The mean age of the patients was 62.1±11.0 (mean±s.d.) (95% confidence interval: 58.2–66.0) years.
HSI in the spinal cord on T2WI in patients with CSM is often seen at the most severely compressed intervertebral disc level. It is thought to reflect the degeneration of the neural tissue and closely linked to the appearance of symptoms.13 All patients presented HSI in any of the three disc levels of C3–4, C4–5 and C5–6 on T2WI. The disc levels with HSI were at C3–4 in six cases, at C4–5 in 13 cases and at C5–6 in 14 cases. A total of 99 disc levels from C3 to C6 in 33 patients were divided into two groups: 33 disc levels with HSI (HSI group) and 66 disc levels without HSI (Non-HSI group).
Thirty patients (18 males and 12 females) who underwent cervical MRI for reasons other than myelopathy were enrolled in this study, and 90 disc levels from C3 to C6 were set up as a control group. The mean age of the control patients was 62.1±13.0 (mean±s.d.) (95% confidence interval: 57.3–66.9) years. All patients with CSM had spinal cord compression at least in one disc level, and some of them had multi-level compression on MRI, while patients in the control group had no obvious spinal cord compression. None of the disc levels in the control group presented HSI on T2WI.
Methods
Intramedullary stress analysis using the FEM
Extracting the shape of the spinal cord. In each case, a midsagittal T2WI image taken 1 month before surgery was scaled up five times on a tablet (Cintiq 12WX, Wacom, Japan). The anterior and posterior margins of the spinal cord from the inferior margin of the vertebral body of C2 to the inferior margin of the vertebral body of C7 were marked manually with dots at intervals of approximately 1 mm. The coordinate data of these dots were measured using ImageJ software (National Institutes of Health, NIH, Bethesda, MD, USA; Figure 1). The anterior and posterior margins were approximated by spline curves made from the coordinate data. The shape of the spinal cord was determined by combining the spline curves of the anterior and posterior margins.

Extracting the shape of the spinal cord. On the midsagittal T2WI images, the anterior and posterior margins of the spinal cord from the inferior margin of the vertebral body of C2 to the inferior margin of the vertebral body of C7 were marked with dots at intervals of approximately 1 mm (a). Panel b is a magnified figure of the square in panel a.
FEM analysis. A straight line model made by connecting the cranial and caudal corners of the spinal cord approximated by the spline curves was constructed with 4000 two-dimensional eight-node elements (Figure 2a). Both the cranial (top) and caudal (bottom) edges of the model were constrained in all the directions. Then, the fixed displacement obtained from the spinal cord shape was imposed on the straight line model (Figure 2b), and the stress distribution was quantified as the von Mises equivalent stress using Ansys 11.0 software (Ansys Ver. 11, Ansys Inc., Canonsburg, PA, USA) (Figure 2c). The initial modulus of elasticity of 5 kPa and Poisson’s ratio of 0.49 of the spinal cord were applied, based on a previous study.14 The area from the middle of the vertebral body of C3 to the middle of the vertebral body of C4 was defined as the C3–4 disc level. The C4–5 and C5–6 disc levels were similarly defined. The maximum stress value at each disc level was defined as the stress at that segment.

FEM analysis. A straight line model was made by connecting the cranial and caudal corners of the spinal cord approximated by the spline curves (a). Then, the fixed displacement obtained from the spinal cord shape was imposed on the straight line model (b) and the stress distribution was quantified as the von Mises equivalent stress (c).
Statistical analysis
-
1
Stress was compared among the HSI group, the Non-HSI group and the control group using the Tukey–Kramer Honestly Significant Difference test.
-
2
A total of 189 disc levels in the three groups were analyzed from receiver operator characteristics (ROC) curve, and the cutoff value of stress to present HSI was investigated.
-
3
Preoperative and postoperative stress values of the HSI group were compared using the paired t-test.
All analyses were performed using the statistics software JMP Pro 9.0.0 (SAS Institute Inc., Cary, NC, USA). A P-value of <0.05 was considered to be statistically significant.
We certify that all applicable institutional and governmental regulations concerning the ethical use of human volunteers were followed during the course of this research.
Illustrative case
The patient was an 82-year-old male. The disc level presenting HIS was C4–5. The highest intramedullary stress was demonstrated in the C4–5 disc level (C3–4: 1.7 kPa, C4–5: 2.9 kPa and C5–6: 0.7 kPa; Figure 3a). The intramedullary stress at each disc level was clearly reduced after posterior decompression surgery (C3–4: 1.3 kPa, C4–5: 1.0 kPa and C5–6: 0.5 kPa; Figure 3b).

On the preoperative midsagittal T2WI image, the intramedullary stress distribution was analyzed (a). The C4–5 disc level presented the highest stress. Likewise, postoperative stress was analyzed from midsagittal T2WI image (b). The stress at the C4–5 disc level reduced markedly.
Results
-
1
In all the patients with CSM, the disc level with HSI presented the highest stress among the three disc levels evaluated. The stress was 3.16±0.86 kPa (mean±s.d.) in the HSI group, 1.81±0.72 kPa in the Non-HSI group and 1.01±0.37 kPa in the control group. The stress in the disc level with HSI was significantly highest among the three groups (P<0.0001; Figure 4).
Figure 4 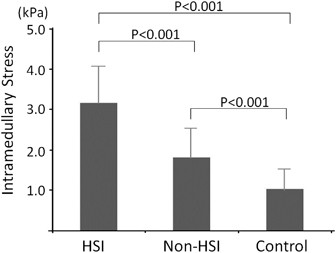
The stress was largest in the HSI group. The stress differed significantly between any two groups.
-
2
The ROC curve is shown in Figure 5. The area under the curve (AUC) was 0.95. The qualified cutoff value to cause the HSI was 2.30 kPa (sensitivity 78.8%, specificity 91.9%). There was no disc level presenting high intramedullary stress >2.3 kPa without spinal cord compression on MRI. None of the disc levels in the control group exceeded 2.30 kPa.
Figure 5 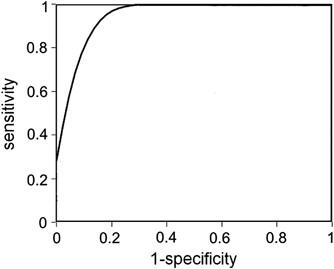
ROC curve for the intramedullary stress. The area under the curve was 0.95. The most qualified cutoff value to cause the HSI was 2.30 kPa (sensitivity 78.8%, specificity 91.9%).
-
3
The preoperative stress in the HSI group was 3.16±0.86 kPa, and the postoperative stress was down to 1.38±0.43 kPa. It reduced significantly after the surgery (P<0.0001; Figure 6).
Figure 6 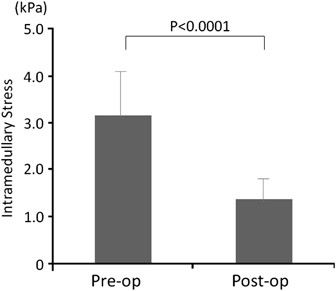
The stress reduced significantly after surgery in the HIS group (P<0.0001).


Discussion
Regarding the pathophysiology of CSM, chronic and repeated injuries to the spinal cord are caused by both static and dynamic mechanical factors. The combination of these factors affects the spinal cord through both direct trauma and ischemia.15 Mechanical factors lead to the development of spinal cord deformities, inducing morbid stress distribution. Several reports have been published regarding the intramedullary stress analysis of the axial plane of chronically compressed spinal cords using FEM.10, 16 However; these analyses were not performed in patients with CSM, and did not evaluate the relationship with clinical symptoms. The present study revealed that higher levels of intramedullary stress have a critical influence on the onset of CSM and clarified the cutoff value for stress related to exhibiting symptoms. Therefore, intramedullary stress is a highly important factor for understanding the pathophysiology of CSM.
In the present study, the stress in in the HSI group was significantly highest among the three groups. Intramedullary signal change on MRI is generally considered to reflect nerve tissue degeneration.13 In addition, several authors have described that the level of HIS on T2WI was deemed responsible for symptoms.17, 18 In the present study, HSI was strongly associated with intramedullary stress. Thus intramedullary high stress due to spinal cord compression was considered to induce nerve tissue damage, resulting in the onset of CSM.
Compression of the spinal cord is observed in 7.6–26% of asymptomatic subjects. It is not easy to evaluate whether compression of the spinal cord is symptomatic. The cutoff value to present HSI was 2.30 kPa in the present study. No disc level in the control group exceeded this cutoff value. We considered, therefore, that a threshold of intramedullary stress to present symptoms of myelopathy actually existed. That is, when the intramedullary stress reaches to some extent, neurological dysfunction should become obvious.
In the present study, we analyzed the intramedullary stress of the patients with CSM from sagittal image. A stress analysis of sagittal MRI images reflects both the spinal cord compression and sagittal alignment of the spinal cord, which cannot be expressed on axial images. The sagittal alignment of the cervical spine has a potent effect on the prognosis of CSM.19 The method of analysis of the sagittal plane implemented in the present study was considered to have an advantage for investigating the pathological conditions of the spinal cord.
There were several limitations to the present study. First, an accurate measurement of stress could not be obtained in cases of extreme paramedian compression, because the stress measured in the present study was determined from midsagittal images. Apparent spinal cord deformities, however, were observed on midsagittal images in most cases of symptomatic paramedian compression. A three-dimensional analysis should be the next target. Second, sagittal images obtained in the neutral position were used in the present study. The cross-sectional area of the spinal cord in patients with CSM was decreased under extension of the cervical spine.20 When images obtained under extension of the cervical spine are analyzed, the intramedullary stress would be estimated to increase.
Data archiving
There were no data to deposit.
References
Teresi LM, Lufkin RB, Reicher MA, Moffit BJ, Vinuela FV, Wilson GM et al. Asymptomatic degenerative disk disease and spondylosis of the cervical spine: MR imaging. Radiology 1987; 164: 83–88.
Matsumoto M, Fujimura Y, Suzuki N, Nishi Y, Nakamura M, Yabe Y et al. MRI of cervical intervertebral discs in asymptomatic subjects. J Bone Joint Surg Br 1998; 80: 19–24.
Breig A, Turnbull I, Hassler O . Effects of mechanical stresses on the spinal cord in cervical spondylosis. A study on fresh cadaver material. J Neurosurg 1966; 25: 45–56.
Penning L, van der Zwaag P . Biomechanical aspects of spondylotic myelopathy. Acta Radiol Diagn (Stockh) 1966; 5: 1090–1103.
Hinck VC, Sachdev NS . Developmental stenosis of the cervical spinal canal. Brain 1966; 89: 27–36.
Turnbull IM . Microvasculature of the human spinal cord. J Neurosurg 1971; 35: 141–147.
Bunge RP, Puckett WR, Becerra JL, Marcillo A, Quencer RM . Observations on the pathology of human spinal cord injury. A review and classification of 22 new cases with details from a case of chronic cord compression with extensive focal demyelination. Adv Neurol 1993; 59: 75–89.
Ozawa H, Wu ZJ, Tanaka Y, Kokubun S . Morphologic change and astrocyte response to unilateral spinal cord compression in rabbits. J Neurotrauma 2004; 21: 944–955.
Scifert J, Totoribe K, Goel V, Huntzinger J . Spinal cord mechanics during flexion and extension of the cervical spine: a finite element study. Pain Physician 2002; 5: 394–400.
Ichihara K, Taguchi T, Sakuramoto I, Kawano S, Kawai S . Mechanism of the spinal cord injury and the cervical spondylotic myelopathy: new approach based on the mechanical features of the spinal cord white and gray matter. J Neurosurg 2003; 99: 278–285.
Kato Y, Kanchiku T, Imajo Y, Kimura K, Ichihara K, Kawano S et al. Biomechanical study of the effect of degree of static compression of the spinal cord in ossification of the posterior longitudinal ligament. J Neurosurg Spine 2010; 12: 301–305.
Ozawa H, Sato T, Hyodo H, Ishii Y, Morozumi N, Koizumi Y et al. Clinical significance of intramedullary Gd-DTPA enhancement in cervical myelopathy. Spinal Cord 2010; 48: 415–422.
Ohshio I, Hatayama A, Kaneda K, Takahara M, Nagashima K . Correlation between histopathologic features and magnetic resonance images of spinal cord lesions. Spine 1993; 18: 1140–1149.
Ozawa H, Matsumoto T, Ohashi T, Sato M, Kokubun S . Comparison of spinal cord gray matter and white matter softness: measurement by pipette aspiration method. J Neurosurg 2001; 95: 221–224.
Mattei TA, Goulart CR, Milano JB, Dutra LP, Fasset DR . Cervical spondylotic myelopathy: pathophysiology, diagnosis, and surgical techniques. ISRN Neurol 2011; 2011: 463729.
Sparrey CJ, Manley GT, Keaveny TM . Effects of white, grey, and pia mater properties on tissue level stresses and strains in the compressed spinal cord. J Neurotrauma 2009; 26: 585–595.
Matsumoto M, Ishikawa M, Ishii K, Nishizawa T, Maruiwa H, Nakamura M et al. Usefulness of neurological examination for diagnosis of the affected level in patients with cervical compressive myelopathy: prospective comparative study with radiological evaluation. J Neurosurg Spine 2005; 2: 535–539.
Seichi A, Takeshita K, Kawaguchi H, Matsudaira K, Higashikawa A, Ogata N et al. Neurologic level diagnosis of cervical stenotic myelopathy. Spine 2006; 31: 1338–1343.
Suda K, Abumi K, Ito M, Shono Y, Kaneda K, Fujiya M . Local kyphosis reduces surgical outcomes of expansive open-door laminoplasty for cervical spondylotic myelopathy. Spine 2003; 28: 1258–1262.
Machino M, Yukawa Y, Ito K, Nakashima H, Kato F . Dynamic changes in dural sac and spinal cord cross-sectional area in patients with cervical spondylotic myelopathy: cervical spine. Spine 2011; 36: 399–403.
Author information
Authors and Affiliations
Corresponding author
Ethics declarations
Competing interests
The authors declare no conflict of interest.
Rights and permissions
About this article
Cite this article
Takahashi, K., Ozawa, H., Sakamoto, N. et al. Influence of intramedullary stress on cervical spondylotic myelopathy. Spinal Cord 51, 761–764 (2013). https://doi.org/10.1038/sc.2013.94
Received:
Revised:
Accepted:
Published:
Issue Date:
DOI: https://doi.org/10.1038/sc.2013.94
Keywords
This article is cited by
-
Spinal Cord Stress After Anterior Cervical Diskectomy and Fusion: Results from a Patient-Specific Finite Element Model
Annals of Biomedical Engineering (2023)
-
Anterior cervical discectomy and fusion may be more effective than anterior cervical corpectomy and fusion for the treatment of cervical spondylotic myelopathy
BMC Musculoskeletal Disorders (2015)
