
Abstract
In recent decades, the warming in the Arctic has been much faster than in the rest of the world, a phenomenon known as Arctic amplification. Numerous studies report that the Arctic is warming either twice, more than twice, or even three times as fast as the globe on average. Here we show, by using several observational datasets which cover the Arctic region, that during the last 43 years the Arctic has been warming nearly four times faster than the globe, which is a higher ratio than generally reported in literature. We compared the observed Arctic amplification ratio with the ratio simulated by state-of-the-art climate models, and found that the observed four-fold warming ratio over 1979–2021 is an extremely rare occasion in the climate model simulations. The observed and simulated amplification ratios are more consistent with each other if calculated over a longer period; however the comparison is obscured by observational uncertainties before 1979. Our results indicate that the recent four-fold Arctic warming ratio is either an extremely unlikely event, or the climate models systematically tend to underestimate the amplification.
Introduction
The faster warming rate in the Arctic compared to the globe as a whole is nowadays considered a robust fact. The phenomenon, called Arctic or polar amplification (AA), can be seen in both instrumental observations1,2,3 and climate models4 as well as in paleoclimate proxy records5.
During the last decade, multiple factors have been proposed to explain the potential causes of AA: enhanced oceanic heating and ice-albedo feedback due diminishing sea ice6,7,8,9, Planck feedback10, lapse-rate feedback11, near-surface air temperature inversion12, cloud feedback13, ocean heat transport14 and meridional atmospheric moisture transport15,16,17. Furthermore, the reduced air pollution in Europe may have contributed to the Arctic warming during the last decades18,19, and possible reductions of Asian aerosols under a strong mitigation policy may increase the future AA20. In climate models, it has been shown21 that AA occurs rapidly in response to external forcings due to atmospheric lapse rate feedback, with sea ice-related feedbacks becoming more important later on. A recent study22 reported a stronger future AA in a low than a high-emission scenario due to the faster melting of sea ice and weaker ice-albedo feedback.
There is little consensus on the magnitude of the recent AA. Numerous recent studies report the Arctic having warmed either almost twice23, about twice24, or more than twice25,26 as fast as the global average. However, the warming ratios reported in these and many other studies have usually been only referenced from older, possibly outdated, estimates and have not included recent observations. The recent Arctic Monitoring and Assessment Programme (AMAP) report27 states the rate of Arctic warming as being three times as fast as the global warming during the period 1971–2019.
The lack of consensus on the magnitude of AA stems from the various definitions of AA: both the period of interest and the area of the Arctic have been defined in multiple ways. The warming can be calculated using linear trends for the last 30-50 years or even longer periods. Moreover, the area of Arctic can be defined using the area poleward of 60∘N, 65∘N or 70∘N, or using definitions not based on latitude28. Uncertainties arising when calculating AA in observations and models have also been emphasized28,29.
While there have been improvements in climate models to realistically represent the evolution of Arctic climate30,31 and sea ice32 under global warming, most models in the latest generation of Coupled Model Intercomparison Project phase 6 (CMIP6) still fail to simulate plausible sensitivity of Arctic sea-ice loss to the rise of global temperatures33. In earlier studies, the discrepancy between observed and simulated sea ice trends have been attributed to a lower sensitivity of modelled Arctic sea ice trends to global warming34 or anthropogenic CO2 emissions35. However, Swart et al.36 argued that the observed and simulated September Arctic sea-ice trends over 1979–2013 are not inconsistent when accounting properly for the internal climate variability. According to Ding et al.37, even up to 50% of the recent multi-decadal decline in Arctic sea ice may be due to internal variability.
Because the sea ice loss is one of the main mechanisms causing AA, and given that up to 50% of the recent loss may be due to realization-dependent internal variability, a relevant follow-up question is whether the climate models are able to reproduce the magnitude of the observed AA over the past 40 years or so. Earlier studies have suggested that AA is indeed weaker in climate models than in observations38,39,40,41, but a comprehensive comparison between the observed and simulated AA ratio, using the most up-to-date observations and multiple climate model ensembles, has not yet been performed.
The first objective of this study is to quantify the magnitude of AA by utilizing most recent observational datasets covering the Arctic region, and a diagnostic equation for AA. Our focus is in the 1979–2021 period, as more accurate remote sensing observations from the Arctic have been available since 1979, and because this era is characterized by strong Arctic warming. Secondly, we assess the ability of climate models to reproduce the observed AA. We show that during 1979–2021, the Arctic has warmed nearly four times faster than the globe, and provide evidence that climate models struggle to simulate this four-fold Arctic amplification ratio.
Results
Observed arctic amplification
The evolution of global mean and Arctic mean temperatures during 1950–2021 is shown in Fig. 1a by considering the four observational datasets: NASA’s Goddard Institute for Space Studies Surface Temperature version 4 (GISTEMP), the Berkeley Earth temperature dataset (BEST), the Met Office Hadley Centre/Climatic Research Unit version 5.0.1.0 (HadCRUT5) and ERA5 reanalysis. Compared to the global temperatures (Fig. 1a, light colours), the warming in the Arctic (Fig. 1a, dark colours) is much more pronounced, especially since the late 1970s. We note also that the different datasets are in a close agreement since 1979, but in the pre-1979 period ERA5 is markedly colder than the three other datasets. Reasons for this cold bias are presumably related to lower number of assimilated observations, as discussed in earlier studies42,43.
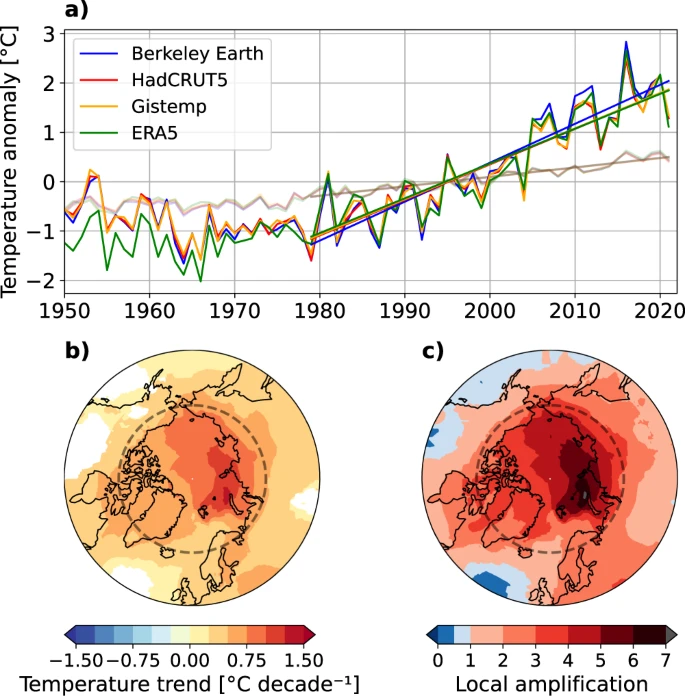
a Annual mean temperature anomalies in the Arctic (66.5∘–90∘N) (dark colours) and globally (light colours) during 1950–2021 derived from the various observational datasets. Temperature anomalies have been calculated relative to the standard 30-year period of 1981–2010. Shown are also the linear temperature trends for 1979–2021. b Annual mean temperature trends for the period 1979–2021, derived from the average of the observational datasets. Areas without a statistically significant change are masked out. c Local amplification ratio calculated for the period 1979–2021, derived from the average of the observational datasets. The dashed line in (b) and (c) depicts the Arctic Circle (66.5∘N latitude).
Due to the good agreement over the last 43 years, we next consider the average of these four datasets as an observational estimate. The observations indicate that, during 1979–2021, a large fraction of the Arctic Ocean was warming faster than 0.75 ∘C decade−1 (Fig. 1b), with a maximum warming in the Eurasian sector of the Arctic Ocean, near Svalbard and Novaya Zemlya. In this region, the temperature trend over 1979–2021 locally exceeds 1.25 ∘C decade−1 (Fig. 1b). In contrast, large continental regions in the North America and, to a lesser extent, in Western Siberia, do not manifest statistically significant trends in temperatures; however these regions are mainly located in mid-latitudes and are only indirectly affected by AA. The spatial patterns of temperature trends are broadly consistent across the individual observational datasets (Fig. S2), with GISTEMP and HadCRUT5 showing somewhat less pronounced warming maxima near Svalbard and Bering Strait (Fig. S2a and c) than BEST and ERA5.
When the temperature trends shown in Fig. 1b are divided by the multi-dataset global mean temperature trend at each grid-point, we get the spatial map of 43-year local Arctic amplification (AA43), or simply local amplification when calculated for areas south of the Arctic circle (Fig. 1c). Values higher than one indicate that those regions are warming faster than the global average, while values below one correspondingly indicate a slower warming. The AA43 maps for individual observational datasets are provided in the Supplementary Fig. S3.
During 1979–2021, major portions of the Arctic Ocean were warming at least four times as fast as the global average (Fig. 1c). The most extreme AA values occur in the sea areas near Novaya Zemlya, which were locally warming up to seven times as fast as the global average. These high warming rates are consistent with recent research44, and evidently, the primary reason for such a high amplification ratio is the reduction of cold-season ice cover, which has been most pronounced in the Barents Sea44,45. Furthermore, it has been found that changes in atmospheric circulation have amplified the warming in this area46,47. In general, there are no regions within the Arctic Circle where AA43 is smaller than two, apart from the northern North Atlantic.
The observed multi-dataset mean temperature trend in the Arctic is 0.73 ∘C decade−1 and for the globe as a whole 0.19 ∘C decade−1, with small differences between the individual datasets (Fig. S4a). Using Eq. (1) and the multi-dataset mean values for the Arctic and global mean warming trends, we arrive at AA43 (hereafter referred as observed AA43) of 3.8 for the latest 43-year period of 1979–2021. The individual AA43 values range from 3.7 in ERA5 to 4.1 in BEST (Table 1 and Fig. S4b). Thus, referring Arctic warming as being two times as fast as the global mean clearly underestimates the situation during the recent 43 years.
When different southern boundaries for the Arctic region are considered, AA43 ranges generally between 3 and 4 (Fig. 2a). In general, with any reasonable combination for the length of the time window (≥20 years) and for the southern boundary of the Arctic (60∘–75∘N), the value of AA is greater than 3. The magnitude of AA increases towards higher Arctic latitude thresholds, because with higher latitude a larger proportion of the area encircled by the boundary is ocean, where AA is the strongest (Fig. 1c).

The sensitivity of Arctic amplification (AA) (a) to the time window used in calculating the linear trends (x-axis) and the southern boundary of the Arctic (y-axis), and (b) the percentile rank of the observed AA in the CMIP6 ensemble distribution. The end year of all linear trends is fixed to 2021. Thus, for example, 50 years on the x-axis corresponds to the trend calculated for 1972–2021. The star marks the baseline value used in the study, corresponding to the 43-year linear trend and the southern boundary of 66.5∘N. The observed AA is derived from the average of the four observational datasets.
Arctic amplification in CMIP5 and CMIP6 simulations
Figure 3 demonstrates how the observed AA43 has intensified in the course of time: while in the beginning of the century the warming ratio of the Arctic to the globe over the previous 43 years was smaller than three, the recent amplified Arctic warming48 relative to the globe has raised the ratio close to four.

The 43-year Arctic amplification (AA) ratio derived from (a) CMIP5, (b) CMIP6, (c) MPI-GE and (d) CanESM5 realizations (thin grey lines) for all 43-year periods ending in 2000–2040. The x-axis represents the ending year of the 43-year AA ratios. Thick black lines represents the ensemble mean AA, calculated as a mean of ratios, not ratio of means. Observations (red lines) extend to 2021. 43-year AA ratios starting after 1970 and ending by 2040 are considered in the probability calculations (Section “Likelihood of observed Arctic amplification 1979–2021 in climate model simulations”) and shown with light background. The Arctic is defined as the area north of 66.5∘N.
The observed four-fold warming in the Arctic fits poorly in the spread of the CMIP5 and CMIP6 multi-model ensembles (Fig. 3). Compared with the observed AA43 in 2021 (3.8), the CMIP5 ensemble-mean AA43 (2.5) and CMIP6 ensemble-mean (2.7) are underestimated by 34% and 29%, respectively (Fig. 3a, b and S5b). However, the observed AA43 reflects both the forced response to external forcing as well as the internal climate variability on the multi-decadal timescales considered here. Instead, in the ensemble mean of the climate models, the internal variability of climate system has been effectively averaged out, and thus the ensemble mean reflects only the models’ response to the external forcing. For this reason, comparing the observations only to the ensemble mean may be misleading, and therefore, the observed AA43 needs to be put into context of the envelope of simulated AA43.
In the CMIP5 ensemble, there are only a few realizations which simulate stronger amplification than the observations (Fig. 3a). However, the fact that only one realization per model is used in the CMIP5 ensemble may imply that some of the extreme cases are missing. In general, CMIP6 models simulate slightly stronger AA43 than CMIP5 models. Nonetheless, the majority of CMIP6 realizations in which the simulated AA43 is stronger than the observed AA43, occur earlier in the 21st century (Fig. 3b). It is also worth noting that CMIP6 models have generally a larger spread in AA43 than CMIP5, even when considering only one realization per CMIP6 model (not shown). Some CMIP6 realizations simulate cooling for the Arctic (negative AA43) while some other realizations have higher than five-fold warming in the Arctic compared to the globe (Fig. 3b). The large spread in CMIP6-simulated AA is in line with an earlier study39 and highlights the effect of large internal variability for AA, even on a 43-year time scale.
Figure 4 shows AA as a function of the starting year used for calculating the trends. In general, the shorter the time period for which AA is calculated, the larger role the internal variability plays, and therefore the ensemble spread of the models tends to explode towards the right edge of the panels (i.e., towards shorter trends, Fig. 4). Considerable fraction of simulations with negative AA or very large AA (above 6) for trends shorter than 20 years suggest that such short periods may not be suitable for reliable estimation of AA. The long trends, on the other hand, are more representative of the forced amplification and therefore have less spread between the realizations. The observed AA is outside the spread of CMIP5 under wide range of the trend lengths (Fig. 4a). In CMIP6, the spread of AA is clearly wider than in CMIP5 and thus, the observed AA does not fall fully outside the CMIP6 ensemble at any starting year (Fig. 4b). Nevertheless, the observed AA is a very rare occasion in CMIP6 model simulations as Fig. 2b shows that in most cases when AA is calculated over time period longer than 20 years and for southern boundary poleward from 60∘N, the observed AA falls to the top 10% of the CMIP6 model ensemble and reaching to the 99th percentile of the ensemble in several window-latitude combinations. Remarkably, for CMIP5, the observed AA is fully outside the ensemble spread at all 30-45-year trend lengths regardless of southern boundary (Fig. S6b).

Arctic amplification (AA) ratio as a function of the starting year of the trend derived from (a) CMIP5, (b) CMIP6, (c) MPI-GE and (d) CanESM5 realizations (thin grey lines). The end year of all linear trends is fixed to 2021. Thus, for example, 1950 on the x-axis corresponds to AA calculated for 1950–2021. Thick black lines represents the ensemble mean AA, calculated as a mean of ratios, not ratio of means. AA ratios shorter than 10 years are not shown. The dashed vertical line represents the 43-year AA, as calculated for 1979–2021. The Arctic is defined as the area north of 66.5∘N.
It is important to note that the discrepancy between the observational and modelled AA is sensitive to the starting year of the trend. For example, when AA is calculated using the 1950–2021 time period, the observed AA is very close to the ensemble means of all climate model datasets (the left edge of the panels in Fig. 4). However, this time period includes a 30-year period of 1950–1979 when the global mean temperatures did not rise mostly due to opposing effect of the anthropogenic aerosols counteracting the greenhouse gas-induced warming49. In 1950–1979, the temperatures in the Arctic were slightly cooling (except in ERA5, see Fig. 1a). Because of this non-linearity in the observations, the linear trend estimate over the whole 1950–2021 does not capture the entire dynamics of the recent warming in the Arctic and thus should be interpreted with caution.
By considering the seasonality of AA (Fig. 5), we see that AA is the strongest in the late autumn (November) and the weakest in the warm season (July). This is consistent in both CMIP6 models and the observations, and in line with the earlier study conducted with ERA-Interim reanalysis data and CMIP5 models8. Thus, over the past 43 years, the October-December months in the Arctic have warmed five times faster than the globe, while the warming ratio is close to two in June-August (Fig. 5). The stronger AA in late autumn arises from the newly opened water areas that act to enhance upwelling longwave radiation and turbulent fluxes of sensible and latent heat from the sea into the atmosphere8.

The red circles indicate the observed AA, as derived from the average of the four observational datasets. The orange lines indicate the medians of CMIP6 realizations, boxes show the first and third quartiles, and whiskers extend to the 5–95th percentiles of the realizations. The numbers in the upper row give the percent rank of the observed AA in the CMIP6 ensemble distribution. The Arctic is defined as the area north of 66.5∘N.
The observations systematically indicate larger AA than CMIP6 models around the year. In all months, the observed AA43 falls to the upper 25 % of the CMIP6 ensemble, and even to the top 5% in April, May, June, and August. The monthly comparison of observations to CMIP5 models indicate even more pronounced underestimation of AA, especially in the melting season (Fig. S7). An interesting finding from Fig. 5 is the anomalously high observed AA in April. The high AA43 in April is consistent in all four observational datasets (not shown), and has been reported also in the earlier studies41,50. However, while Hahn et al.41 noted that the warming in April falls within the intermodel spread for CMIP6 in 1979–2014, we found that when normalized with global warming, the warming in April is distinctly outside the CMIP6 ensemble (Fig. 5). According to Hahn et al.41, model biases in the reductions of spring snow cover may contribute to the discrepancy between observations and models in the melting season.
Likelihood of observed Arctic amplification 1979–2021 in climate model simulations
How likely is the nearly four-fold warming in the Arctic, as observed in 1979–2021? To answer this question, we investigate all possible AA43 ratios starting after 1970 and ending by 2040 from all four climate model ensembles (see Section “Comparison between simulated and observed Arctic amplification”). While these 43-year periods overlap, and therefore not fully independent, we consider all these periods together because the internal climate variability is not expected to be in phase in models and observations.
In the CMIP5 simulations, there are only three realizations which simulate equally strong AA as observed between 1979 and 2021, even when the longer time window from 1970 to 2040 is allowed. This means that AA greater than or equal to the observed value of 3.8 occurs with a probability of p = 0.006 across the models (Fig. 6a). For CMIP6, we obtain a probability p = 0.028 for the occurrence of AA ≥ 3.8. If only one realization per model were used in CMIP6, the probability is p = 0.015 (Fig. S8). Thus, the CMIP6 models seem to reproduce the observed AA43 marginally better than CMIP5 models, consistent with the higher sensitivity of sea ice loss to cumulative CO2 emissions and global warming in the CMIP6 than in CMIP5 models33. Nevertheless, the likelihood of a fourfold warming in the Arctic in CMIP6 models remains still very small, indicating that the recent Arctic amplification in 1979–2021 is either extremely unlikely or the climate models systematically tend to underestimate AA.

Frequency distributions of all possible 43-year AA ratios between 1970 and 2040 in (a) CMIP5, (b) CMIP6, (c) MPI-GE, and (d) CanESM5 ensemble. The red line denotes the observed 43-year AA ratio, as calculated for 1979–2021.
The spread of simulated AA in CMIP5 and CMIP6 realizations arises from both internal climate variability and the inter-model spread. To assess the role of internal variability in the AA uncertainty, we next consider the two single-model initial-condition large ensembles (hereafter SMILEs). The individual members of SMILEs are initialized from different initial conditions with identical external forcing; thus the spread in these ensembles is solely due to internal variability51,52. In principle, SMILEs are thus powerful tool to quantify the internal variability of the climate system.
Looking at the spreads of AA43 in SMILEs, we find that they explain a majority of the total CMIP5 and CMIP6 spread, suggesting that the model uncertainty plays a relatively small role in this comparison (Fig. 6). The observed AA43 in 1979–2021 (red line) is fully outside the spread of MPI-GE (Fig. 6c), thus giving a probability p ≈ 0.00. This means explicitly that MPI-GE does not capture the observed Arctic amplification as none of its 100 ensemble members can simulate sufficiently strong AA43 in any 43-year periods between 1970 and 2040.
For CanESM5, AA43≥ 3.8 occurs with a probability of p = 0.054 (Fig. 6d). However, it is known that CanESM5 has a particularly high equilibrium climate sensitivity53, which indicates considerable higher rates of warming both in the Arctic and the globe compared to other models with the same external forcing (Fig. S5 and S9). Thus, while some members of CanESM5 simulate realistic AA43, they do so in a modelled climate which is warming much faster than the real world (Fig. S9d). In addition, the behaviour of simulated AA43 ratios in CanESM5 differ from those in other models: while in CMIP5, CMIP6 and MPI-GE simulations the most extreme AA43 values tend to occur in the beginning of 21st century, in the CanESM5 simulations AA is generally at its lowest in the beginning of the 21st century and intensifies towards 2040 (Fig. 3d).
A robust statistical test (see Section “Comparison between simulated and observed Arctic amplification” and Supplementary Methods) yields further support for the evidence that climate models as a group underestimate the present Arctic amplification. The test has been tailored to properly take into account the two main sources of uncertainty: the internal climate variability and the model uncertainty. The test returns p values of 0.00 for CMIP5 and 0.027 for CMIP6. When the test is further applied for the two SMILEs, we obtain p values of 0.00 and 0.091 for MPI-GE, and CanESM5, respectively. Thus, we can reject the null hypothesis at the 5 % level for CMIP5, CMIP6 and MPI-GE ensembles. This provides additional evidence that climate models, as a group, are not able to reproduce the observed AA43 even when properly accounting for the internal variability and the model uncertainty.
Finally, we acknowledge that the p values calculated with the statistical test are dependent on the starting year of the trends. Here we used the 43-year trends calculated over 1979–2021, which showed large discrepancy (and thus low p values) between the observations and model realizations. The longer trends, which should in principle better reflect the externally forced response of the climate system, show a closer agreement (and evidently higher p values) with the climate models (Fig. 4). However, going back in time from 1979 increases the observational uncertainty, and the resulting linear trends do not fully represent the recent warming period in the Arctic due to a non-linear evolution of the temperature (Fig. 1a).
Discussion
We present evidence that during 1979–2021 the Arctic has been warming nearly four times as fast as the entire globe. Thus, we caution that referring to Arctic warming as to being twice as fast as the global warming, as frequently stated in literature, is a clear underestimation of the situation during the last 43 years since the start of the satellite observations. At a regional scale, areas in the Eurasian sector of the Arctic Ocean have warmed even up to seven times as fast as the globe (Fig. 1c).
There are two main reasons why our calculation of AA is greater than the earlier estimates generally referenced in literature: (1) the earlier estimates may be outdated due to continued warming in the Arctic (Figs. 1a and 3), and (2) the period of interest and the area of the Arctic can be defined in multiple ways. We used the satellite era (1979–2021) when the remote sensed observations from the Arctic are available, and defined the area of the Arctic using the Arctic Circle as the southern boundary (66.5∘–90∘N). With these parameters, the observed rate of warming in the Arctic is 3.8 times as strong as the global average (Table 1). A more inclusive definition for the Arctic (e.g., >60∘N) would yield smaller ratio (3.2 for 60∘N, see Fig. 2a), but this include more land areas where the sea ice loss feedback is absent.
The advanced interpolation methods in the observational datasets54,55 mean that we now have an improved estimate of the warming trends in areas with scarce data such as the Arctic. However, although the modern observational datasets used in this study produce a spatially comprehensive temperature fields for the Arctic, the low number of observations, particularly from the ice-covered Arctic Ocean, implies that the estimates can have substantial uncertainties. For example, Simmons et al.42 discusses the peculiar cooling, or the lack of warming trend in ERA5 in the area north of Greenland, and link this with questionably low values of the sea ice concentration in ERA5 prior to 1990. This inconsistency in the temperature trends is also visible in our study (Fig. S2d). On the other hand, it has been evaluated that out of five different reanalysis datasets, ERA5 performs the best over the open Arctic ocean56. ERA5 was also found to generally describe well the temporal and spatial characteristics of near-surface temperatures in the Arctic in 1979–201431. Nevertheless, when averaging the temperature trends across the whole Arctic, the inconsistencies in the regional trends appear to cancel out. As a result, the regional averages are surprisingly well aligned (Fig. S4a). Still, we acknowledge the possibility that the observed temperature trends may have common biases for example over the polar ice cap that can affect the magnitude of observed AA, and thus also the model vs. observation differences.
One potential factor increasing the observed AA is the hiatus phase in global warming that occurred between about 1998 and 201257, although the existence of the hiatus has been questioned by a thorough statistical analysis58. Nevertheless, in these years global mean temperature rose more slowly, which acts to reduce the denominator of Eq. (1) for the entire period 1979–2021. According to a previous study59, an important contributing factor to the hiatus was the low sea surface temperature in the equatorial Pacific Ocean. Nevertheless, the impact of tropical Pacific temperature anomalies did not extend to high northern latitudes where warming continued unabatedly (Fig. 1a), keeping the numerator of Eq. (1) large.
Our results demonstrate that climate models as a group tend to underestimate the observed Arctic amplification in the 1979–2021 time period, i.e. since the beginning of the recent period of global warming. This is also true for the latest CMIP6 models despite the fact that some of these models better reproduce the absolute warming rate in the Arctic. However, those models that show plausible Arctic warming trend typically have too much global warming as well when compared to observations. In contrast, those models that simulate global warming close to that observed, generally have too weak Arctic warming (Fig. S9). Thus, our results show that most climate models are unable to simulate a fast-warming Arctic simultaneously with weaker global warming, as found earlier for the relationship of Arctic sea ice decline and global atmospheric warming34. Most strikingly the underestimation was true for the CMIP5 and MPI-GE ensembles, which altogether included only three realizations simulating as high AA as observed in 1979–2021. These results, i.e., lower AA in CMIP5 and CMIP6 models compared to the observations, are consistent with earlier studies38,40,41. Nevertheless, we also found that the discrepancy in AA between climate models and observations is smaller when calculated over longer periods, such as 1950–2021 (Fig. 4).
The physical mechanisms behind the underestimation of AA in climate models remain unknown, but may be related to, e.g., errors in the model sensitivity to greenhouse gas forcing and in the distribution of the forced heating between the atmosphere, cryosphere and the ocean, and in different heights/depths in the atmosphere/ocean. Moreover, internal variability or uncertainties in observations may also contribute to the difference in AA between climate models and observations.
We found that the recent near-surface Arctic amplification ratio is about 40–50% stronger than the multi-model mean amplification derived from CMIP5 and CMIP6 ensembles (Fig. 3 and Table 1). If assuming that these multi-model means represent the externally forced signal for AA, our findings suggest that the unforced climate variability has played a large role in intensifying the recent amplification. This resonates with the results by Ding et al.37 who found that internal climate variability has contributed to about 40–50% of observed multi-decadal decline in Arctic sea ice over 1979–2013. There is also evidence that climate models underestimate the multi-decadal internal variability of the extratropical atmospheric circulation60,61, thus potentially underestimating the temperature variability in the Arctic as well. Nevertheless, if the internal variability indeed proves to be an important source for the difference of AA between the model simulations and observations, one can expect that the observed AA will be reduced in the long term, along with the reduction of the ratio of forced to unforced climate change.
Further, the inability of climate models to simulate realistic AA, here defined in terms of 2-m air temperature, may have implications for future climate projections. Specifically, the tug of war between the near-surface AA and upper-tropospheric tropical amplification of climate warming over the future changes in storm tracks62,63 projected by climate models may be biased towards the forcing by tropical warming, implicating that both projected storm track changes and associated regional climate changes may be biased. Our results call for more detailed investigation of mechanisms behind AA and their representation in climate models.
Methods
Observational data
For the near-surface air temperature, we used three in-situ temperature records and one reanalysis dataset. For in-situ datasets, we used NASA’s Goddard Institute for Space Studies Surface Temperature version 4 (GISTEMP)64, the Berkeley Earth temperature dataset (BEST)54, and the Met Office Hadley Centre/Climatic Research Unit version 5.0.1.0 (HadCRUT5)55. In these datasets, near-surface air temperature is based on a combination of 2-m temperature observations over land and sea surface temperature (SST) observations over the ocean.
GISTEMP spatially extrapolates temperatures into unmeasured regions using a 1200-km radius of influence for the stations. BEST employs kriging-based spatial interpolation, and HadCRUT5 uses their own statistical infilling method. In all these datasets, areas of sea ice are treated as if they were land, and SST observations are used and extrapolated only at the grid cells which are ice free. The coverage of sea ice is obtained from Met Office Hadley Centre sea ice and sea surface temperature data set, HadISST265.
In addition to the three purely observational datasets, we used ERA5 reanalysis66, which has been produced by the European Centre for Medium-Range Weather Forecasts. We used monthly mean 2-m temperature fields in the native, 0.25∘ horizontal resolution. The first release of ERA5 covers the years from 1979 to the present, but a preliminary extension for 1950–1978 was recently released43. We used the whole time series, from 1950 to 2021. All the observational temperature datasets used are listed in Table S1.
To assess the accuracy of the four datasets applied in our study (GISTEMP, BEST, HadCRUT5, ERA5) in the Arctic, we conducted a validation against the Global Historical Climatology Network monthly (GHCN-M) station data67. We used the station data which was bias-adjusted for non-climatic effects (indicated by the suffix “.qcf” in the GHCN-M database). We selected all the stations located north of 66.5∘N that had at least 39 years of data over the 43-year period of 1979–2021. In total, these criteria resulted in 87 stations. We calculated the temperature trends for each station, and compared them with the average across the four gridded datasets. These results are shown in Fig. S1. The median difference between the trends estimated from the gridded data and the 87 station observations (gridded minus stations) is −0.019 ∘C decade−1. Therefore, we conclude that the average of the four gridded temperature datasets generally captures well the temporal trends of the near-surface mean temperature in the Arctic, which makes it suitable to be used as a basis of our study.
Climate model data
We compared the observed temperatures to four climate model ensembles, which are listed in Table S2. These ensembles are (i) one realization from each model in the CMIP5 multi-model ensemble68, (ii) all available realizations from each model in the CMIP6 multi-model ensemble69, (iii) the 100-member Max-Planck Institute Grand Ensemble (MPI-GE)70, and (iv) the 50-member Canadian Earth System Model version 5 (CanESM5)53. CanESM5 is a part of CMIP6 ensemble but we examine it separately because the large ensemble size provides an opportunity to highlight the role of internal variability. Thus, in our analysis, CanESM5 was not included in CMIP6. MPI-GE and CanESM5 were chosen as they provide large ensembles for RCP4.5 or SSP2-4.5 emission scenarios and represent opposite sides of the equilibrium climate sensitivity with 2.8 K70 for MPI-GE and 5.6 K for CanESM553. Our key results were not notably affected if CanESM5 was considered as a part of CMIP6.
All four climate model datasets consisted of historical simulations (1950–2005 for CMIP5 and MPI-GE, and 1950–2014 for CMIP6 and CanESM5) and future projections forced by the RCP4.5 scenario for CMIP5 and MPI-GE, and SSP2-4.5 for CMIP6 and CanESM5 (Table S2). As we focus only on the pre-2040 period, our main results do not markedly depend on the choice of the emission scenario. In all climate model datasets, monthly averaged data for 2-m air temperature were used. The list of all the CMIP5 and CMIP6 models used can be found from the supplement Tables S3 and S4.
We acknowledge that the three in-situ temperature records (GISTEMP, BEST and HadCRUT5) do not provide a fully like-for-like comparison to climate models since the in-situ datasets report a blend of land 2-m temperature and SST, whereas the model output is the 2-m air temperature (SAT). According to Cowtan et al.71, the global warming trend derived from the model blended fields are about 7 % lower than the trend from the model SAT fields over the 1975–2014 period. To reduce the potential impacts of this difference, we conducted our analysis also with ERA5 reanalysis data which provides like-for-like comparison to climate models.
Defining the Arctic amplification
We follow the recommendation of Smith et al.72, and define Arctic amplification (AA) as the ratio of Arctic warming to the global-mean warming:
where dT/dtA and dT/dtG are the slopes of linear trends of near-surface temperature, calculated using a least-squares fitting for the annual and monthly mean values for the Arctic and global domain. The trends were calculated for different time periods (see Fig. 2a), but 43-year AA ratios (hereafter referred to AA43) were chosen to be of the primary interest, because (i) 43 years covers the majority of the recent warming period when the warming has been approximately linear (Fig. 1a), (ii) the reanalysis products, such as ERA5, are known to be more reliable during this period because satellite remote sensing data on atmospheric variables and sea ice concentration have become largely available since 197973, and (iii) there is disagreement between ERA5 and the three in-situ datasets in the Arctic prior to 1979 (see Fig. 1a). Furthermore, the definition of AA naturally only makes physical sense if there is global warming on which Arctic warming is superimposed. Therefore, those modelled AA ratios for which the global warming trend was not significant according to non-parametric Mann-Kendall test74 were neglected.
While different areal definitions for the Arctic exist, we use the area encircled by the Arctic Circle (66.5∘–90∘N) as the primary definition of the Arctic, because this is the area that most scientists consider the Arctic75, and it is one of the definitions used by AMAP76. The fifth assessment report (AR5) of the Intergovernmental Panel on Climate Change defined the Arctic as the region poleward from 67.5∘N77, and AR6 used 67.7∘N as the southern boundary78. For a sensitivity assessment, dT/dtA was also calculated using different definitions for the southern boundary of the Arctic, ranging from 55∘N to 80∘N (Fig. 2a).
Comparison between simulated and observed Arctic amplification
We compare the simulated AA with observations using two approaches. In the first approach, we extract all possible AA43 ratios for the 43-year periods starting from 1970 and ending by 2040 from all four climate model ensembles. Accordingly, there are 29 43-year periods in total, which are overlapping partly with each other (1970–2012, 1971–2013, ..., 1998–2040). The time window of 1970–2040 was chosen to avoid the nearly ice-free climate conditions later in the 21st century, the comparison of which with the currently-observed values would be meaningless. The starting year 1970 reflects approximately the time when the recent period of sustained global warming has started79. All possible 43-year time windows were considered because the internal climate variability in the models is not expected to be in phase with the real climate system. Using all realizations and the 29 different 43-year periods gives us an opportunity to assess in total 11020 simulated AA43 ratios (29 periods x 380 realizations), with a sample of 1044 in CMIP5, 5626 in CMIP6, 2900 in MPI-GE, and 1450 in CanESM5. The probabilities are calculated as the number of simulated AA43 equal to or greater than the observed AA43, divided by the total number of simulated AA43 ratios. For the CMIP6 ensemble, the probability has been calculated first for each model separately, then taking the average across the models. This gives a weight of 1 for each model.
To further assess the robustness of our findings, we utilize an alternative statistical test employed earlier for global warming80 and for sea ice trends36 as a second approach. The details of the test are fully explained in the Supplementary Methods. In the test, we compare the observed AA43 in 1979–2021 to the values of AA43 over the same period simulated by the climate models belonging to the four datasets. The null hypothesis of the test is that the observed and simulated AA ratios are equal, assuming that the models are exchangeable with each other. The differences between the observed and simulated AA ratios have p-values which tell the evidence against the null hypothesis. The smaller the p-value, the stronger is the evidence against the null hypothesis. We use p = 0.05 as a threshold to reject the null hypothesis.
Data availability
The datafiles for producing the charts and graphs of this manuscript are deposited in the public repository of the Finnish Meteorological Institute at https://doi.org/10.23728/fmi-b2share.5d81ded56e984072a5f7162a18b60cb9. Gistemp data are available from https://data.giss.nasa.gov/gistemp/, Berkeley Earth data from http://berkeleyearth.org/data/, HadCRUT5 data from https://www.metoffice.gov.uk/hadobs/hadcrut5/data/current/download.html, and ERA5 data from https://cds.climate.copernicus.eu. CMIP5 and CMIP6 data are available from Earth System Grid Federation (ESGF) archive at https://esgf-node.llnl.gov/projects/cmip5/ and https://esgf-data.dkrz.de/search/cmip6-dkrz/, respectively. MPI-GE data is available under licence from https://mpimet.mpg.de/en/grand-ensemble/.
Code availability
Python- and R-language scripts used for this analysis are available from Github: https://github.com/mikarant/arctic-amplification.
References
Serreze, M. C. & Francis, J. A. The Arctic amplification debate. Clim. Change 76, 241–264 (2006).
Serreze, M., Barrett, A., Stroeve, J., Kindig, D. & Holland, M. The emergence of surface-based Arctic amplification. Cryosphere 3, 11 (2009).
England, M. R., Eisenman, I., Lutsko, N. J. & Wagner, T. J. The recent emergence of Arctic Amplification. Geophys. Res. Lett. 48, e2021GL094086 (2021).
Holland, M. M. & Bitz, C. M. Polar amplification of climate change in coupled models. Clim. Dyn. 21, 221–232 (2003).
Park, H.-S., Kim, S.-J., Stewart, A. L., Son, S.-W. & Seo, K.-H. Mid-holocene Northern Hemisphere warming driven by Arctic amplification. Sci. Adv. 5, eaax8203 (2019).
Screen, J. A. & Simmonds, I. The central role of diminishing sea ice in recent Arctic temperature amplification. Nature 464, 1334–1337 (2010).
Thackeray, C. W. & Hall, A. An emergent constraint on future Arctic sea-ice albedo feedback. Nat. Clim. Change 9, 972–978 (2019).
Dai, A., Luo, D., Song, M. & Liu, J. Arctic amplification is caused by sea-ice loss under increasing CO2. Nat. Commun. 10, 1–13 (2019).
Jenkins, M. & Dai, A. The impact of sea-ice loss on arctic climate feedbacks and their role for Arctic amplification. Geophys. Res. Lett. 48, e2021GL094599 (2021).
Pithan, F. & Mauritsen, T. Arctic amplification dominated by temperature feedbacks in contemporary climate models. Nat. Geosci. 7, 181–184 (2014).
Stuecker, M. F. et al. Polar amplification dominated by local forcing and feedbacks. Nat. Clim. Change 8, 1076–1081 (2018).
Bintanja, R., Graversen, R. & Hazeleger, W. Arctic winter warming amplified by the thermal inversion and consequent low infrared cooling to space. Nat. Geosci. 4, 758–761 (2011).
Taylor, P. C. et al. A decomposition of feedback contributions to polar warming amplification. J. Clim. 26, 7023–7043 (2013).
Beer, E., Eisenman, I. & Wagner, T. J. Polar amplification due to enhanced heat flux across the halocline. Geophys. Res. Lett. 47, e2019GL086706 (2020).
Graversen, R. G. & Burtu, M. Arctic amplification enhanced by latent energy transport of atmospheric planetary waves. Q. J. R. Meteorological Soc. 142, 2046–2054 (2016).
Woods, C. & Caballero, R. The role of moist intrusions in winter Arctic warming and sea ice decline. J. Clim. 29, 4473–4485 (2016).
Kim, B.-M. et al. Major cause of unprecedented Arctic warming in January 2016: Critical role of an Atlantic windstorm. Sci. Rep. 7, 1–9 (2017).
Navarro, J. A. et al. Amplification of Arctic warming by past air pollution reductions in Europe. Nat. Geosci. 9, 277–281 (2016).
Krishnan, S. et al. The roles of the atmosphere and ocean in driving Arctic warming due to European aerosol reductions. Geophys. Res. Lett. 47, e2019GL086681 (2020).
Merikanto, J. et al. How asian aerosols impact regional surface temperatures across the globe. Atmos. Chem. Phys. 21, 5865–5881 (2021).
Previdi, M., Janoski, T. P., Chiodo, G., Smith, K. L. & Polvani, L. M. Arctic amplification: A rapid response to radiative forcing. Geophys. Res. Lett. 47, e2020GL089933 (2020).
Ono, J., Watanabe, M., Komuro, Y., Tatebe, H. & Abe, M. Enhanced Arctic warming amplification revealed in a low-emission scenario. Commun. Earth Environ. 3, 1–9 (2022).
Yu, L., Zhong, S., Vihma, T. & Sun, B. Attribution of late summer early autumn Arctic sea ice decline in recent decades. npj Clim. Atmos. Sci. 4, 3 (2021).
Walsh, J. E. Intensified warming of the Arctic: Causes and impacts on middle latitudes. Glob. Planet. Change 117, 52–63 (2014).
Richter-Menge, J. & Druckenmiller, M. L. (eds.) The Arctic [In “State of the Climate in 2019“]. Bull. Am. Meteorological Soc. 101, S239–S285 (2020).
Jansen, E. et al. Past perspectives on the present era of abrupt Arctic climate change. Nat. Clim. Change 10, 714–721 (2020).
AMAP. Arctic climate change update 2021: key trends and impacts. Summary for policy-makers. Arctic Monitoring and Assessment Programme (AMAP), Oslo, Norway (2021).
Davy, R., Chen, L. & Hanna, E. Arctic amplification metrics. Int. J. Climatol. 38, 4384–4394 (2018).
Hind, A., Zhang, Q. & Brattström, G. Problems encountered when defining Arctic amplification as a ratio. Sci. Rep. 6, 30469 (2016).
Davy, R. & Outten, S. The Arctic surface climate in CMIP6: status and developments since CMIP5. J. Clim. 33, 8047–8068 (2020).
Cai, Z. et al. Arctic warming revealed by multiple CMIP6 models: evaluation of historical simulations and quantification of future projection uncertainties. J. Clim. 34, 4871–4892 (2021).
Stroeve, J. C. et al. Trends in Arctic sea ice extent from CMIP5, CMIP3 and observations. Geophys. Res. Lett. 39, L16502 (2012).
Notz, D. & Community, S. Arctic sea ice in CMIP6. Geophys. Res. Lett. 47, e2019GL086749 (2020).
Rosenblum, E. & Eisenman, I. Sea ice trends in climate models only accurate in runs with biased global warming. J. Clim. 30, 6265–6278 (2017).
Notz, D. & Stroeve, J. Observed Arctic sea-ice loss directly follows anthropogenic CO2 emission. Science 354, 747–750 (2016).
Swart, N. C., Fyfe, J. C., Hawkins, E., Kay, J. E. & Jahn, A. Influence of internal variability on Arctic sea-ice trends. Nat. Clim. Change 5, 86–89 (2015).
Ding, Q. et al. Fingerprints of internal drivers of Arctic sea ice loss in observations and model simulations. Nat. Geosci. 12, 28–33 (2019).
Cohen, J. et al. Divergent consensuses on Arctic amplification influence on midlatitude severe winter weather. Nat. Clim. Change 10, 20–29 (2020).
Ye, K. & Messori, G. Inter-model spread in the wintertime Arctic amplification in the CMIP6 models and the important role of internal climate variability. Glob. Planet. Change 204, 103543 (2021).
Previdi, M., Smith, K. L. & Polvani, L. M. Arctic amplification of climate change: a review of underlying mechanisms. Environ. Res. Lett. 16, 093003 (2021).
Hahn, L. C., Armour, K. C., Zelinka, M. D., Bitz, C. M. & Donohoe, A. Contributions to polar amplification in CMIP5 and CMIP6 models. Front. Earth Sci. 725, 710036 (2021).
Simmons, A. et al. Low frequency variability and trends in surface air temperature and humidity from ERA5 and other datasets, EMCWF Tech. Mem. 881, https://doi.org/10.21957/ly5vbtbfd (2021).
Bell, B. et al. The ERA5 global reanalysis: preliminary extension to 1950. Q. J. R. Meteorol. Soc. 147, 4186–4227 (2021).
Isaksen, K. et al. Exceptional warming over the Barents area. Sci. Rep. 12, 9371 (2022).
Onarheim, I. H. & Årthun, M. Toward an ice-free Barents sea. Geophys. Res. Lett. 44, 8387–8395 (2017).
Wickström, S., Jonassen, M., Vihma, T. & Uotila, P. Trends in cyclones in the high-latitude North Atlantic during 1979–2016. Q. J. R. Meteorological Soc. 146, 762–779 (2020).
Räisänen, J. Effect of atmospheric circulation on surface air temperature trends in years 1979–2018. Clim. Dyn. 56, 2303–2320 (2021).
Huang, J. et al. Recently amplified arctic warming has contributed to a continual global warming trend. Nat. Clim. Change 7, 875–879 (2017).
Hegerl, G. C. et al. Causes of climate change over the historical record. Environ. Res. Lett. 14, 123006 (2019).
Screen, J. A., Deser, C. & Simmonds, I. Local and remote controls on observed Arctic warming. Geophys. Res. Lett. 39 (2012).
Maher, N., Milinski, S. & Ludwig, R. Large ensemble climate model simulations: introduction, overview, and future prospects for utilising multiple types of large ensemble. Earth Syst. Dyn. 12, 401–418 (2021).
Suarez-Gutierrez, L., Milinski, S. & Maher, N. Exploiting large ensembles for a better yet simpler climate model evaluation. Clim. Dyn. 57, 2557–2580 (2021).
Swart, N. C. et al. The Canadian Earth System Model version 5 (CanESM5.0.3). Geoscientific Model Dev. 12, 4823–4873 (2019).
Rohde, R. A. & Hausfather, Z. The Berkeley Earth land/ocean temperature record. Earth Syst. Sci. Data 12, 3469–3479 (2020).
Morice, C. P. et al. An Updated Assessment of Near-Surface Temperature Change From 1850: The HadCRUT5 Data Set. J. Geophys. Res.: Atmospheres 126, e2019JD032361 (2021).
Graham, R. M., Hudson, S. R. & Maturilli, M. Improved Performance of ERA5 in Arctic Gateway Relative to Four Global Atmospheric Reanalyses. Geophys. Res. Lett. 46, 6138–6147 (2019).
Medhaug, I., Stolpe, M. B., Fischer, E. M. & Knutti, R. Reconciling controversies about the global warming hiatus. Nature 545, 41–47 (2017).
Mudelsee, M. Trend analysis of climate time series: A review of methods. Earth-Sci. Rev. 190, 310–322 (2019).
Stolpe, M. B., Cowtan, K., Medhaug, I. & Knutti, R. Pacific variability reconciles observed and modelled global mean temperature increase since 1950. Clim. Dyn. 56, 613–634 (2021).
Kravtsov, S. Pronounced differences between observed and CMIP5-simulated multidecadal climate variability in the twentieth century. Geophys. Res. Lett. 44, 5749–5757 (2017).
O’Reilly, C. H. et al. Projections of northern hemisphere extratropical climate underestimate internal variability and associated uncertainty. Commun. Earth Environ. 2, 1–9 (2021).
Shaw, T. et al. Storm track processes and the opposing influences of climate change. Nat. Geosci. 9, 656–664 (2016).
Peings, Y., Cattiaux, J. & Magnusdottir, G. The polar stratosphere as an arbiter of the projected tropical versus polar tug of war. Geophys. Res. Lett. 46, 9261–9270 (2019).
Lenssen, N. J. et al. Improvements in the GISTEMP uncertainty model. J. Geophys. Res.: Atmospheres 124, 6307–6326 (2019).
Titchner, H. A. & Rayner, N. A. The Met Office Hadley Centre sea ice and sea surface temperature data set, version 2: 1. Sea ice concentrations. J. Geophys. Res.: Atmospheres 119, 2864–2889 (2014).
Hersbach, H. et al. The ERA5 global reanalysis. Q. J. R. Meteorological Soc. 146, 1999–2049 (2020).
Menne, M. J., Williams, C. N., Gleason, B. E., Rennie, J. J. & Lawrimore, J. H. The global historical climatology network monthly temperature dataset, version 4. J. Clim. 31, 9835–9854 (2018).
Taylor, K. E., Stouffer, R. J. & Meehl, G. A. An overview of CMIP5 and the experiment design. Bull. Am. Meteorological Soc. 93, 485–498 (2012).
Eyring, V. et al. Overview of the coupled model intercomparison project phase 6 (CMIP6) experimental design and organization. Geosci. Model Dev. 9, 1937–1958 (2016).
Maher, N. et al. The Max Planck Institute Grand Ensemble: enabling the exploration of climate system variability. J. Adv. Modeling Earth Syst. 11, 2050–2069 (2019).
Cowtan, K. et al. Robust comparison of climate models with observations using blended land air and ocean sea surface temperatures. Geophys. Res. Lett. 42, 6526–6534 (2015).
Smith, D. M. et al. The Polar Amplification Model Intercomparison project (PAMIP) contribution to CMIP6: Investigating the causes and consequences of polar amplification. Geoscientific Model Dev. 12, 1139–1164 (2019).
Fujiwara, M. et al. Introduction to the SPARC Reanalysis Intercomparison Project (S-RIP) and overview of the reanalysis systems. Atmos. Chem. Phys. 17, 1417–1452 (2017).
Hussain, M. & Mahmud, I. Pymannkendall: a python package for non parametric Mann Kendall family of trend tests. J. Open Source Softw. 4, 1556 (2019).
NSIDC. What is the Arctic? https://nsidc.org/cryosphere/arctic-meteorology/arctic.html (2020). Accessed: 2021-02-04.
AMAP. AMAP Assessment 2009: Human Health in the Arctic. Arctic Monitoring and Assessment Programme (AMAP), Oslo, Norway (2009).
Collins, M. et al. Long-term climate change: projections, commitments and irreversibility. In Climate Change 2013 - The Physical Science Basis: Contribution of Working Group I to the Fifth Assessment Report of the Intergovernmental Panel on Climate Change, 1029–1136 (Cambridge University Press, 2013).
Lee, J.-Y. et al. Future global climate: Scenario-based projections and near-term information. In Climate change 2021: The physical science basis. Contribution of Working Group I to the sixth assessment report of the intergovernmental panel on climate change (eds. Masson-Delmotte, V. et al.) pp. 553–672 (Cambridge University Press, Cambridge, UK and New York, NY, USA, 2021).
Gulev, S. K. et al. Changing state of the climate system. In Climate change 2021: The Physical Science Basis. Contribution of Working Group I to the sixth assessment report of the intergovernmental panel on climate change (eds Masson-Delmotte, V. et al.) pp. 287–422 (Cambridge University Press, Cambridge, United Kingdom and New York, NY, USA, 2021).
Fyfe, J. C., Gillett, N. P. & Zwiers, F. W. Overestimated global warming over the past 20 years. Nat. Clim. Change 3, 767–769 (2013).
Acknowledgements
This research has been supported by the ACCC Flagship funded by the Academy of Finland (decision no 337552). The work of MR was supported by the Academy of Finland (contract 342890). The work of TV was supported by the Academy of Finland (contract 317999) and the work of AK by the European Commission H2020 project Polar Regions in the Earth System (PolarRES, grant 101003590). CSC - IT Centre for Science, Finland, is acknowledged for computational resources, and Copernicus Climate Change Service is acknowledged for making ERA5 reanalysis available. We acknowledge the World Climate Research Programme, which is responsible for CMIP5 and CMIP6. We thank the climate modelling groups for making available their model output, the Earth System Grid Federation (ESGF) for archiving the data and providing access, and the multiple funding agencies who support CMIP5, CMIP6, and ESGF. We thank Max Planck Institute for Meteorology for making MPI-GE publicly available.
Author information
Authors and Affiliations
Contributions
The study was initialized together by A.L.i., A.La., M.R., and K.N.. M.R. wrote the initial draft of the manuscript, conducted most of the data analysis and created the figures. A.K. contributed to the downloading climate model data and the initial preparation of the manuscript. K.N. and K.R. contributed to the downloading of CMIP model data, and O.H. calculated the uncertainty estimates of the results. T.V. and A.La. contributed to the commenting of the results and revising of the manuscript. All authors commented the manuscript and discussed the results at all stages.
Corresponding author
Ethics declarations
Competing interests
The authors declare no competing interests.
Peer review
Peer review information
Communications Earth & Environment thanks Russell Blackport and the other, anonymous, reviewer(s) for their contribution to the peer review of this work. Primary Handling Editors: Viviane V. Menezes, Clare Davis, Heike Langenberg. Peer reviewer reports are available.
Additional information
Publisher’s note Springer Nature remains neutral with regard to jurisdictional claims in published maps and institutional affiliations.
Supplementary information
Rights and permissions
Open Access This article is licensed under a Creative Commons Attribution 4.0 International License, which permits use, sharing, adaptation, distribution and reproduction in any medium or format, as long as you give appropriate credit to the original author(s) and the source, provide a link to the Creative Commons license, and indicate if changes were made. The images or other third party material in this article are included in the article’s Creative Commons license, unless indicated otherwise in a credit line to the material. If material is not included in the article’s Creative Commons license and your intended use is not permitted by statutory regulation or exceeds the permitted use, you will need to obtain permission directly from the copyright holder. To view a copy of this license, visit http://creativecommons.org/licenses/by/4.0/.
About this article

Cite this article
Rantanen, M., Karpechko, A.Y., Lipponen, A. et al. The Arctic has warmed nearly four times faster than the globe since 1979. Commun Earth Environ 3, 168 (2022). https://doi.org/10.1038/s43247-022-00498-3
Received:
Accepted:
Published:
DOI: https://doi.org/10.1038/s43247-022-00498-3
This article is cited by
-
Boreal–Arctic wetland methane emissions modulated by warming and vegetation activity
Nature Climate Change (2024)
-
Sea water temperature and light intensity at high-Arctic subtidal shallows – 16 years perspective
Scientific Data (2024)
-
Radiative forcing geoengineering causes higher risk of wildfires and permafrost thawing over the Arctic regions
Communications Earth & Environment (2024)
-
Millennial-aged pyrogenic carbon in high-latitude mineral soils
Communications Earth & Environment (2024)
-
Arctic marine heatwaves forced by greenhouse gases and triggered by abrupt sea-ice melt
Communications Earth & Environment (2024)
Comments
By submitting a comment you agree to abide by our Terms and Community Guidelines. If you find something abusive or that does not comply with our terms or guidelines please flag it as inappropriate.
