
Abstract
Nanosponges are subject of intensive research due to their unique morphology, which leads among other effects to electrodynamic field localization generating a strongly nonlinear optical response at hot spots and thus enable a variety of applications. Accurate predictions of physical properties require detailed knowledge of the sponges’ chaotic nanometer-sized structure, posing a metrological challenge. A major goal is to obtain computer models with equivalent structural and optical properties. Here, to understand the sponges’ morphology, we present a procedure for their accurate 3D reconstruction using focused ion beam tomography. Additionally, we introduce a simulation method to create nanoporous sponge models with adjustable geometric properties. It is shown that if certain morphological parameters are similar for computer-generated and experimental sponges, their optical response, including magnitudes and hot spot locations, are also similar. Finally, we analyze the anisotropy of experimental sponges and present an easy-to-use method to reproduce arbitrary anisotropies in computer-generated sponges.
Introduction
Nanoporous gold structures are interesting from many perspectives and have a wide range of applications. For example, the extreme surface-to-volume ratio can be used for efficient catalysts1,2 or for highly sensitive sensors3. Nanoporous gold particles, often referred to as nanosponges, with special geometric shape structures such as nanorods can further improve existing systems4, while gold sponges created by dealloying thin Au/Ag-alloy films can be used as an efficient drug-delivery system5. The optical properties of nanoporous gold sponges such as, e.g., strongly enhanced fluorescence6 or huge Purcell factors7, are even more spectacular8,9,10, but have not yet been technologically exploited. This is partly caused by the fact that the complicated nanometer-sized three-dimensional structure impedes the characterization of the geometrical and the prediction of the resulting physical properties. A better understanding of the interplay of structural and optical properties would allow the systematic, targeted manipulation of geometric properties and, thus, allow to create nanoporous structures with tailored optical, physical, and chemical properties.
In the past, several methods were used to investigate the structure and formation mechanisms of nanoporous gold and further to make estimations for their physical and functional properties from their actual or artificial three-dimensional (3D) morphology11,12,13. This can be achieved non-destructively by reconstructing transmission electron microscopy (TEM) images14 or X-ray nanotomography15, supported with additional (chemical) information, e.g., from EDS16, or destructively, for example using atom probe tomography (APT)17,18,19. A particular powerful and precise method for determining the three-dimensional geometry of nanoporous gold is focused ion beam (FIB) tomography20,21,22, which is used also in this work. Early 3D FIB investigations of other materials containing voids were applied, e.g., for crack tracking in Al2O3/SiC nanocomposites samples23 or with samples of a BaTiO3 ceramic with particle sizes around 100 nm24. In FIB tomography, the structure is cut into thin slices along one axis and scanning electron microscopy (SEM) images of the cut-surface are acquired. Subsequently, the three-dimensional structure can be reconstructed from the series of two-dimensional images.
Different methods for the computer-aided generation of bulk nanoporous gold structures have been presented previously. Nanoporous geometries can be generated using inexpensive but inaccurate geometric concepts, e.g., a superposition of randomly orientated sinusoidal waves25, or using expensive but accurate more physical approaches, involving, e.g., Monte Carlo or molecular dynamics simulations26,27. These Monte Carlo simulations revealed that the dealloying process proceeds akin to spinodal decomposition27, which in turn can be described using the much simpler phase-field computational method28,29. For example, Sun et al.30 used a phase-field approach in conjunction with molecular dynamics to investigate mechanical properties of infinitely large nanoporous gold structures. As the actual dealloying process and the phase-field method have the same underlying physics, good agreement with experimental results is achievable.
Gold sponges have the added complication of being finite in size, with their outer surface playing an important role for their optical properties. This requires some adaptions to the previously mentioned methods. Using geometric considerations, randomly distributed spheres can be subtracted from initial half-ellipsoid geometries using Boolean operations31,32. Another method for generating sponge-like geometries is to generate correlated random numbers on a cubic grid in Fourier space. After the back transformation to real space, all voxels whose value exceeds a certain threshold are filled with gold33. Even though these methods can predict the internal structure more or less reasonably, the surface shows even less similarities to real sponge structures. To the knowledge of the authors, phase-field methods, which have seen success in the generation of bulk nanoporous gold geometries, have so far not been applied to the creation of gold nanosponge geometries.
Here, we present an efficient method for the computational creation of three-dimensional nanoporous sponges based solely on the use of phase-field simulations. We identify four global parameters that when optimized towards, lead to sponges with equivalent structures, both inside the sponge and on its surface. The method is able to capture both averaged and local geometric properties, as shown by analysis of the interfacial shape distribution (ISD). The optical properties of the sponges related to the observed strong field enhancement and strong localization of electrical fields in such systems, which make them interesting for nonlinear optics8,9,10 or highly sensitive SERS (Surface Enhanced Raman Scattering) measurements34,35, are used as a first test of the presented method via comparison with real structures. Specifically, simulated absorption and scattering cross sections as well as the occurrence, distribution, and magnitude of localized field enhancements, so-called hot spots, are analyzed.
Results
3D-FIB tomography
Two different classes of nanoporous gold nanoparticles, coarse- and fine-pored sponges, were fabricated according to the procedure outlined in the Methods section. An ensemble of typical coarse-pored particles is presented in Fig. 1a. A resulting fine-pored particle is shown in Fig. 1b. One particle from each class was chosen for 3D-FIB/SEM tomography: In short, the sponges are cut into slices using FIB and each slice is imaged using SEM (see Fig. 1c, d). The individual slices have a thickness of around 3 nm, placing a lower limit on the observable feature size. The resulting image stack is then carefully reconstructed into the three-dimensional sponge geometry. For the reconstruction of the 3D model from 2D SEM images, several steps are necessary, which are shown schematically in Fig. 2 and are described in detail in the Methods section. An important aspect during the reconstruction is the binarization of the 8-bit grayscale SEM image into gold and air phases. Here, a threshold value was chosen based on skeleton properties, like number and distribution of branches and junctions in the gold network. For further details, see Methods, Supplementary Methods 1.3 and Supplementary Fig. 3. Fig.1(e–f) show an example of a typical slice of the fine-pored particle before and after this segmentation. Before obtaining the final 3D representation of the nanosponges, the 3D models obtained from the binarized image stack are upsampled and smoothed using a Gaussian filter, with care being taken not to significantly change the particle properties mentioned later. The resulting three-dimensional sponge reconstructions are shown in Fig. 3(e, g). According to the authors’ knowledge, no such detailed analysis of a gold nanosponge structure has been performed yet in the literature.
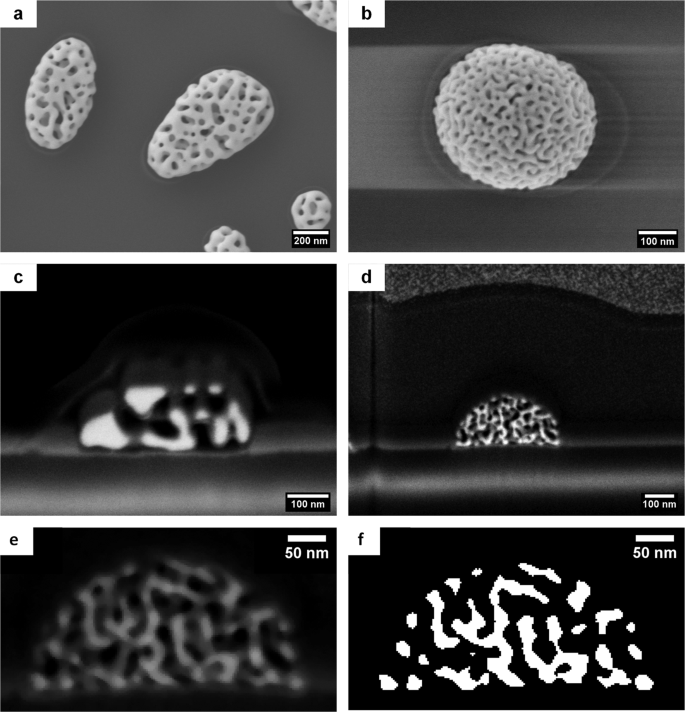
SEM images of particles on the substrate surface and cross-section images of a coarse-pored (a and c) and a fine-pored nanosponge (b and d). e Cross-section image of the the fine-pored sponge taken with the Inlens secondary electron (SE) detector. f Segmentation of the image e performed with a grayscale threshold of 60 in the 8-bit range.

a Schematic workflow for the reconstruction of the 3D models of gold nanosponges from an SEM image stack, generalized for both cases, the fine- and the coarse-pored particle. b–e Exemplary images from the same FIB section, as displayed in Fig. 1e and f, of the fine-pored sponge at different stages of the reconstruction process: b the raw stack, c after alignment and cropping, d after median filtering, e the binarized and cropped image, f the 3D voxel model and g the final smoothed meshed 3D model.

a Schematic representation of the simulation process. b–d Evolution of morphological signatures of the coarse-pored sponge Sc,1 during second phase-field simulation; Integrated Gaussian curvature KT, proportional to the number of pores; Surface fraction OF; Volume fraction VF. e–h Three-dimensional rendered images of experimentally measured and of simulated sponge geometries; measured coarse-pored reference sponge after smoothing; simulated coarse-pored sponge Sc,2; measured fine-pored reference sponge after smoothing; simulated fine-pored sponge Sf,1.
Phase-field modeling
We now present in detail a method to computationally generate nanosponge geometries which can be directly compared to the results of the 3D-FIB tomography. This model is an improved version of a similar method first reported in the conference paper ref. 36. It is designed to efficiently generate sponge-like interfaces with adjustable geometric properties and prescribed global morphological properties, while also showing remarkable agreement in local morphological and optical properties. Inspired by the actual dealloying physics (see Introduction) - but not aiming to quantitatively reproduce them - the generation of the nanosponge geometries is based on two consecutive three-dimensional phase-field simulations. Due to the close relation to the actual dealloying physics27 compared to previous purely geometrical motivated geometry creation methods, the method is able to generate geometries much closer to the experimentally observed sponges.
The sequence of simulation steps is shown schematically in Fig. 3a. In the first step, the mixture dynamics in a region filled with randomly distributed silver and gold are simulated. This step serves to generate a percolated, disordered, already sponge-like silver-gold-network. The phase-field simulation is based on the following Cahn-Hilliard equation37:
Here, ϕ denotes the phase-field function. A value of ϕ = 1 describes a point in space with pure phase 1. Accordingly, a value of ϕ = −1 corresponds to a point with pure phase 2. The quantities σ and γ define the interfacial tension and the interfacial mobility and are thus determined by the material combination. The parameter ϵpf has the unit of length and determines the thickness of the diffuse interface region. The interfacial thickness ϵpf and the interfacial mobility γ are not independent of each other and are linked by the equation \(\gamma \,=\,\chi {\epsilon }_{pf}^{2}\), with χ as a tuning parameter. The solution of Eq. (1) is calculated in the finite element software COMSOL Multiphysics38. In contrast to the previously reported version of the method36, the initial distribution of silver and gold is determined by splitting the rectangular simulation domain into thousands of small cubes with an edge length s. Each cube is afterwards filled with either pure Ag (ϕ = −1) or pure Au (ϕ = 1). The edge length s corresponds to a feature size, with more fine-pored sponges requiring smaller cubes. The initialization and the end results are thus independent of the mesh resolution, which allows for the extraction of sponge geometries with variable resolution. Further details about the implementation can be found in the Supplementary Methods 2.1.
Following this first step, a half-ellipsoidal region of the Au-Ag-mixture is cut out of the simulated bulk domain. In the resulting domain, all regions with ϕ < ϕT,1 are replaced by air, where ϕT,1 corresponds to a predefined threshold value. The resulting gold structure already roughly resembles a sponge, but its surface shows features such as flat areas and large-angle corners which are not present in the experimental sponges, as well as remaining artifacts of the block initialization. To smooth out those numerical artifacts, a second phase-field simulation is then executed on these results. This second step follows Eq. (1) as well. The difference between the first and the second phase-field step lies in the initial values: While step 1 starts from a random distribution in a rectangular domain, step 2 starts from a very rough elliptical-shaped sponge-like structure, which is merely smoothed out. Essentially, this step improves the sponge surface with little changes in the interior. The two-step protocol leads to better results than, e.g., ternary phase-field simulations, which we explored as well. The sponges resulting from this second simulation are compared to the experimentally measured sponges in Fig. 3(e–h) and show excellent agreement.
Since we are only interested in the final geometry and not aiming to reproduce the exact dynamics, we can choose the parameters σ, χ, s and ϵpf in such a way that the simulated geometries show the best agreement with the experimentally measured sponges while simultaneously needing only a short runtime of each simulation. As can be seen in Eq. (1), the mobility tuning coefficient χ and the interfacial tension σ are inversely proportional to the simulated time, i.e. doubling the simulated time while reducing the mobility tuning coefficient or the interfacial tension by half will lead to essentially the same results. The interface thickness ϵpf is chosen to be proportional to the edge length of the initialization cubes s, with a proportionality constant of around unity. Thus, for fixed values of the interfacial tension σ and the mobility tuning coefficient χ, the final shape of the sponge is determined solely by the initialization, the simulated time span, and the edge length of the initialization cubes. After the second phase-field run is completed, the final geometry of the sponge is determined by the isosurface ϕ = ϕT,2. The choice of the value ϕT,2 is the main influence determining the volume fraction of gold in the final sponge and is chosen to reproduce the measured values. Defining either threshold value as a function of the position results in anisotropic sponges, which can, e.g., model influences of the substrate resulting in sponges which are denser at the bottom, as described later.
Before the simulation begins, it is generally not known which combination of parameters will result in the desired geometry. However, during a single simulation, the results are calculated and stored for an arbitrarily chosen predetermined number of intermediate time steps. Each of these intermediate steps provides a sponge geometry with slightly different geometrical properties. The evolution of several geometrical properties (discussed in detail below) is shown in Fig. 3(b–d). Furthermore, Supplementary Movie 1 visualizes both simulation steps. Thus, it is sufficient to roughly determine the parameter range and select the sponge with the desired geometric properties after the simulation is completed.
Morphological signatures and comparison
With the help of a triangulation of the sponge geometry, all desired geometrical characteristics can be determined. In our previous work36, it was discovered that sponges which are similar in the following three geometrical characteristics also show similar optical properties. These properties are:
-
1.
Volume fraction VF of the Au phase defined as VF = VG/VCH.
-
2.
Surface area fraction OF defined as OF = OG/OCH.
-
3.
Total Gaussian curvature KT defined as \({K}_{{{{{{{{\rm{T}}}}}}}}}={\int}_{\partial {V}_{{{{{{{{\rm{G}}}}}}}}}}{\kappa }_{1}{\kappa }_{2}dA\), where κ1 and κ2 are the principal curvatures in each point on the surface of the sponge.
VCH and OCH denote the volume and surface area of the convex hull (CH) of the sponge, respectively; whereas VG and OG refer to the gold phase. The total curvature is related to the Euler characteristic χ by KT = 2πχ according to the theorem of Gauss-Bonnet39. For a closed triangulation, χ can be calculated in terms of the number NV and NT of vertices and triangles, respectively, using χ = NV − NT/2.
Further investigation has shown that an additional fourth parameter, the total mean curvature HT defined as \({H}_{{{{{{{{\rm{T}}}}}}}}}={\int}_{\partial {V}_{{{{{{{{\rm{G}}}}}}}}}}\frac{1}{2}({\kappa }_{1}+{\kappa }_{2})dA\) plays an important role regarding the optical properties as well (see Supplementary Note 1 and Supplementary Figure 7 for details).
We also introduce two additional quantities, namely the number of pores p = 1 − χ/2 and the porosity Φ = (VCH − VG)/VCH. Clearly, these properties are determined by the previously mentioned quantities. However, they are much more easily interpretable, can easily be calculated, and allow for an even simpler characterization of the optical properties of different sponges. Two examples each of measured and simulated sponge geometries are shown in Fig. 3(e–h). It is evident that a higher total Gaussian curvature corresponds to smaller pore sizes. An overview of the values for the previous as well as the new geometrical characteristics is shown in Table 1 for five coarse-pored sponges Sc,1...5, five fine-pored sponges Sf,1...5 as well as the experimentally measured sponges presented above and referred to as coarse-pored reference sponge Sc,ref and fine-pored reference sponge Sf,ref.
These quantities consider only the averaged geometric properties and therefore can be considered as global properties. As discussed later in more detail, the local geometry plays a large role for the optical properties. There is a vast array of local geometrical characteristics that can be chosen for comparison. For example, a previous geometry creation method created sponges which showed a similar radially-averaged autocorrelation function33. However, as the radially-averaged autocorrelation function is dominated by the bulk, the thereby generated sponge geometries failed to accurately model the surface geometry (which is known to significantly influence the optical behavior). Another local geometrical characteristic that has been investigated in the literature on nanoporous gold is the distribution of the local curvature40,41,42, either in the form of the principal curvatures κ1 and κ2 or the Gaussian curvature K = κ1κ2 and the mean curvature H = (κ1 + κ2)/2. The histogram of curvatures is called interfacial shape distribution (ISD) and can be used to compare the local features of different samples.
Both the experimentally measured geometries and the geometries created by the phase-field method are available as triangulations, which consist of piecewise linear surfaces. Evaluating curvatures, which are only properly defined on C2-continuous surfaces, on such a discrete geometry is not trivial. In this work, the discrete differential geometry operators presented in43 were implemented in MATLAB. Further information is available in the Methods section.
The ISD results are presented in Fig. 4: The computer-generated and the experimentally measured sponges show very similar curvature distributions. As is expected, the fine-pored sponges show generally larger curvatures, which corresponds to smaller ligaments. The shadow around the diagonal κ1 = −κ2 is an artifact of the discrete curvature evaluation. The curvatures of the computer-generated sponges can also be evaluated directly in COMSOL, where their boundary is represented as a C2-continuous surface. A comparison between the curvature calculation based on discrete differential operators and the direct curvature calculation in COMSOL shows no significant differences except for the diagonal shadow (see Supplementary Figure 5).

a Fine Reference Sponge b Fine Sponge Sf,2 c Coarse Reference Sponge, d Coarse Sponge Sc,1. The visible gap around κ1 = − κ2 is an artifact of the discrete curvature evaluation. The bins are sized 10 μm−1 by 10 μm−1 and the distributions are normalized to their maximum value.
Almost all theoretical research on gold nanosponges so far has been carried out using geometries created by taking a half-sphere or ellipsoid and cutting out small spheres, usually with a fixed radius. A geometry created from a sphere of radius r shows only curvatures corresponding to κ1 = κ2 = 1/r, while the ellipsoid equivalent to the outer hull of a sponge only covers a small region of curvatures. Because of this, geometries generated by carving out spheres from a half-ellipsoid show a vastly different distribution of curvature and the presented method significantly improves on this class of methods.
Earlier work by Ziehmer et al.42 has identified a list of characteristic geometric features in bulk nanoporous gold: irregular tori, closed ligaments, open/broken ligaments, and dead-end ligaments. All these can easily be identified in the computer-generated sponges, as exemplarily shown in Fig. 5.

a simulated phase field sponge Sf,2; b open ligament; c ligament; d dead-end ligament; e irregular toroidal structure.
We emphasize that the simulation parameters for the sponge geometries created by the phase-field method have been chosen solely based on the global geometry parameters presented in Table 1. The good agreement between the ISDs, the presence of the characteristic features identified by Ziehmer et al.42, and the similar optical properties described in the next section, are strong indications that, indeed, the phase-field method yields sponge geometries that are very similar in both global and local properties to the physical nanosponges.
Optical properties and comparison
Gold Nanosponges are well-known for their extraordinary optical properties5,6,7,8,9,10, which have already been described and analyzed in great detail. The optical response of an individual sponge is known to be strongly dependent on its specific geometry, and thus, each sponge has its own specific optical response31 which acts similar to a fingerprint. From a theoretical point of view, the absorption and scattering cross sections can be understood using the framework of localized surface plasmons44. The entire sponge acts as a plasmonic dipole, which couples to the external field and determines the main spectral region of the response. In the scattering cross section, this dipolar mode appears as a very broad peak. Local resonances, also known as hot spots, couple to this dipole much more strongly than to the external field33 and appear as strong and sharp peaks in the absorption cross section while also influencing the scattering cross section. These hot spots strongly depend on the exact shape of the local geometry and can also be recognized by their strong and highly localized field enhancement7. The optical properties can in this way serve as a marker for agreement in local properties. If the computer-generated sponges show similar optical properties to the experimental sponges, then the local geometries are likely also comparable. For this reason, the linear optical properties in the form of scattering and absorption cross sections as well as the magnitude and number of hot spots have been chosen as additional verification of the presented geometry creation method. As these optical properties depend on the exact geometrical configuration, exact agreement between the simulated response of the reconstructed experimentally measured and the computer-generated sponges is not expected. However, the cross sections should show a similar number of peaks, peak height, general shape and spectral location. In addition, images of the field enhancement on the particle surface are expected to show the occurrence of a similar number of hot spots.
To determine the optical properties of the sponges, FEM (Finite Element Method) Maxwell simulations were carried out on both the experimentally reconstructed and the computer-generated sponge geometries. Exemplary field distributions are shown in Fig. 6e–h, while a comparison between the absorption and scattering cross sections extracted from these simulations is shown in Fig. 6a–d. The time-averaged field enhancement for varying excitation wavelengths is shown in Supplementary Movie 2. The spectra are dominated by a broad dipole mode. In addition, several smaller peaks can be seen, which are caused by the interaction of localized modes on the surface of the sponge with the main dipole mode. This is in accordance with expectations, as outlined above. Clearly, the absorption spectra for the measured (ref) and the calculated (i = 1, …, 5) coarse-pored sponges exhibit mostly few distinct, but strong resonances, whose corresponding peaks show a small linewidth. The spectra of the fine-pored sponges on the other hand show many, but individually weaker resonances, overlapping to create some broad fluctuating contribution on top of the main dipole resonance. The main difference between both types of sponges, the fine-pored and the coarse-pored ones, is a change in the total Gaussian curvature KT by around one order of magnitude and a large increase in the specific surface area OF (see Table 1). The underlying picture of a structure in a dielectric environment suggests that different regions with certain local configuration contribute more or less independently to those spectral features which do not result from the broad main dipole mode. Following these lines of thought that different spectral features represent different local geometries suggests further that the number of local resonances and, thus, spectral features should increase with increasing surface area fraction OF and increasing curvature KT33. This can be seen in the spectra presented in Fig. 6a–d. This picture is further corroborated by studying the distribution of the electric field, shown for some sponges in Fig. 6e–h: It is evident that in the fine-pored sponges multiple spatially separated resonances are often excited at the same wavelength. The simulated field enhancement factors around the hot spots are in line with values determined experimentally using scattering type scanning near-field optical microscopy7, taking into account that experimentally measured field enhancement factors are always averaged over a small volume. Obviously, more research is needed to fully understand the nature of these strong local resonances and to relate them to the established theory of wave localization in disordered media45,46.

a, d Calculated absorption a, b and scattering c, d cross sections of reference and phase-field sponges. Shown are spectra of coarse-pored (a, c) and fine-pored (b, d) sponges. Shown in the insets of (a, d) are images of the time-averaged field enhancement distribution ∥E∥/E0 on the sponge surface where it exceeded a factor of 5, as well as ∥E∥/E0 in the surrounding volume where it exceeded a factor of 3, showing the dipole-like nature of the underlying mode. In the top-left and top-right insets, the volume plots are purposefully left out to better show the field enhancement around the excited hot spots. e–h Comparison of the time-averaged field enhancement distribution ∥E∥/E0 between reference and simulated sponges. Shown are the sponges (e) Sc,ref, (f) Sc,2, (g) Sf,ref and (h) Sf,1. The sponge itself is rendered in gray, while the field enhancement is overlaid in regions where it exceeded a factor of 5. The color bar is truncated at 50 and identical in all figures as shown on the right.
Anisotropic geometrical properties
Until now, we have implicitly assumed that the sponges are on average isotropic. However, the experimentally measured sponge is actually significantly denser near the bottom, an effect we attribute to substrate effects during formation. Furthermore, the outer shape of the sponge is not perfectly described by a half-ellipsoid. We discuss such anisotropies here in some detail because similar unintended or possibly intended anisotropic properties could be practically relevant and because they can easily be accounted for by our approach. For the sake of simplicity, we restrict ourselves to a more precise representation of the outer shape of the sponge and a one-dimensional density gradient in the Z-direction, demonstrated on the sponge Sf,2.
To more accurately reconstruct the outer shape of the sponge Sf,ref compared to a half-ellipsoid approximation or the convex hull, we utilize alpha shapes with a suitable filter radius written as 1/α47. Alpha shapes can be seen as a generalization of the concept of convex hull, which is obtained as limit α → 0. These are helpful because the outer hull of experimental sponges is frequently non-convex even on large length scales. Real sponges show, for example, larger bulges, especially in the area of the substrate.
To quantify the density gradient, we consider the areal density ϱA(z) = A(z)/Aα(z) defined as the total area A of all ligaments in an xy plane at fixed z slice divided by the area Aα of the alpha shape for the given slice, see Fig. 7(a–c). To estimate the filter radius, we proceed as follows: There are no large indentations in the upper half of the sponge and the outer shape can be well described by the convex hull. In this region, therefore, the areal density should be almost identical using the convex hull and the alpha shape. Thus, the filter radius is selected manually or automatically to be as small as possible to replicate the outer shape accurately in the lower half while still keeping the deviations between the areal densities calculated using the convex hull and the alpha shape small. Obviously, for constant threshold values ϕT,1,2, a roughly constant areal density ϱA(z) is expected, as confirmed in Fig. 7d. The monotonous dependence of ϱA on ϕT,1 is easily inverted numerically (see Supplementary Methods 2.2 and Supplementary Fig. 6), i.e., for any known areal-density profile, we can directly calculate the required values of ϕT,1(z) to achieve the desired areal density in the simulation as well. By combining the thereby acquired ϕT,1(z)-profile with a suitable description of the outer shape, e.g., through the use of alpha shapes, anisotropic and complex shaped sponges can be obtained. This procedure is in principle suitable to reproduce all slowly varying three-dimensional density distributions and outer shapes. An example of a resulting anisotropic sponge generated in this way is shown in Fig. 7f. The areal density and the outer shape of the sponge generated this way agree very well with the areal density and the outer shape of the measured reference sponge, i.e., the experimentally observed anisotropy is replicated in the computer-generated sponge as good as it can be expected for a random structure.

a–c Plot of section planes through different sponges; a reference sponge Sf,ref; b simulated anisotropic sponge Sf,A; c simulated isotropic sponge Sf,2; d Plot of the areal density as a function of the slice position along the Z-axis for the different types of sponges. The areal density is defined as the total area of all ligaments divided by the area of the convex hull for the given slice. It is evident that both Sf,ref and Sf,A are significantly thicker at the bottom compared to Sf,2. e, f View from the top and bottom of the different sponges; e reference sponge Sf,ref; f anisotropic sponge Sf,A; g isotropic sponge Sf,2.
Discussion
The presented method has achieved 3D models of the real structure of nanoporous gold nanoparticles with a large variation of feature sizes by reconstruction from SEM images captured in a FIB nanotomography process. Based on these, nanoporous sponge geometries that agree very well with experimental sponges on certain characteristics can be efficiently computationally generated. Previous geometry creation methods were unable to accurately produce local geometries similar to the experimental sponges. In this work, interesting optical properties that depend strongly on these local geometries, such as the strong localization and the associated field enhancement in hot spots, are correctly reproduced. As the exact dependence of these properties on the local geometrical properties is not yet known, quantification of these specific local properties remains elusive. The excellent agreement between the properties of the sponges generated by the phase-field method and the experimental sponges, however, strongly suggests that the presented method accurately creates local geometries as they appear in experimental sponges. We have shown then that sponges created using the developed method, apart from matching global properties, also show matching local geometries.
Experimentally, with a nominal voxel size of around 3 nm in Z-direction, small feature sizes in the range of 10 nm are a challenge for the 3D structure analysis by FIB nanotomography and approach the resolution limits of that technique according to the sampling theorem48. However, more important than the nominal voxel size given by the image resolution and slice thickness is the real resolution which is limited by the quality and stability of the electron and the ion beam and the interaction volume determined by the electron landing energy and the material. Together, this determines the signal escape area. One simple indication of the resolution in the XY-plane is the image quality of the Pt protection layer: The spherical Pt grains with sizes around 5 nm are clearly separated from the C-rich matrix as can be seen, e.g., in Fig. 1d. Another way to estimate the SE emission region are Monte Carlo simulations of the electron material interactions. These were made with the software Casino 3.349 for a 3 kV electron beam hitting a Au surface. As it is not possible to directly evaluate the SE radial distribution, a square hole mask was applied on top to take only the electrons escaping through the hole into account. By varying the square hole size it is possible to get information about the radial distribution of the SE signal, although a square shaped mask was used instead of a circular one to keep the model simple. The resulting distribution with its strongest SE contrast within 2 nm around the beam center and details of the model are presented in Supplementary Methods 1.1–1.2. For a precise reconstruction, an exact knowledge of the slicing thickness is necessary. For the Z-resolution of the image stack, the properties of the ion beam and the control of its XY-shift are the most important factors. Mainly it is determined by the increment of the forward shift with each slice which must be well controllable and stable during the complete slicing and imaging procedure. The Ga+ ion column of the used cross-beam system (Auriga 60 by Zeiss with a Cobra Ga+ ion column) is specified with an image resolution of down to 2.5 nm which is valid for the smallest beam current (1 pA), but must also be supported by the scan generator. For the ion beam current of 20 pA which was used to slice the Au nanosponges the standard increment is 6.5 nm which requires a beam diameter larger than that to remove a continuous volume, but also thinner slices can be removed by decreasing the increment as long as the increment is supported by the capabilities of the scan generator, the positional stability during the removal of one slice and the milling depth is large enough. This is done by setting it to 2 nm and then corrected by tracking image features which results in an average slope of around 3.15 nm per slice. Small deviations from a perfectly flat image plane can be caused by the non-rectangular ion beam profile, but it should be the same for all slices and small over the short particle height and cannot easily be corrected. Other artifacts such as irregular surface erosion or material redeposition are reduced by the application of a local protection layer and a milling depth (in image Y-direction) significantly larger than the particle height. The slight curvature of the correction curve (see Supplementary Fig. 2) suggests some intermediate instabilities in the increment over the slicing and imaging time. Future work could further develop the correction method by performing the reconstruction using individual slice thicknesses. Important work in this direction has already been done by Mangipudi et al.22, but their method has only been applied to bulk materials and is not directly applicable to our finite-size particles. Overall, the impact of the aforementioned deviations caused by the limited resolution of SEM images on the investigated descriptors volume fraction, specific area fraction and total Gaussian curvature or Euler characteristic can be expected to be low; see Supplementary Methods 1.2–1.3 for more details.
Negative influences on the image quality can also originate from the reconstruction process which is affected by smooth contrast transitions and the shine-through effect. Additional depth information to make a correction for the latter could be gained by capturing and deconvolving SEM images with multiple landing energies50 for the cost of more unstable beam conditions and longer imaging times. Both could be improved by filling the gold nanosponge with a lighter element which would also sharpen the contrast transitions.
To investigate properties on an even smaller length scale, such as facetting of ligament surfaces, the reconstruction process using SEM images is not sufficient, especially for the fine-pored particles where the number of voxels per feature size is comparatively low. In order to capture those details, TEM tomography could be used. In that case, by using Discrete Tomography for the reconstruction from projections from various tilt angles instead of image slices of the 3D volume, it could be taken advantage of the fact that only two phases are present in the sample which allows a high quality reconstruction from only few projections51,52. In turn, better statistical considerations could be enabled as the number of investigated sample sponges increases for the same experimental effort compared to conventional TEM tomography. E.g., an improved reconstruction of a gold nanoparticle from only 15 projections was presented by Batenburg et al.53, however the higher complexity of porous materials must be taken into account. But also for the discretisation of the 2D images it has potential for improvement and reduction of the user bias by reconstructing binary images from calculated projections of the grayscale images. These possibilities have to be considered in future work.
Indeed, it is sometimes observed that experimental sponges exhibit certain well-defined crystal facets. This can be accounted for by adding an anisotropic term in Eq. (1)54. This is another advantage of being able to realistically simulate nanosponges: Starting with a smooth simulated nanosponge representing, e.g., a FIB tomography well, anisotropic terms can be added to Eq. (1) and in a third step the possible presence of facets can be studied.
Conclusions
In summary, the presented method is able to computationally generate sponge geometries that show excellent agreement in both the global and the local properties that determine the optical properties, which are the main focus of the current research in this field.
Future work on the presented method with possibly added anisotropic terms54,55,56 could evaluate and compare other morphological properties of experimental and computational sponges such as the occurrence of certain well-defined crystal facets.
The presented method is easy to use and highly adaptable. For this reason, we expect the method to play a key role in the further investigation of the functional properties of the sponges. We believe two research directions are particularly intriguing: On the one hand, one can define ideal optical properties, which will depend on the particular applications aimed at, and numerically optimize the morphological parameters of the nanosponges within the phase-field approach. In a next step, one would then adjust the process parameters for the nanoparticle synthesis until these show the desired geometrical properties that can be accessed and tuned experimentally. On the other hand, one can transfer the present approach to other quantities such as the catalytic activity. For this research direction, the surface fraction of high-index facets is expected to be an important morphological parameter besides those listed in Table 1.
Methods
Sample preparation
Nanoporous gold nanoparticles are fabricated by alloying, dewetting, and dealloying of a thin Au/Ag bilayer film. First, a bilayer of Au and Ag is deposited onto a Si substrate with a SiO2 diffusion barrier by electron beam evaporation with thicknesses of 10 nm and 20 nm, respectively. In a subsequent annealing step at 900 ∘C in an Ar atmosphere for 15 min, a Au/Ag alloy is formed and the closed film transforms into solid nanoparticles by solid-state dewetting. By submerging the sample in HNO3, the Ag fraction is removed and the nanoporous structure with fine feature sizes of approximately 10 nm is created. Pore and ligament sizes can be further adjusted in a coarsening process which is done by a short low-temperature annealing. Particles referred to in this work as coarse-pored were annealed for 1 min at 300 ∘C in vacuum. This increases the ligament diameters from (12–15) nm to around (22–34) nm (measured manually in cross-section images for 70 and 35 ligaments in the three main directions for a fine- and a coarse-pored particle, respectively). The sample fabrication procedure is described in more detail in refs. 57,58.
FIB slicing and imaging
One particle from each class, the coarse- and fine-pored particles, is chosen for 3D reconstruction by FIB/SEM tomography. The slicing and imaging is done using a FIB/SEM crossbeam Auriga 60 by Zeiss. Before the milling process, a protection layer of either C/Pt or Cr/Pt is applied to the sample. Then, a trench is milled in front of the particle under investigation. For serial sectioning, the distance between two slices is set to be 2 nm, whereas the actual distance is approximately 1.5 times larger. In Table 2, the resulting corrected voxel dimensions of the as-captured images are listed. Other experimental details of data acquisition by FIB milling and SEM imaging can be found in Supplementary Methods 1.1–1.3.
Reconstruction
The individual steps of the reconstruction are described in detail in the following.
Slice spacing
The ion beam increment of 2 nm that is set for the milling defines the slice thickness. These dimensions are close to the lower limit of the device’s capabilities, which can lead to significant deviations between the intended and the actual slice thickness. A corrected slice thickness can be obtained by tracking image features in slicing direction in a stack of laterally aligned images. This is done using different features for the coarse- and the fine-pored particle resulting in a corrected slice thickness of 3.18 nm (coarse-pored) and 3.15 nm (fine-pored), respectively. The procedure is described in more detail in Supplementary Methods 1.2.
Alignment
The alignment or registration procedure is different for the coarse- and the fine-pored particle. In the case of the coarse-pored particle, ESB (in-lens energy selective backscattered electron detector) images are used to align the images in X- and Y-directions with milled trenches perpendicular to the image plane. Subsequently, the same translation vectors are applied to the in-lens secondary electron detector images, which have the contrast that is needed for segmentation. The Fiji plug-in Template Matching is used for the alignments59,60. In contrast for the fine-pored sponge, the accuracy of a simple template matching is not sufficient due to the lower ratio of feature sizes to pixel dimensions. Thus, for the final alignment, a manual shifting of the image slices is added with the help of a RGB color channel overlay visualization with the Fiji plugin TrakEM261. Finally, the image stacks are cropped to a volume that includes only the investigated sponges.
Segmentation
The image segmentation into a Au and a pore phase is done with an easy-to-implement grayscale threshold after a median filter with a radius of two voxels has been applied for noise reduction. This step is one of the most critical parts of the reconstruction procedure as the selection of the threshold value can have a strong influence on the resulting volume fractions and other geometric parameters by shifting the phase boundaries locally and globally. For the coarse-pored sponge, the influence is relatively weak because of the large ratio between feature sizes, such as ligament diameters, and voxel dimensions. In this case, the voxel sizes and a suitable grayscale threshold can easily be chosen. In the fine-pored sponge, there are ligament structures with a minimum size of only 5 to 7 voxels diameter which increases the sensitivity of geometric characteristics to slight changes of the selected grayscale threshold. Thus, a suitable parameter has to be found to evaluate the threshold selection. In this case, a unique separation via thresholding from the grayscale histogram is not possible due to the smooth contrast transition from the Au to the air phase and due to the so called shine-through effect. The latter causes ligaments in background planes to have intensities between the empty background and the wanted Au in the current image plane that can partly overlap with the decreasing intensity at Au/pore interfaces in the image plane.
As an alternative, several skeleton properties62,63 were calculated as a function of the grayscale threshold and a threshold corresponding to a characteristic transition range is chosen. A more detailed description as well as graphed skeleton properties are presented in Supplementary Methods 1.3.
Smoothing and filtering of 3D data
After reconstruction, the 3D models still have slicing artifacts such as slicing steps which would disturb the later extraction of morphological parameters, such as local curvatures. Thus, a smoothing operation is required that conserves as well as possible particle properties such as phase volume fractions, the total volume, or the number of pores and ligaments. In this work, the smoothing of voxel data is done in three steps: First, the voxel resolution is increased by a factor of 5 without interpolation. Then, a 3D Gauss blur is applied with the standard deviation chosen so that the FWHM of the filter kernel corresponds to the slicing distance which creates again a grayscale transition between the two phases. The binary and smoothed image stacks are then achieved with a grayscale threshold of 127 corresponding to 50 % of the 8 bit grayscale depth. Supplementary Table 1 and Supplementary Methods 1.4 shows how the determined morphological properties are influenced by the preceding smoothing procedure and Supplementary Figure 4 gives an optical impression of the smoothing effect.
3D data representation
A meshed 3D model representation is needed for the visualization, the subsequent optical simulations, and the morphological characterization. The Fiji 3D viewer is used here to convert voxel data to a mesh representation in the STL file format after re-sampling the smoothed data with a factor of two to achieve a model with a manageable file size64. All further steps are then carried out on the mesh representation. Possible conversion artifacts are discussed in Supplementary Methods 1.5 and a comparison of the morphological signatures is shown in Supplementary Table 2. Typical resulting 3D-rendered images of the measured particles are presented in Fig. 3e and g.
Extraction of global morphological signatures and local curvatures
The global morphological parameters were extracted from triangulations of both computer-generated and experimentally measured sponge geometries in MATLAB using the relations described in section 2. The extraction of local curvatures is more complicated, as triangulations consist of linear surfaces. Discrete differential geometry operators as developed by Meyer et. al43 were implemented in MATLAB. In this formulation, the mean and the Gaussian curvature H and K are evaluated on the vertices of the triangulation and the principal curvatures κ1 and κ2 are calculated from these according to:
with Δ = H2 − K. The used calculation method is described in detail in ref. 43 and only aspects in which we differ from Meyer et al. are mentioned here. Values on vertices where rare numerical artifacts result in Δ < 0 are removed instead of being set to 0. ref. 43 also does not specify how to evaluate the sign of the mean curvature. In the present work, the following sign convention is used:
where \(\overrightarrow{H}\) is the mean curvature vector, \(\overrightarrow{n}\) is the approximated vertex normal and sgn(x) is the signum function. The vertex normals are calculated by averaging the normal vectors of the adjacent triangles, weighted by the distance of the incenters to the respective vertex. Due to the curvature only being evaluated in the vertices, histograms depend strongly on sampling density, i.e. how the vertices of the triangulation are distributed. The triangulations used in this work are meshed satisfyingly fine and evenly, however.
Phase-field simulations
The phase-field simulations are carried out in a block-shaped spatial region. For the first simulation step, the phase-field function is initialized on small cubes that fill the block-shaped simulation domain. Each cuboid region is randomly assigned a value of the phase-field function of either−1 or 1. Before time stepping, the phase-field initialization study step is carried out in COMSOL, which smoothes out the otherwise numerically challenging sharp transitions in the phase-field function between neighbouring cubes. To initialize the second simulation step, the procedure described in Fig. 3a is applied. The necessary shape to be cut out is determined from the equivalent ellipsoids of the experimentally measured sponges. Further details, including the parameters, are available in Supplementary Methods 2.1.
For the generation of the anisotropic sponge, first, a suitable alpha shape of the reference sponge Sf,ref is created, using a filter radius of 25 nm. Then, both the alpha shape and the sponge are sliced into many XY-slices and the filling fraction of each slice ρA(z) = A(z)/Aα(z) is determined. Then, the volume fraction of gold inside the entire rectangular domain at time t1 is obtained for various values of the first threshold parameter ϕT,1 and the resulting monotonous nonlinear relation Vf(ϕT,1) is fit using a suitable function (see Supplementary Methods 2.2 and Supplementary Fig. 6). Using the approximation ρA(ϕT,1) = Vf (ϕT,1), we can thus derive the relation ϕT,1(ρA) and finally obtain ϕT,1(z). The most relevant change for the anisotropic case compared to section 2 lies in changing the initialization of the second phase-field step from relying on an isotropic threshold value to a position-dependent value, as well as substituting the simple half-ellipsoid to be cut out with the more complex alpha shape.
Optical simulations
For the optical simulations, the sponge is placed centrally within a block-shaped air region. To minimize numerical errors, the block is chosen large enough so that at least three wavelengths fit completely inside the block. The air block is completely surrounded by perfectly matched layers (PML’s). As parametrization of the optical properties of gold, the data of Johnson and Christy65 are used. The absorption and scattering cross sections are calculated using the absorbed energy density and the Poynting vector, respectively. Further details are available in Supplementary Methods 2.3.
Data availability
The raw data required to reproduce these findings, the processed 3D voxel data, and animated images of the phase field and the optical simulations are available to download from: https://doi.org/10.5281/zenodo.639455166. All other data supporting the findings of this study are available from the corresponding author upon reasonable request.
Code availability
The software and code developed for this research, i.e. code for handling of triangulations, importing triangulations accurately into COMSOL Multiphysics, evaluating the geometric properties presented in Table 1 and Fig. 4 and for creating the anisotropic sponge are available under the following repository: https://zenodo.org/record/747327567.
References
Fujita, T. et al. Atomic origins of the high catalytic activity of nanoporous gold. Nat. Mater. 11, 775–780 (2012).
Zugic, B. et al. Dynamic restructuring drives catalytic activity on nanoporous gold-silver alloy catalysts. Nat. Mater. 16, 558–564 (2017).
Daggumati, P., Matharu, Z. & Seker, E. Effect of nanoporous gold thin film morphology on electrochemical DNA sensing. Anal. Chem. 87, 8149–8156 (2015).
Yoo, S.-H. & Park, S. Platinum-coated, nanoporous gold nanorod arrays: Synthesis and characterization. Adv. Mater. 19, 1612–1615 (2007).
Zheng, T. et al. Gold-nanosponge-based multistimuli-responsive drug vehicles for targeted chemo-photothermal therapy. Adv. Mater. 28, 8218–8226 (2016).
Zhang, L. et al. Large enhancement of quantum dot fluorescence by highly scalable nanoporous gold. Adv. Mater. 26, 1289–1294 (2014).
Zhong, J. et al. Strong Spatial and Spectral Localization of Surface Plasmons in Individual Randomly Disordered Gold Nanosponges. Nano Lett. 18, 4957–4964 (2018).
Zhong, J. H. et al. Nonlinear plasmon-exciton coupling enhances sum-frequency generation from a hybrid metal/semiconductor nanostructure. Nat. Commun. 11, 1–10 (2020).
Yi, J.-M. et al. Doubly resonant plasmonic hot spot-exciton coupling enhances second harmonic generation from Au/ZnO hybrid porous nanosponges. ACS Photonics. 6, 2779–2787 (2019).
Hergert, G. et al. Long-lived electron emission reveals localized plasmon modes in disordered nanosponge antennas. Light Sci. Appl. 6, e17075 (2017).
Farkas, D., Caro, A., Bringa, E. & Crowson, D. Mechanical response of nanoporous gold. Acta Mater. 61, 3249–3256 (2013).
Griffiths, E., Bargmann, S. & Reddy, B. Elastic behaviour at the nanoscale of innovative composites of nanoporous gold and polymer. Extreme Mech. Lett. 17, 16–23 (2017).
Odermatt, A., Richert, C. & Huber, N. Prediction of elastic-plastic deformation of nanoporous metals by FEM beam modeling: A bottom-up approach from ligaments to real microstructures. Mater. Sci. Eng. A. 791, 139700 (2020).
Fujita, T., Qian, L.-H., Inoke, K., Erlebacher, J. & Chen, M.-W. Three-dimensional morphology of nanoporous gold. Appl. Phys. Lett. 92, 251902 (2008).
chen Karen Chen, Y. et al. Morphological and topological analysis of coarsened nanoporous gold by x-ray nanotomography. Appl. Phys. Lett. 96, 043122 (2010).
Zhao, C. et al. Design nanoporous metal thin films via solid state interfacial dealloying. Nanoscale 13, 17725–17736 (2021).
Pfeiffer, B. et al. Characterization of nanoporous materials with atom probe tomography. Microsc. Microanal. 21, 557–563 (2015).
El-Zoka, A., Langelier, B., Botton, G. & Newman, R. Enhanced analysis of nanoporous gold by atom probe tomography. Mater. Charact. 128, 269–277 (2017).
Ebrahimy, A. F., Langelier, B. & Newman, R. C. Atom probe tomography of nanoporous gold formed by dealloying lean noble alloys. Mater. Today Comm. 25, 101371 (2020).
Hu, K., Ziehmer, M., Wang, K. & Lilleodden, E. T. Nanoporous gold: 3D structural analyses of representative volumes and their implications on scaling relations of mechanical behaviour. Philos. Mag. 96, 3322–3335 (2016).
Jeon, H. et al. Self-similarity in the structure of coarsened nanoporous gold. Scripta Mater. 137, 46–49 (2017).
Mangipudi, K., Radisch, V., Holzer, L. & Volkert, C. A FIB-nanotomography method for accurate 3D reconstruction of open nanoporous structures. Ultramicroscopy 163, 38–47 (2016).
Wu, H., Roberts, S., Möbus, G. & Inkson, B. Subsurface damage analysis by TEM and 3d FIB crack mapping in alumina and alumina/5vol.%SiC nanocomposites. Acta Materialia. 51, 149–163 (2003).
Holzer, L., Indutnyi, F., Gasser, P., Munch, B. & Wegmann, M. Three-dimensional analysis of porous BaTiO3 ceramics using FIB nanotomography. J. Microscopy 216, 84–95 (2004).
Soyarslan, C., Bargmann, S., Pradas, M. & Weissmüller, J. 3D stochastic bicontinuous microstructures: Generation, topology and elasticity. Acta Mater. 149, 326–340 (2018).
Zinchenko, O., de Raedt, H. A., Detsi, E., Onck, P. R. & de Hosson, J. Nanoporous gold formation by dealloying: A Metropolis Monte Carlo study. Comput. Phys. Commun. 184, 1562–1569 (2013).
Erlebacher, J., Aziz, M. J., Karma, A., Dimitrov, N. & Sieradzki, K. Evolution of nanoporosity in dealloying. Nature 410, 450–453 (2001).
Cahn, J. W. & Hilliard, J. E. Free energy of a nonuniform system. I. Interfacial energy. J. Chem. Phys. 28, 258–267 (1958).
Chen, L. Q. Phase-field models for microstructure evolution. Annu. Rev. Mater. Sci. 32, 113–140 (2002).
Sun, X.-Y., Xu, G.-K., Li, X., Feng, X.-Q. & Gao, H. Mechanical properties and scaling laws of nanoporous gold. J. Appl. Phys. 113, 023505 (2013).
Vidal, C., Wang, D., Schaaf, P., Hrelescu, C. & Klar, T. A. Optical plasmons of individual gold nanosponges. ACS Photonics. 2, 1436–1442 (2015).
Vidal, C. et al. Plasmonic horizon in gold nanosponges. Nano Lett. 18, 1269–1273 (2018).
Schwarz, F. & Runge, E. Towards optimal disorder in gold nanosponges for long-lived localized plasmonic modes. Ann. Phys. (Berl.) 529, 1600234 (2017).
Yan, Y. et al. Mesoscopically bi-continuous ag-au hybrid nanosponges with tunable plasmon resonances as bottom-up substrates for surface-enhanced Raman spectroscopy. Chem. Mater. 28, 7673–7682 (2016).
Zhang, Q., Large, N., Nordlander, P. & Wang, H. Porous au nanoparticles with tunable plasmon resonances and intense field enhancements for single-particle sers. J. Phys. Chem. Lett. 5, 370–374 (2014).
Bohm, S. et al. Optical properties of nanoporous gold sponges using model structures obtained from three-dimensional phase-field simulation. In 2021 Photonics Electromagnetics Research Symposium (PIERS), 517-523 (2021).
Yue, P., Feng, J. J., Liu, C. & Shen, J. A diffuse-interface method for simulating two-phase flows of complex fluids. J. Fluid Mech. 515, 293–317 (2004).
COMSOL AB. Comsol multiphysics® v. 5.6, stockholm, sweden, (2022.01.23). https://www.comsol.com/.
Carmo, M. P. D. Differential Geometry of Curves and Surfaces. (Prentice-Hall, Englewood Cliffs, N.J., 1976).
Lilleodden, E. T. & Voorhees, P. W. On the topological, morphological, and microstructural characterization of nanoporous metals. MRS Bull. 43, 20–26 (2018).
chen Karen Chen-Wiegart, Y. et al. Structural evolution of nanoporous gold during thermal coarsening. Acta Mater. 60, 4972–4981 (2012).
Ziehmer, M., Hu, K., Wang, K. & Lilleodden, E. T. A principle curvatures analysis of the isothermal evolution of nanoporous gold: Quantifying the characteristic length-scales. Acta Mater. 120, 24–31 (2016).
Meyer, M., Desbrun, M., Schröder, P. & Barr, A. H. Discrete Differential-Geometry Operators for Triangulated 2-Manifolds. In Hege, H. & Poltier, K. (eds.) Visualization and Mathematics III. Mathematics and Visualization (Springer, Berlin, Heidelberg, 2003).
Bohren, C. F. & Huffman, D. R. Absorption and Scattering of Light by Small Particles. (Wiley, New York, 1998).
Sheng, P. Scattering and Localization of Classical Waves in Random Media. (World Scientific, Singapore, 1990).
Abrahams, E. 50 Years of Anderson Localization. (World Scientific, Singapore, 2010).
Edelsbrunner, H., Kirkpatrick, D. & Seidel, R. On the shape of a set of points in the plane. IEEE Transactions on Information Theory 29, 551–559 (1983).
Lattices, adjacency of lattice points, and images. In Images of Materials Structures, 43-77 (Wiley-VCH Verlag, 2010).
Drouin, D. et al. CASINO v2.42—a fast and easy-to-use modeling tool for scanning electron microscopy and microanalysis users. Scanning 29, 92–101 (2007).
de Goede, M., Johlin, E., Sciacca, B., Boughorbel, F. & Garnett, E. C. 3d multi-energy deconvolution electron microscopy. Nanoscale 9, 684–689 (2017).
van Aarle, W., Batenburg, K. J. & Sijbers, J. Automatic parameter estimation for the discrete algebraic reconstruction technique (DART). IEEE Transactions on Image Process. 21, 4608–4621 (2012).
Batenburg, K. J. & Sijbers, J. DART: A practical reconstruction algorithm for discrete tomography. IEEE Transactions on Image Process. 20, 2542–2553 (2011).
Batenburg, K. et al. 3d imaging of nanomaterials by discrete tomography. Ultramicroscopy 109, 730–740 (2009).
Tschukin, O. et al. Concepts of modeling surface energy anisotropy in phase-field approaches. Geotherm. Energy. 5, 19 (2017).
Demange, G., Zapolsky, H., Patte, R. & Brunel, M. A phase field model for snow crystal growth in three dimensions. npj Computational Materials3 (2017). https://doi.org/10.1038/s41524-017-0015-1.
Prajapati, N., Späth, M., Knecht, L., Selzer, M. & Nestler, B. Quantitative phase-field modeling of faceted crystal dissolution processes. Crystal Growth Design. 21, 3266–3279 (2021).
Wang, D. & Schaaf, P. Nanoporous gold nanoparticles. J. Mater. Chem. 22, 5344–5348 (2012).
Kosinova, A. et al. Fabrication of hollow gold nanoparticles by dewetting, dealloying and coarsening. Acta Mater. 102, 108–115 (2015).
Schindelin, J. et al. Fiji: an open-source platform for biological-image analysis. Nat. Methods. 9, 676–682 (2012).
Tseng, Q. Template matching and slice alignment (2022.02.11). https://sites.google.com/site/qingzongtseng/template-matching-ij-plugin.
Cardona, A. et al. TrakEM2 software for neural circuit reconstruction. PLoS ONE. 7, e38011 (2012).
Lee, T., Kashyap, R. & Chu, C. Building skeleton models via 3-d medial surface axis thinning algorithms. CVGIP: Graph. Model. Im. Pro. 56, 462–478 (1994).
Carreras, I. Skeletonize3D v. 2.1.1 (2022.02.08). https://github.com/fiji/Skeletonize3D/.
Schmid, B., Schindelin, J., Cardona, A., Longair, M. & Heisenberg, M. A high-level 3D visualization API for Java and ImageJ. BMC Bioinform.11 (2010).
Johnson, P. & Christy, R. Optical constants of the noble metals. Phys. Rev. Lett. 6, 4370 (1972).
Honig, H. et al. Dataset: Structural and optical properties of gold nanosponges revealed via nano-reconstruction and phase-field models. Zenodo (2022). https://doi.org/10.5281/zenodo.6394551.
Bohm, S. sebo0549/geometry_and_mesh_functions_nanosponges (2022). https://zenodo.org/record/7473275.
Acknowledgements
This work is supported by the Deutsche Forschungsgemeinschaft (DFG grants LI 580/12, RU 1383/5, and SCHA 632/24 within the SPP1839 ‘Tailored Disorder’). The support by the Center of Micro- and Nanotechnologies (ZMN), a DFG funded core facility of TU Ilmenau, and the University Computing Center of TU Ilmenau is gratefully acknowledged.
Funding
Open Access funding enabled and organized by Projekt DEAL.
Author information
Authors and Affiliations
Contributions
M.G., S.B., E.R., P.S., and C.L. designed the research project. M.G. and S.B. performed the phase-field and optical simulations, E.R. and C.L. supported their interpretation. H.H. and D.W. performed and analyzed the FIB tomography measurements and developed the analysis protocol. S.B. and M.G. wrote the used MATLAB code. E.R. and P.S. jointly supervised the research. All authors jointly wrote and reviewed the manuscript.
Corresponding author
Ethics declarations
Competing interests
The authors declare no competing interests.
Peer review
Peer review information
Communications Materials thanks the anonymous reviewers for their contribution to the peer review of this work. Primary Handling Editors: Jet-Sing Lee and Aldo Isidori. Peer reviewer reports are available.
Additional information
Publisher’s note Springer Nature remains neutral with regard to jurisdictional claims in published maps and institutional affiliations.
Rights and permissions
Open Access This article is licensed under a Creative Commons Attribution 4.0 International License, which permits use, sharing, adaptation, distribution and reproduction in any medium or format, as long as you give appropriate credit to the original author(s) and the source, provide a link to the Creative Commons license, and indicate if changes were made. The images or other third party material in this article are included in the article’s Creative Commons license, unless indicated otherwise in a credit line to the material. If material is not included in the article’s Creative Commons license and your intended use is not permitted by statutory regulation or exceeds the permitted use, you will need to obtain permission directly from the copyright holder. To view a copy of this license, visit http://creativecommons.org/licenses/by/4.0/.
About this article

Cite this article
Grunert, M., Bohm, S., Honig, H. et al. Structural and optical properties of gold nanosponges revealed via 3D nano-reconstruction and phase-field models. Commun Mater 4, 20 (2023). https://doi.org/10.1038/s43246-023-00346-7
Received:
Accepted:
Published:
DOI: https://doi.org/10.1038/s43246-023-00346-7
