
Abstract
Quaternary climatic changes have been invoked as important drivers of species diversification worldwide. However, the impact of such changes on vegetation and animal population dynamics in tropical regions remains debated. To overcome this uncertainty, we integrated high-resolution paleoenvironmental reconstructions from a sedimentary record covering the past 25,000 years with demographic inferences of a forest-dwelling primate species (Microcebus arnholdi), in northern Madagascar. Result comparisons suggest that climate changes through the African Humid Period (15.2 – 5.5 kyr) strongly affected the demographic dynamics of M. arnholdi. We further inferred a population decline in the last millennium which was likely shaped by the combination of climatic and anthropogenic impacts. Our findings demonstrate that population fluctuations in Malagasy wildlife were substantial prior to a significant human impact. This provides a critical knowledge of climatically driven, environmental and ecological changes in the past, which is essential to better understand the dynamics and resilience of current biodiversity.
Introduction
Past climate changes have often been invoked as important drivers of population demographic dynamics, species distribution, and genomic diversity patterns, as species directly respond to environmental changes and to changes in resource availability1. Mainly studied in temperate regions2,3,4,5, such dynamics remain much less explored and more debated in the tropics6,7, which are characterized by a very high biodiversity richness. Among tropical regions, Madagascar, with its long history of isolation, high rates of endemism8,9, and no significant human impact until the late Holocene10, is a key model area to understand how natural climate changes impacted evolutionary trajectories. Past climate fluctuations have been proposed as one of the main drivers of species diversification on the island, for example in lemurs, amphibians, or reptiles11,12,13,14. Mouse lemurs (Microcebus spp.) are the world’s smallest extant primates and form a speciose genus among lemurs with 25 currently recognized species15. They represent a suitable model system to investigate the impact of past environmental changes on demographic dynamics because (i) they are forest-dependent and should therefore be strongly influenced by vegetation changes; (ii) they have a comparably short generation time and a high reproductive rate, thereby quickly accumulating genetic signatures of past demographic events; and (iii) populations are still large enough and may have preserved enough genetic diversity to accurately reconstruct their demographic history11,16,17. A wide range of molecular approaches have been recently developed to infer species demographic history using genomic data18,19,20,21,22,23. However, interpretations are challenging, given the overall lack of historic population data and the scarcity of paleoenvironmental reconstructions. In particular, the evaluation of realistic demographic scenarios (e.g., combining population size and population structure) requires information about past habitat fluctuations that can only be provided by local paleoenvironmental reconstructions.
To investigate how past environmental changes shaped current biodiversity in a tropical rainforest ecosystem, we combined high-resolution paleoenvironmental reconstructions and demographic modeling of mouse lemur genomics data generated for the same study area, Montagne d’Ambre National Park (NP, Fig. 1a). Located in northern Madagascar, this NP fulfills two essential prerequisites: (i) mouse lemurs are known to occur in the evergreen humid forest of this NP24 and (ii) this NP hosts volcanic (maar) lakes. Such maar lakes are well known as ideally suited archives as they continuously accumulate sediments, which serve as natural recorders of local and regional environmental and climate dynamics. Since the maar lakes in Montagne d’Ambre are at least of Neogene or Quaternary age, their deposits are assumed to reflect changes in the climatic and environmental conditions during critical periods such as the Pleistocene–Holocene transition. This transition led to abrupt climate and vegetation changes in mainland Africa through the so-called African Humid Period (AHP)25,26. Using genome-wide data, four complementary demographic approaches (Stairway Plot, PSMC, IICR simulations, and fastsimcoal2) were used to infer past population size and connectivity changes of Microcebus arnholdi in two parts of the NP, about 18 km from each other. Specifically, mouse lemur dynamics were studied in the northern part of the NP inside the evergreen humid forest (Mahasarika, 1073 m asl, Fig. 1a) and in the southern part of the NP along the forest-grassland ecotone (Fantany, 848 m asl, Fig. 1a). The inferred demographic dynamics were then compared and integrated with paleoenvironmental reconstructions that were derived from a continuous sediment record from Lac Maudit, located at the center of the NP in the evergreen humid forest (1250 m asl Fig. 1a) and less than 6 km away from either mouse lemur site. Such a dual paleoecological–genomic approach that compares genomic inferences with predictions derived from local paleoenvironmental datasets is unique for tropical regions. Our result comparisons demonstrate that the demographic dynamics of M. arnholdi were exclusively shaped by natural climate changes until the late Holocene, whereas the dynamics during the last millennium were likely shaped by both natural climate and anthropogenic changes. Altogether, our study illuminates how natural climate fluctuations and anthropogenic activities impacted Malagasy wildlife across time and provides a critical understanding of biological responses of forest-dwelling species to ongoing and accelerating climate change.

a Location of the study area in Montagne d’Ambre, in northern Madagascar showing the northern (1073 m asl) and southern site (848 m asl) for mouse lemur sampling (red and blue circles) and the study site for lacustrine sediment coring at 1250 m asl (star). All three sites were within 18 km of each other. The white triangle represents the mountaintop. The distribution area was drawn based on resources available in the public domain Microsoft Bing Virtual Earth. Individual coordinates can be found in Supplementary Table S2. b Assignment of 38 individuals to two genetic clusters (K = 2) using genotype likelihoods. Each individual is represented by a single horizontal bar and each color represents a distinct genetic cluster. Samples are sorted by sampling site. The animals sampled in the northern and southern site were assigned to two distinct genetic clusters with low levels of admixture between the two sites.
Results and discussion
Five periods of distinct environmental conditions during the past 25 kyr
A robust chronology was established for the sedimentary record of Lac Maudit by using a set of 19 14C ages with an age-modeling approach (Supplementary section 1.2). For the environmental reconstruction, a multiproxy approach was applied, which combined palynological (and charcoal counting), granulometric and inorganic geochemical (X-ray fluorescence core scan, XRF) analyses (see Paleoenvironmental analyses in Methods). Based on pollen zones, granulometric properties as well as a Principal Component Analysis (PCA) of the XRF data, our results unveil five distinct periods of different climatic conditions associated with different plant assemblages (Fig. 2 and Supplementary section 1.1–1.4): a first period (25–15.2 kyr) with cold and dry conditions, a second and third period (15.2–11.8 and 11.8–5.5 kyr) related to increased humidity and temperature during the AHP, a fourth period (5.5–0.9 kyr) characterized by precipitation decline after the AHP, and a fifth period (>0.9 kyr) related to the increase of fire activity.
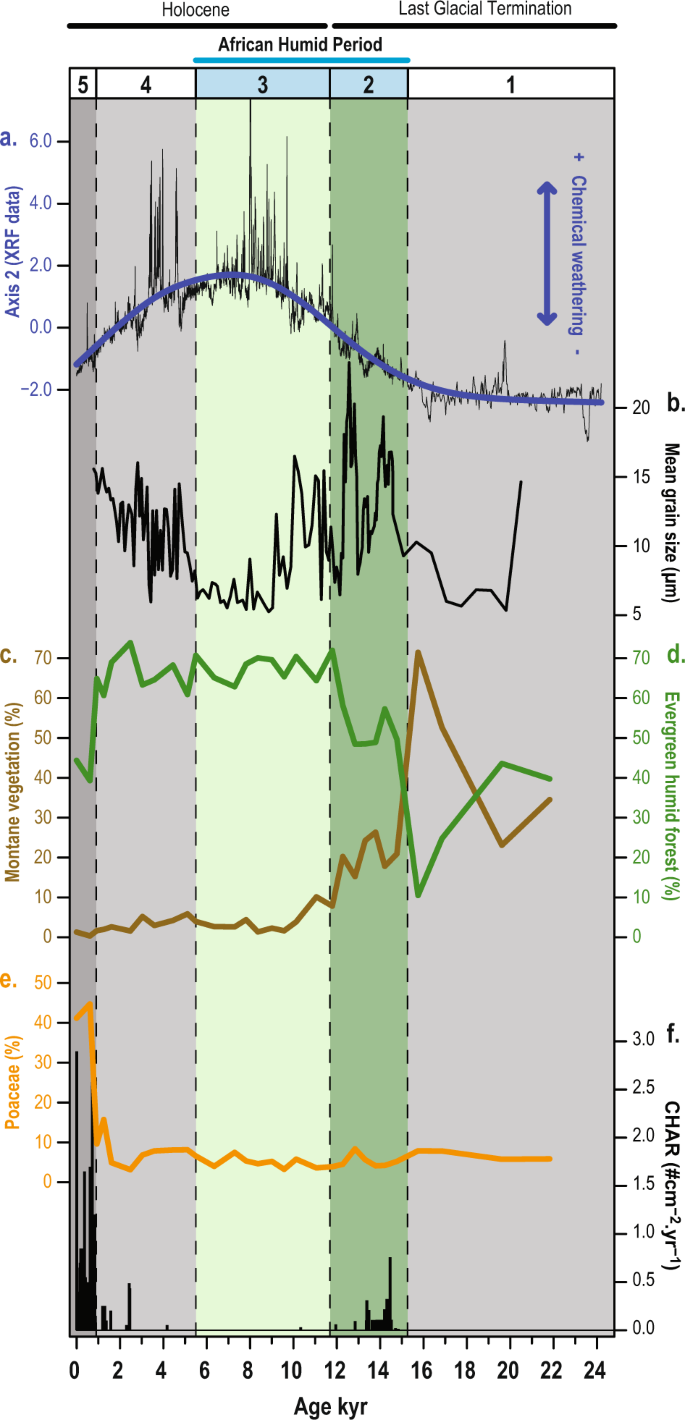
a Axis 2 of the Principal Component Analysis performed on the X-ray fluorescence (XRF) scanning record, b mean-grain size measurements, c pollen sum of specific taxa from montane vegetation (Ericaceae, Myrica, Podocarpus), d pollen sum of specific taxa from evergreen humid forest (Myrtaceae, Elaeocarpus, Macaranga-Mallotus, Acalypha, Weinmannia, Moraceae-Urticaceae, Celtis, Araliaceae, Trema, Ilex, Noronhia, and Pandanus), e Poaceae pollen grains, and f influx of charcoal particles (>160 µm). The vertical bars represent the five key periods of different paleoenvironmental conditions defined in the text.
Prior to 15.2 kyr (period 1; 25–15.2 kyr), pollen assemblages show that montane vegetation (25–70%; Fig. 2c) and evergreen humid forest (10–40%; Fig. 2d) were growing together in Montagne d’Ambre. Today, the NP (>800 m asl) harbors only evergreen humid forest up to the mountaintop (1475 m asl). The montane vegetation that grows elsewhere in northern Madagascar above 1800 m asl under lower temperature and precipitation is absent in Montagne d’Ambre (Fig. 1a and see Environmental settings in Methods). Therefore, the occurrence of montane vegetation in Montagne d’Ambre prior to 15.2 kyr suggests drier and cooler climate conditions than in modern times, similar to what was described for tropical East Africa27,28. Dry conditions at the study site are also evidenced by low sediment-accumulation rates of ca. 0.07 mm a−1 revealed by the age model (Fig. S2). Furthermore, texture and grain size show a very compact sediment with silty-to-clayey deposits (mean grain size of 7.5 µm) related to reduced precipitation and runoff amounts29 (Fig. 2b and Supplementary section 1.1). The PCA carried out with XRF data resulted in three main axes, with Axis 1 representing 61.5%, Axis 2 24.4%, and Axis 3 9.4% of the total data variance (Supplementary section 1.3). The first axis shows negative loadings for all measured elements, which is interpreted as high minerogenic input and low organic matter content consistent with dry conditions during the first period (Fig. S3). For the second axis, positive (negative) values mainly reflect increase (decrease) of iron (Fe), titanium (Ti), and nickel (Ni) that correspond to an enhanced (reduced) chemical weathering related to more (less) humid conditions and associated forest soil formation (Fig. 2a and Supplementary section 1.3). Increased siliciclastic input (high loadings for silicon (Si), calcium (Ca), and strontium (Sr); Fig. S3) into the lake prior to 15.2 ka, reflected by low values in Axis 2 (Fig. 2a), points to dry environmental conditions favoring physical weathering of bare, exposed materials (bare rock)30. Due to the dry environmental conditions, a low soil-formation rate and development of montane vegetation was favored, associated with enhanced physical weathering. During period 1, we therefore conclude that montane vegetation was present in the upper parts of Montagne d’Ambre at lower altitudes than is observed today in other regions of northern Madagascar. The evergreen humid forest also shifted to lower elevations in comparison with modern times and/or was restricted to sheltered habitats with humid local conditions in Montagne d’Ambre (e.g., valleys, rivers). However, a wide lowland expansion of this forest would be unexpected due to the rather dry conditions recorded between 25 and 15 kyr in tropical East Africa26, which were accompanied by a savanna expansion in African lowlands31.
During the second period (15.2–11.8 kyr), an increase in sediment accumulation rate by one order of magnitude (mean ca. 0.6 mm a−1; Fig. S2) along with larger, but variable mean particle sizes (6–23 µm; Fig. 2b) is pointing to higher transport energies and generally more erosive processes in the catchment. A sudden sediment color change from gray to dark-brown likely indicates higher amounts of organic matter and thus a stronger bioproductivity (Supplementary section 1.1 and Fig. S1). Increasing values in Axis 2 of the PCA show a trend toward higher portions of Fe, Ti, and Ni within the deposits (Fig. 2a and Supplementary section 1.3), which is interpreted as enhanced chemical weathering and deep soil formation. Contemporaneously, a rapid development of evergreen humid forest taxa (>50%; Fig. 2d) at the expense of montane vegetation (<25%; Fig. 2c) is observed. From these proxies, we infer a spectacular increase in moisture availability and thus enhanced precipitation in Montagne d’ Ambre. The major increase of evergreen humid forest also indicates an upward shift of the altitudinal vegetation zones and suggests a temperature increase in addition to precipitation increase. During this period, a short increase of fire events (14.5–13.5 kyr; Fig. 2f) is indicated by charcoal influx. However, the low values of charcoal influx (less than three particles per cubic-centimeter sample) do not support local fire occurrences at the catchment of the lake. Instead, this may rather suggest a development of vegetation prone to fire in the region, supported by an increase of Myrica pollen (Fig. S4). A likely increase of thunderstorms with lightning frequency and the development of suitable combustible biomass may best explain the detected episodes of wildland fires. Starting at 15.2 kyr, period 2 matches perfectly with the onset of the AHP documented in Madagascar’s central highlands32 and in East Africa26. This shows that climate changes were synchronous across this entire region.
Maximum proportions of evergreen humid forest (>60%; Fig. 2d) start at 11.8 kyr and indicate a third period (11.8–5.5 kyr) at the transition to the Holocene. From 10 to 5.5 kyr, even enhanced chemical weathering is evidenced by maximum values in Axis 2 of the PCA performed on XRF data (Fig. 2a) and rather fine-grained, dominantly silty and clayey deposits, comparable with those from period one (mean grain size ca. 7 µm), are observed (Fig. 2b). This likely points to maximum rates of precipitation within the entire record and to a quite high lake level. The latter is further supported by low abundance of aquatic plants (<5%; Fig. S4), which are generally related to shallow lake conditions. We conclude that during this period, evergreen humid forest grew on the entire mountaintop as it is observed today. In addition, the maximum rates of precipitation recorded during this period imply a lower altitudinal limit and thereby wider distribution of this forest type than today.
During the fourth period (5.5–0.9 kyr), a coarsening in the particle size (>10 µm; Fig. 2b) as well as higher abundance of aquatic plants (10–30%; Fig. S4) suggest a lake level drop, likely indicating generally drier conditions associated with reduced precipitation. A contemporaneous weakening in chemical weathering derived from lower values in Axis 2 (PCA of XRF data; Fig. 2a) is also consistent with a reduced moisture availability. These results denote the termination of the AHP and match with paleoecological data from East Africa where the termination of the AHP starts around 5 kyr26. In Montagne d’Ambre, this precipitation decrease may have led to a contraction of the evergreen humid forest by moving upward its lower altitudinal limit as also observed in East Africa33. However, with its central and higher location in Montagne d’Ambre, the lake site was probably not able to record this vegetation shift. This certainly explains why, except for a few changes in forest composition after 5.5 kyr, the evergreen humid forest surrounding the lake has not been markedly impacted by this reduction of humidity (Fig. 2d and Supplementary section 1.4).
The last ~0.9 kyr, corresponding to the fifth period, are characterized by reduced evergreen humid forest taxa (ca. 40%; Fig. 2d), although still present at Lac Maudit. This period is marked by a tremendous increase of charcoal particles reflecting an important increase in fire frequency (Fig. 2f). Combined with the high amounts of Poaceae pollen (>40%; Fig. 2e), this suggests a major vegetation change. Today, most fires occur in the surrounding lowlands (>6–7 km away) dominated by open grasslands that are strongly affected by human activities through slash-and-burn agriculture and extensive cattle grazing. While evergreen humid forest in Montagne d’Ambre prevents fire ignitions, the permanent occurrence of charcoal particles recorded since 0.9 kyr with recurrent peaks exceeding 20 particles per cubic-centimeter sample is certainly the result of an important shift of lowland ecosystems to an open grassland ecosystem associated with high fire frequency. Charcoal particles produced by these fires have been certainly carried up by aeolian transport to Lac Maudit. The high amount of Poaceae pollen, probably transported by the same process, also supports the occurrence of an open-grassland ecosystem in the lowlands. The contemporaneous development of swampy vegetation, harboring Poaceae plants, at the lake site (Supplementary section 1.4) may have also contributed to the elevated amount of Poaceae pollen. While human arrival during the early or mid-Holocene is still hotly debated for Madagascar34,35, it has been shown that humans impacted northwestern Madagascar, only a couple of hundred kilometers south of Montagne d’Ambre, significantly through a rapid transition to a grass-dominated landscape with an abrupt increase in fire activity at ~1.2 kyr36,37. Furthermore, large settlements developed from 1 kyr along the coast such as at Lakaton’i Anja located next to Montagne d’Ambre38,39. In congruence with these findings, our results suggest an important human impact on the northern landscapes at least over the last millennium.
Late quaternary lemur population dynamics
The four complementary demographic approaches implemented in this study confirm that M. arnholdi underwent substantial demographic changes during the past 25 kyr. The Stairway Plot21 and the Pairwise Sequentially Markovian Coalescent (PSMC)19 methods were consistent in inferring the occurrence of an apparent population decrease in recent times (periods 5 and 4, <5.5 kyr) in both Mahasarika and Fantany (Fig. 3a,c). This population decrease was preceded by a period of a large population size, itself preceded by a more ancient population bottleneck. While the two methods identified a similar overall trend, the temporal dynamics were different among them. The ancient population bottleneck inferred by the Stairway Plot (Fig. 3c) dated >25 kyr, whereas the PSMC method (Fig. 3a) suggested lowest population sizes at the beginning of period 1 (25–15.2 kyr). Although the methods differ in the duration of the subsequent population recovery, both methods agreed that mouse lemurs had a relatively large population size during the maximum humid conditions of the AHP (i.e., period 3, 11.8–5.5 kyr) at both sampling sites. Differences on the temporal dynamics among the two methods are not surprising, as it has been shown that PSMC performs best for ancient times, while the Stairway Plot tends to perform best toward the present40,41,42,43. However, the interpretations of the previous demographic approaches rely on the assumption that population structure can be neglected and that mating is random. In an attempt to overcome this limitation of panmictic-based interpretations of the PSMC44,45,46, we simulated the Inverse Instantaneous Coalescent Rate (IICR)47 of the southern site (Fig. 3b) by changing connectivity parameters, but assuming a constant population size. The model parameters that generated the best fit between the IICR in such a structured model and the dynamics inferred by the PSMC method suggest an n-island model of migration (29 demes interconnected by symmetrical gene flow) with four changes in connectivity. Those changes in connectivity dated around 65, 40, 10–15 and 1–2 kyr (vertical lines in Fig. 3b). More specifically, the IICR simulations suggest a period of high connectivity that started long before period 1 (~40 kyr), which was followed by a period of reduced connectivity during the AHP (~13 kyr) (see Supplementary section 2.1.9 for details about connectivity inferences). Such a scenario is unlikely, since the paleoenvironmental records revealed relatively unfavorable conditions (=lower extension of evergreen humid forest) during period 1 (25–15.2 kyr) and increasingly favorable conditions during the AHP (= maximum extension of evergreen humid forest). We therefore conclude that population size changes explain the PSMC dynamics during this time period better than changes in population connectivity (but assuming no change in population size).

a Inference of the demographic history of M. arnholdi with the PSMC method. The thick red and blue lines represent the inferred trajectories of the northern (Mahasarika) and the southern (Fantany) site. Each light line represents 100 subsampled bootstrap replicates for each individual. The legend on the top identifies the five periods of environmental change derived from the paleoenvironmental reconstructions defined in the text. b IICR inferred by the PSMC method for Fantany (blue) and IICR under an n-island model of migration considering a constant population size and four changes in population connectivity (green). Vertical red lines mark the times of change in connectivity (~65, ~40, ~10−15 and ~1–2 kyr). Horizontal bars on top in gray shades indicate relative levels of connectivity (see Supplementary section 2.1.9 and Fig. S6 for details about the connectivity inferences). c Demographic history inferred for Mahasarika (red, N = 12) and Fantany (blue, N = 26) with the Stairway Plot method. The demographic dynamics of Fantany were repeated considering an equal sample size as for Mahasarika (orange, N = 12). For reasons of direct comparison, the black line illustrates the effective population-size dynamics as suggested by the best-fitting demographic model (M7) by fastsimcoal2 over time. d Illustration of the best demographic model (M7) revealed by fastsimcoal2. The model suggests the occurrence of two consecutive population declines during the last 5 kyr. The different populations are represented by distinct colors. An additional population (“ghost population”) was included to represent intermittent M. arnholdi sampling sites that were not covered by our sampling scheme. The width of bars is proportional to the estimated effective population size (Ne, details in Table 1). The occurrence of gene flow is exemplified by arrows. N0POP = effective population size for each population at present time; N1POP = effective population size for each population after the first population decline; NANC = ancestral population size; 2NM0 = average number of haploid immigrants entering the population per generation. T1 = time of the younger population decline; T2 = time of the older population decline. Horizontal error margins represent the 95% confidence intervals for the time of the population declines. Parameter estimates are summarized in Table 1. All analyses were performed considering 2.5 years as generation time. See also Supplementary section 2.2.4 and Figs. S13 – S16 for demographic inferences considering a generation time of 1.0 and 4.5 years.
To disentangle the confounding effects of population-size changes and structure, and allow for both factors to potentially explain our genomic data, we built and compared the congruence of 13 alternative demographic models of increasing complexity (M1–M13) to the RADseq data using a composite likelihood framework implemented in fastsimcoal220. The models incorporated various combinations of changes in population size, population structure (with models involving population splits), and changes in connectivity among the sampling sites (Supplementary Figs. S8 and S9). The likelihood comparison of all 13 demographic models revealed that models including population structure had a better fit than those assuming panmixia, but also that recently structured models (i.e., models where a panmictic population become recently structured) with population size changes showed the highest congruence to the observed data (Supplementary results 2.2.3 and Table S6). The best fitting model (M7) suggested the existence of a large ancient population that only became structured (i.e., split in several demes) and suffered a first reduction on population size around 5 kyr. This event was followed by a more recent population decline at ~1 kyr (Fig. 3d, Table 1). However, the high estimated levels of gene flow among the populations after they became structured (2NM0 ~7.23, where 2NM0 = average number of haploid immigrants entering the population per generation), suggest that the northern and southern site were probably never completely isolated from each other. This last approach not only allowed us to identify the most likely scenario incorporating both changes in population size and structure, but also demonstrates that both types of events are necessary to explain the data.
Late quaternary paleoenvironmental shifts and first human impact on endemic fauna
Population genomics and paleoenvironmental reconstructions were generated from the same study area to investigate how past climatic changes impacted the population dynamics of a forest-dwelling species. One of the most striking results is the significant impact of the AHP on the paleoecology and on the demographic history of M. arnholdi. In particular, the PSMC inferred a population decline preceding the AHP (contemporaneous to the Last Glacial Maximum; period 1; 25–15.2 kyr), after which the abrupt precipitation increase of moisture conditions related to the AHP (period 2 and 3; 15.2–5.5 kyr) allowed a rapid and large development of evergreen humid forest across the entire mountain that triggered a population expansion of M. arnholdi. The alternative scenario assuming structured populations under constant population size (result of IICR simulations) can be rejected for M. arnholdi, since it predicted a lower connectivity during the AHP, which is unlikely, given the large expansion of evergreen humid forest during this time period. In particular, during period 3 (11.8–5.5 kyr), climate conditions supported an even wider extent of evergreen humid forest than in present times, which likely allowed mouse lemur populations to expand and grow further. Although we cannot determine the exact distribution limits of this forest during the AHP, specifically in lowland areas, the current occurrence of M. arnholdi in isolated humid-habitat patches outside the present limits of Montagne d’Ambre24 suggests a temporarily broad expansion of evergreen humid forest in the past. Connectivity between lemur populations should have been high during such periods of increased humidity, as it could have been the case during the AHP. This hypothesis is further supported by the discovery of subfossil lemurs, currently restricted to humid forests in eastern Madagascar (i.e., Propithecus diadema, Indri indri, and Hapalemur simus)48,49,50, in caves located in the currently dry forests of Ankarana, close to our study area (~25 km south of Fantany). Conversely, it is plausible that Montagne d’Ambre acted as a refugium for rainforest-adapted species during dry periods and facilitated recolonizations during subsequent humid periods8,51. Our interdisciplinary study revealed a strong mid-Holocene population decline of M. arnholdi, which occurred under precipitation decrease related to the termination of the AHP and thereby long before important human impact started in Madagascar52. Such a mid-Holocene population decline was also reported in multiple Malagasy taxa, including lemurs12, frogs53, endemic Eagle species54, and in the Malagasy giant rodents55. The first population decline was followed by a second decline in M. arnholdi at the beginning of the last millennium, which again parallels previously documented population bottlenecks for other lemur species17,56,57, all attributed to human-induced changes in forest habitats. Based on local paleoenvironmental reconstructions, we demonstrate that the latest population decline of M. arnholdi indeed coincided with a large increase of fire activity accompanied by a distinct ecosystem shift to a grassland-dominated landscape in the lowland areas surrounding Montagne d’Ambre. These changes most likely resulted from a regional increase in human activities and a shift to agro-pastoralism practices58. Although natural climatic changes might have also been relevant for ecosystem shifts in lowland areas during the past millennium, our results imply that human impact was certainly one of the dominant drivers in these latest and strong ecosystem changes in northern Madagascar.
Conclusion
Our dual paleoecological–genomic approach demonstrates signatures of both past natural climate change and strong recent anthropogenic impact in northern Madagascar. While demographic dynamics of M. arnholdi were exclusively shaped by natural climate changes until the late Holocene, the dynamics during the last millennium were also shaped by anthropogenic impact. In particular, we argue that the population decline of M. arnholdi at 5 kyr was climatically driven by the termination of the AHP, but that human occupation combined with the increasing aridification after the AHP impacted this species even further. Therefore, the termination of the AHP had severe impacts also in northern Madagascar and potentially on large parts of the island, leading to substantial population fluctuations and declines in Malagasy wildlife prior to human impact34,35. This interdisciplinary study reveals that understanding extant biodiversity requires a critical knowledge of natural, climatically driven environmental and ecological changes during the past and particularly beyond the late Holocene when significant human impact started on the island. Additionally, this study illustrates that it is extremely valuable to use multidisciplinary datasets to validate demographic approaches and explore both population size and connectivity changes across different time scales.
Methods
Environmental settings
Montagne d’Ambre NP comprises an isolated volcanic massif in northern Madagascar that stretches 30 km from north to south and 15 km from east to west with an altitude range of 400–1475 m asl (Fig. 1a). The location close to the coast (Indian Ocean/Mozambique Channel) with frequent trade winds triggers high orographic rainfalls. This process, frequently observed in tropical mountains, is mainly explained by the altitude increase that cools the air causing frequent fogs and high orographic precipitation59. This evergreen humid forest is in clear contrast to drier conditions in the seasonally dry forests or open grasslands growing below 800 m asl around the mountain and the montane vegetation growing above 1800 m asl in other parts of the island60,61. In Montagne d’Ambre, only rare plants of montane vegetation currently occur in the upper-mountain parts. Consequently, there is currently no mountain vegetation zone in Montagne d’Ambre. Inhabiting the evergreen humid forests in northern Madagascar, the tree-dwelling primate M. arnholdi occurs in Montagne d’Ambre and its distribution extends to several highland humid forests between the Loky and Fanambana Rivers, southeast of Montagne d’Ambre24. A single M. arnholdi individual has also been reported close to Ambanja, southwest of the NP62.
Coring
Lac Maudit (−12.582°N, 49.150°E, 1250 m asl) is characterized by a coverage of ca. 75% with floating vegetation and a peat bog. Open water still is present in the northern and southern part of the crater. From the center of the lake, accessible from the peat bog, two parallel sediment cores (LM1A and LM1B) with lengths of 10.5 m and 10.75 m were recovered using a Russian peat corer in June 2017. After coring, all 50-cm segments were described lithologically and subsequently wrapped in polyvinyldene chloride film. Cores were stored at 5 °C and under dark conditions until further work.
Paleoenvironmental analyses
From both cores high-resolution, semi-quantitative measurements of inorganic chemical elements were conducted using an ITRAX (CS-8) X-Ray fluorescence (XRF) core scanner with a molybdenum (Mo) tube63 at the Geomorphological–Sedimentological Laboratory of the Geomorphology and Polar Research (GEOPOLAR), University of Bremen. XRF scanning was conducted at 55 kV and 30 mA with 10 s of exposure time at 0.2 mm resolution. Further, radiographic images were acquired with 40 kV, 15 mA, and 200 ms of exposure time at the same spatial resolution. Silicium (Si), potassium (K), calcium (Ca), titanium (Ti), manganese (Mn), iron (Fe), nickel (Ni), and strontium (Sr) showed reliable signals and were used for further interpretation. These elements were normalized to the counts of incoherent radiation (“Mo inc”) derived from the XRF scanner, to account for lithological changes and sediment matrix effects. Based on the lithological description (marker layers), the XRF-element patterns, and digital and radiographic images, LM1A and LM1B were parallelized and combined to a composite core. Using the XRF data, a Principal Component Analysis (PCA) was carried out, using the selected elements (Si, K, Ca, Ti, Mn, Fe, and Ni) as input variables. Prior to this multivariate statistic, the normalized elements were transformed using standard “z-transformation”. Grain-size distribution measurements were realized on LM1A, while paleoecological analyses, including pollen and charcoal counting, were realized on LM1B. For the grain size analysis ~1 cm3 subsamples at an interval of 5 cm were taken and measured after destroying carbonates and organic matter according to standard protocols with HCl (15, 30% p.A.) resp. H2O2 (10, 32% p.A.). Measurements were carried out with a laser diffraction particle-size analyzer (LS 13320 Beckman Coulter) in seven cycles of 60 s each. The first reproducible signal was considered as reliable and final distribution data were calculated using the Fraunhofer optical model. Statistical parameters were derived from the raw data using a modified version of the MS-Excel macro Gradistat (V.4.5 s)64. For pollen extraction, ~0.5 cm3 subsamples at an interval varying between 8 and 48 cm on LM1B were prepared following a standard chemical protocol. A minimum sum of 300 terrestrial pollen grains was counted for each subsample using a light microscope at 400x magnification. Pollen and fern-spore percentages were calculated on the terrestrial pollen sum. For charcoal-particle extraction, 1 cm3 of sediment was sampled every cm along the core LM1B and soaked in a 3% NaP2O4 solution plus bleach for several hours to deflocculate sediments and oxidize organic matter. Samples were sieved through a 160 μm mesh and charcoal particles were counted using a stereomicroscope at x40 magnification coupled to a digital camera. Influx of charcoal particles was calculated using the age-depth model (number of particles/cm2/year). For a reliable and robust chronology, 19 radiocarbon measurements were obtained by Accelerator Mass Spectrometry radiocarbon analyses from bulk organic matter of 1 cm3 sediment samples (Supplementary Table S1). All subsamples for radiocarbon dating were measured at Poznan Radiocarbon Laboratory (Poland) and are calibrated to calendar kiloyears before present (kyr) using the southern hemisphere terrestrial calibration curve SHCal1365. For more details see Supplementary sections 1.1−1.4.
Sample collection of M. arnholdi
Mouse lemurs were sampled in the evergreen humid forest at the northern (Mahasarika, −12.534329 °N, 49.176295 °E) and southern limit of Montagne d’Ambre NP (Fantany, −12.695739 °N, 49.167458°E; Fig. 1a). The first site lies at 1073 m asl, while the second (approx. 18 km apart from Mahasarika) is located at slightly lower altitude at the ecotone between forest and grassland at 848 m asl. Field work took place between August and October 2017 (dry season). Mouse lemurs were captured by hand near the trees that they used during nighttime activity66 (see Supplementary section 2.1.1 for details). A total of 46 mouse lemur samples were obtained for genomic analyses, which included 14 M. arnholdi from Mahasarika and 32 from Fantany. All capture-routine protocols were approved by the Malagasy Authorities and by the Institute of Zoology, University of Veterinary Medicine Hannover (Research permit N°78/17/MEEF/SG/DGF/DSAP/SCB.Re). A sample-exportation permit for ear biopsies was granted by the authorities in Madagascar (permit number 855C-EA10-MG17) and an importation permit was granted by the Bundesamt für Naturschutz, Germany (permit number DE-E-06530/17).
DNA extraction, RADseq, and whole-genome sequencing
Total genomic DNA was extracted from ear biopsies using the DNeasy Blood & Tissue Kit (Qiagen) following the manufacturer’s protocol with few modifications67. Two genomic datasets were generated to reconstruct the demographic history of M. arnholdi: a restriction site-associated DNA sequencing (RADseq) dataset and whole-genome sequences. Library preparation and RAD sequencing of all 46 samples were conducted at the GeT-PlaGe platform (Toulouse, France). In parallel, two mouse lemur samples (one from Mahasarika and one from Fantany) were selected for whole-genome sequencing (Supplementary Table S2). Both samples were derived from females in order to avoid a bias due to potential sex differences in dispersal behavior, which is common in other mouse lemur species68,69. The raw genomic data were trimmed and aligned to the Microcebus murinus reference genome70. All analyses using the RADseq dataset were performed based on genotype likelihoods71,72,73, considering only individuals with a mean sequencing coverage >4X73,74,75. ANGSD73 was used to call genotype likelihoods for sites present in at least 75% of the individuals, and with a base quality above 20, a mapping quality above 30, and with a minimum minor allele frequency above 0.05. For the analyses with the whole-genome sequences, we applied a missing data filter of 30% and controlled for read depth and quality of the variant sites by considering a base quality above 20, a mapping quality above 30, a minimum read depth of three, and a maximum read depth of 100 (see Supplementary sections 2.1.2−2.1.4 for further methodological details and 2.2.1 and Table S3 for details about the genomic datasets).
Relatedness analyses and detection of population structure
In order to overcome a potential demographic history reconstruction bias44,45,76, the relatedness between the 46 sampled mouse lemurs was investigated first. The relatedness between two individuals is usually described by the concept of identity-by-descent (IBD). The software NGSrelate74 implemented in ANGSD framework73 was used to calculate the IBD coefficients (k0, k1, and k2) between all pairs of individuals of our dataset (see Supplementary section 2.1.5 for details). Of each dyad of closely related individuals (e.g., parent–offspring or full siblings), only one partner was retained in the dataset. Subsequently, NGSadmix72 was used to investigate population structure of 38 non-related individuals (12 from Mahasarika and 26 from Fantany). NGSadmix uses a maximum-likelihood clustering method to assign individuals to a predefined number of populations (K) based on genotype likelihoods72. A total of 10 independent runs of NGSadmix were performed to assign all individuals to two (K = 2) or three (K = 3) ancestral populations, assuming that the existence of more than three populations is not realistic at our local scale. The most suitable value of K was determined with Clumpak77, following the Evanno method78. The population structure analyses support the existence of two genetic clusters with low levels of admixture between the two sites (Fig. 1b; Supplementary section 2.2.2 and Fig. S7). Consequently, the two sampling sites were considered as two independent demes in all downstream analyses.
Generation time
Demographic analyses are known to be affected by generation time (GT)79. Different generation time values ranging from 1 to 4.5 years can be found in the literature on mouse lemurs11,17,80,81. A GT = 1.0 was widely used in early demographic studies17,80 and corresponds to the age at first reproduction. A longer generation time (3.0–4.5 years) has been estimated based on survival data for a population of M. rufus in eastern Madagascar11. Recently, an intermediate GT value of 2.5 years was estimated for a free‐living M. murinus population in northwestern Madagascar based on parentage data81, where the authors defined GT as the average age of parents. A GT = 2.5 seems biologically appropriate for mouse lemurs, because it considered the entire reproductive career of individuals and took into account age- and sex-related differences in reproductive performance81. This estimate was used to generate all genomic results presented in the main text. However, in order to evaluate the consequences of choosing different generation times, all demographic analyses were repeated using the three aforementioned GTs (1.0, 2.5, and 4.5 years) and the results are presented in the Supplementary section 2.2.4.
PSMC analyses and IICR
PSMC19 analyses were performed on two whole-genome autosomal sequences considering a minimum read depth per site of 3 (-d3) and a maximum read depth per site of 100 (-D100). The upper limit of the TMRCA was set to 5 (-t5) and the initial θ/ρ value to 5 (-r5). The Ne was inferred using a total of 100 bootstrap replicates. PSMC plots were scaled using generation times of 1.0, 2.5, and 4.5 years per generation (see Supplementary section 2.2.4 and Fig. S15), and a mutation rate of 1.2 × 10−811,82,83. This mutation rate is the most accurate estimate available for mouse lemurs and was calculated from average pedigree-based estimates of seven primate species, including that of one mouse lemur species83,84. To evaluate the impact of the relatively low genome-wide coverage in our PSMC inferences, we also ran simulations for variant coverage divergence based on minimum read depth option per site (-d) between 1 and 9 for both study sites. The results are presented in the Supplementary section 2.2.5 and Fig. S18. Recent work has shown that PSMC dynamics can also result from changes in connectivity and not only from population size change, if populations are structured (e.g., n-island model, Supplementary section 2.1.6)44,47. It was shown that the PSMC method actually estimates a time- and sample-dependent function called the Inverse Instantaneous Coalescent Rate (IICR) whose interpretation is model-dependent (i.e., population panmixia vs population structure)44. The IICR44,47 can be predicted under a very large family of structured models using simulations to identify complex models that can replicate the observed PSMC curve. In order to investigate if the demographic trajectories revealed by the PSMC method could be explained exclusively by changes in population connectivity, the IICR of Fantany was computed considering an n-island model of migration with a constant population size. The model simulations were performed by varying the number of connectivity changes between two and four, the migration rate between 0 and 100 and considering the number of islands up to 100. Genomic data was simulated using the ms software85, and the IICR was computed and plotted with a python script available at: https://github.com/willyrv/IICREstimator47, assuming a mutation rate of 1.2 × 10⁻⁸ and the three generation times (see Supplementary section 2.2.4 and Fig. S16). The IICR obtained under the best structure model was finally compared to the one inferred by the PSMC method.
Stairway Plot
The complete RADseq dataset of non-related animals (N = 38 individuals) was used for estimating a Site Frequency Spectrum (SFS; i.e., distribution of the allele frequencies of a given set of single nucleotide polymorphisms in a population)16. As a first step, ANGSD73 was used to calculate the site allele frequency likelihoods based on individual genotype likelihoods. The realSFS tool implemented in ANGSD73 was then used to estimate the 1d-SFS for each sampling site separately. Given that there is no suitable outgroup available to determine the ancestral state of each allele, we considered the minor allele-frequency spectrum (i.e., folded SFS)18 for all SFS-related analyses. The two-folded 1d-SFS were finally used as input data for Stairway Plot v2.021. Inferences were made based on 200 SFS for each sampling site, as suggested by the authors. The remaining 199 SFS were generated by bootstrapping, using the script provided by the software21. The plots were scaled using all three generation times (see Supplementary section 2.2.4 and Fig. S14) and 1.2 × 10⁻⁸ as mutation rate11,82. The analyses were performed considering the entire dataset for each forest site, and also an equal sample size for Mahasarika and Fantany (N = 12). For this analysis, the individuals from Fantany were randomly selected using R (R Development Core Team 2005).
Demographic modeling with fastsimcoal2
A total of 13 potential and plausible demographic scenarios were designed for M. arnholdi and their composite likelihoods were compared following a hierarchical approach. First, five simple models, including a constant population size model, a single-population-size change model (expansion or bottleneck), an ancient or recent population structure model, and a connectivity change model, were explored (M1–M5; Supplementary sections 2.2.3, Fig. S8). Second, more complex demographic models were formulated based on the results of the previous step (Supplementary Table S6). Specifically, we compared four recently structured models (i.e., models where a panmictic population become recently structured) with the inclusion of one or two population bottlenecks after the populations become structured, or an ancient population expansion preceding that event (M6–M9; Supplementary Fig. S9a). Additionally, we also compared four models considering changes in connectivity among populations (with or without size change), where the changes in migration rate occurred in parallel to the population structuring or afterward (M10–M13; Supplementary Fig. S9b). See Supplementary section 2.2.3 and Table S6 for details of model selection. The analyses were performed with the RADseq dataset but, for computational reasons, only 20 individuals (i.e., 10 individuals from each sampling site) were selected for the 2d-SFS estimation. As a first step, ANGSD73 was used to calculate the allele-frequency likelihoods for each sampling site, and the realSFS tool implemented in the same program combined together with custom scripts was used to estimate the two-dimensional minor allele frequency spectrum (i.e., folded 2d-SFS18). It is important to emphasize that (i) Mahasarika is about 18 km apart from Fantany, (ii) mouse lemurs are known to disperse over very small distances (e.g., below 1 km for M. murinus)86,87,88,89,90, and (iii) our genetic structure analyses revealed only low levels of admixture among our study sites (Fig. 1b). For these reasons, an additional “ghost population” was included in our demographic models to control for the effect of an unsampled subpopulation on the estimation of migration rates between Mahasarika and Fantany (i.e., by representing a potential source of admixture between the northern and southern sites)91,92. The inclusion of such a “ghost population” is recommended when gene flow among the sampled populations is limited92, and it was shown to improve the fit of the demographic models in human populations92. Fastsimcoal2 v.2.620 was subsequently used to compute expected SFSs from simulations under the 13 demographic scenarios (see Supplementary Table S4 for details about model parameters). The best demographic model was selected according to three criteria. The Akaike Information Criteria (AIC)93 was initially used to rank all 13 demographic models, and the models with the lowest ΔAIC (i.e., the models that minimized the distance between observed and expected SFS) were selected as the best ranked demographic models (Supplementary Table S6). Second, the fitting of the 2d-SFS obtained for the parameters that maximized the likelihood under model simulations were visually compared with the 2d-SFS estimated from the RADseq dataset94 (see Supplementary Fig. S11–S13). Third, a block-bootstrap approach was used to calculate 95% confidence intervals (CI) for the parameters estimated under the three best ranked demographic models20 (see Table 1 and Supplementary Table S5, S7, Fig. S10) and to select the best fitting demographic model (see Supplementary section 2.1.7 for the command line options). The fastsimcoal2 scenario that best fitted the genomic data was finally scaled considering the generation times of 1.0, 2.5, and 4.5 years (Supplementary section 2.2.4 and Fig. S17). Knowing that fastsimcoal2 provides information about the direction of population size instead of inferring the Ne through time, this shortfall was accounted by the implementation of the PSMC and the Stairway Plot methods.
Impact of protein-coding sites in the demographic modeling of M. arnholdi
We reran the PSMC, Stairway Plot, and the best fastsimcoal2 demographic model without protein-coding sites to exclude possible confounding effects of sites under selection. All the analyses were performed using the same command options aforementioned and considering 2.5 years as generation time. The results are discussed in the Supplementary section 2.2.6 and shown in Figs. S19–S21.
Statistics and reproducibility
The Methods section and supplementary materials provide all details for statistical analyses. Specific details are also provided in figures when appropriate. All experiments and analyses performed in this paper are entirely reproducible.
Reporting summary
Further information on research design is available in the Nature Research Reporting Summary linked to this article.
Data availability
All RADseq sequences obtained in this study are publicly available at Sequence Read Archive (NCBI) in the BioProject PRJNA560399 (Number accession: SAMN14854044–SAMN14854081). Whole genome sequences are available in the BioProject PRJNA632451 (Biosample: SAMN14909740 for Mahasarika and SAMN14909741 for Fantany). The paleoenvironmental data are provided in the Supplementary Information (see supplementary data file 1–4).
Code availability
Scripts used for all genomic analyses are available from the corresponding author on reasonable request.
References
Frankham, R., Briscoe, D. A. & Ballou, J. D. Introduction to conservation genetics (Cambridge university press, 2002).
Nadachowska-Brzyska, K., Burri, R., Smeds, L. & Ellegren, H. PSMC analysis of effective population sizes in molecular ecology and its application to black-and-white Ficedula flycatchers. Mol. Ecol. 25, 1058–1072 (2016).
Martínez-Freiría, F., Velo-Antón, G. & Brito, J. C. Trapped by climate: Interglacial refuge and recent population expansion in the endemic Iberian adder Vipera seoanei. Divers. Distrib. 21, 331–344 (2015).
Martínez-Freiría, F. et al. Integrative phylogeographical and ecological analysis reveals multiple pleistocene refugia for Mediterranean Daboia vipers in north-west Africa. Biol. J. Linn. Soc. 122, 366–384 (2017).
Veríssimo, J. et al. Pleistocene diversification in Morocco and recent demographic expansion in the Mediterranean pond turtle Mauremys leprosa. Biol. J. Linn. Soc. 119, 943–959 (2016).
Chattopadhyay, B., Garg, K. M., Gwee, C. Y., Edwards, S. V. & Rheindt, F. E. Gene flow during glacial habitat shifts facilitates character displacement in a Neotropical flycatcher radiation. BMC Evol. Biol. 17, 1–15 (2017).
Garg, K. M., Chattopadhyay, B., Koane, B., Sam, K. & Rheindt, F. E. Last Glacial Maximum led to community-wide population expansion in a montane songbird radiation in highland Papua New Guinea. BMC Evol. Biol. 20, 82 (2020).
Vences, M., Wollenberg, K. C., Vieites, D. R. & Lees, D. C. Madagascar as a model region of species diversification. Trends Ecol. Evol. 24, 456–465 (2009).
Goodman, S. M., Raherilalao, M. J. & Wohlhauser, S. The Terrestrial Protected Areas of Madagascar: Their History, Description and Biota (Association Vahatra in Antananarivo, The University of Chicago Press, 2018).
Douglass, K. The diversity of late holocene shellfish exploitation in Velondriake, Southwest Madagascar. J. Island Coast. Archaeol. 12, 333–359 (2016).
Yoder, A. D., Campbell, C. R., Blanco, M. B., Ganzhorn, J. U. & Goodman, S. M. Geogenetic patterns in mouse lemurs (genus Microcebus) reveal the ghosts of Madagascar’s forests past. PNAS 113, 8049–8056 (2016).
Salmona, J., Heller, R., Quéméré, E. & Chikhi, L., Climate change. and human colonization triggered habitat loss and fragmentation in Madagascar. Mol. Ecol. 26, 5203–5222 (2017).
Townsend, T. M., Vieites, D. R., Glaw, F. & Vences, M. Testing species-level diversification hypotheses in Madagascar: the case of microendemic Brookesia leaf Chameleons. Syst. Biol. 58, 641–656 (2009).
Brown, J. L., Cameron, A., Yoder, A. D. & Vences, M. A necessarily complex model to explain the biogeography of the amphibians and reptiles of Madagascar. Nat. Commun. 5, 5046 (2014).
Schüßler, D. et al. Ecology and morphology of mouse lemurs (Microcebus spp.) in a hotspot of microendemism in northeastern Madagascar, with the description of a new species. Am. J. Primatol. 82, e23180 (2020).
Chikhi, L. & Bruford, M. Mammalian population genetics and genomics. Mamm. Genome https://doi.org/10.1079/9780851999104.0539 (2005).
Olivieri, G. L., Sousa, V., Chikhi, L. & Radespiel, U. From genetic diversity and structure to conservation: Genetic signature of recent population declines in three mouse lemur species (Microcebus spp.). Biol. Conserv. 141, 1257–1271 (2008).
Gutenkunst, R. N., Hernandez, R. D., Williamson, S. H. & Bustamante, C. D. Inferring the joint demographic history of multiple populations from multidimensional SNP frequency data. PLoS Genet. 5, e1000695 (2009).
Li, H. & Durbin, R. Inference of human population history from individual whole-genome sequences. Nature 475, 493–496 (2011).
Excoffier, L., Dupanloup, I., Huerta-Sánchez, E., Sousa, V. C. & Foll, M. Robust demographic inference from genomic and SNP data. PLoS Genet. 9, e1003905 (2013).
Liu, X. & Fu, Y.-X. Exploring population size changes using SNP frequency spectra. Nat Genet. 47, 555–559 (2015).
Salmona, J., Heller, R., Lascoux, M. & Shafer, A. Inferring demographic history using genomic data. in Population Genomics 511–537 (Springer, 2017).
Beichman, A. C., Huerta-Sanchez, E. & Lohmueller, K. E. Using genomic data to infer historic population dynamics of nonmodel organisms. Annu. Rev. Ecol. Evol. Syst. 49, 433–456 (2018).
Sgarlata, G. M. et al. Genetic and morphological diversity of mouse lemurs (Microcebus spp.) in northern Madagascar: The discovery of a putative new species? Am. J. Primatol. 81, e23070 (2019).
Demenocal, P. et al. Abrupt onset and termination of the African humid period:: rapid climate responses to gradual insolation forcing. Quat. Sci. Rev. 19, 347–361 (2000).
Tierney, J. E. & DeMenocal, P. B. Abrupt shifts in Horn of Africa hydroclimate since the last glacial maximum. Science 342, 843–846 (2013).
Los, S. O. et al. Sensitivity of a tropical montane cloud forest to climate change, present, past and future: Mt. Marsabit, N. Kenya. Quat. Sci. Rev. 218, 34–48 (2019).
Ivory, S. J. & Russell, J. Climate, herbivory, and fire controls on tropical African forest for the last 60ka. Quat. Sci. Rev. 148, 101–114 (2016).
Conroy, J. L., Overpeck, J. T., Cole, J. E., Shanahan, T. M. & Steinitz-Kannan, M. Holocene changes in eastern tropical Pacific climate inferred from a Galápagos lake sediment record. Quat. Sci. Rev. 27, 1166–1180 (2008).
Martin-Puertas, C., Tjallingii, R., Bloemsma, M. & Brauer, A. Varved sediment responses to early Holocene climate and environmental changes in Lake Meerfelder Maar (Germany) obtained from multivariate analyses of micro X-ray fluorescence core scanning data. J. Quat. Sci. 32, 427–436 (2017).
Flenley, J. R. Tropical forests under the climates of the last 30,000 years. in Potential Impacts of Climate Change on Tropical Forest Ecosystems, 37–57 (Springer, 1998).
Burrough, S. L. & Thomas, D. S. G. Central southern Africa at the time of the African humid period: a new analysis of Holocene palaeoenvironmental and palaeoclimate data. Quat. Sci. Rev. 80, 29–46 (2013).
Ivory, S. J. & Russell, J. Lowland forest collapse and early human impacts at the end of the African humid period at Lake Edward, equatorial East. Afr. Quat. Res. 89, 7–20 (2018).
Anderson, A. et al. New evidence of megafaunal bone damage indicates late colonization of Madagascar. PLoS ONE 13, 1–14 (2018).
Hansford, J. et al. Early Holocene human presence in Madagascar evidenced by exploitation of avian megafauna. Sci. Adv. 4, eaat6925 (2018).
Burney, D. A., Robinson, G. S. & Burney, L. P. Sporormiella and the late holocene extinctions in Madagascar. Proc. Natl Acad. Sci. USA 100, 10800–10805 (2003).
Railsback, L. B. et al. Relationships between climate change, human environmental impact, and megafaunal extinction inferred from a 4000-year multi-proxy record from a stalagmite from northwestern Madagascar. Quat. Sci. Rev. 234, 106244 (2020).
Dewar, R. E. et al. Stone tools and foraging in northern Madagascar challenge Holocene extinction models. PNAS 110, 12583–12588 (2013).
Radimilahy, C. Mahilaka: an Archaeological Investigation of an Early Town in Northwestern Madagascar. Acta Universitatis Upsaliensis (University of Uppsala, 1998).
Liu, X. & Fu, Y.-X. Exploring population size changes using SNP frequency spectra. Nat. Genet 47, 555–559 (2015).
Lapierre, M., Lambert, A. & Achaz, G. Accuracy of demographic inferences from the site frequency spectrum: the case of the yoruba population. Genetics 206, 139–449 (2017).
Terhorst, J., Kamm, J. A. & Song, Y. S. Robust and scalable inference of population history from hundreds of unphased whole genomes. Nat. Genet. 49, 303–309 (2017).
Patton, A. H. et al. Contemporary demographic reconstruction methods are robust to genome assembly quality: a case study in Tasmanian devils. Mol. Biol. Evol. 36, 2906–2921 (2019).
Mazet, O., Rodríguez, W., Grusea, S., Boitard, S. & Chikhi, L. On the importance of being structured: Instantaneous coalescence rates and human evolution-lessons for ancestral population size inference? Heredity 116, 362–371 (2016).
Orozco-terWengel, P. The devil is in the details: the effect of population structure on demographic inference. Heredity 116, 349–350 (2016).
Mazet, O., Rodríguez, W. & Chikhi, L. Demographic inference using genetic data from a single individual: separating population size variation from population structure. Theor. Popul. Biol. 104, 46–58 (2015).
Chikhi, L. et al. The IICR (inverse instantaneous coalescence rate) as a summary of genomic diversity: Insights into demographic inference and model choice. Heredity 120, 13–24 (2018).
Simons, E. L., Godfrey, L. R., Vuillaume-Randriamanantena, M., Chatrath, P. S. & Gagnon, M. Discovery of new giant subfossil lemurs in the Ankarana Mountains of Northern Madagascar. J. Hum. Evol. 19, 311–319 (1990).
Jungers, W. L., Godfrey, L. R., Simons, E. L. & Chatrath, P. S. Subfossil Indri indri from the Ankarana Massif of northern Madagascar. Am. J. Phys. Anthropol. 97, 357–366 (1995).
Wilson, J. M., Stewart, P. D. & Fowler, S. V. Ankarana — a rediscovered nature reserve in northern Madagascar. Oryx 22, 163–171 (1988).
Everson, K. M., Jansa, S. A., Goodman, S. M. & Olson, L. E. Montane regions shape patterns of diversification in small mammals and reptiles from Madagascar’s moist evergreen forest. J. Biogeogr. 47, 2059–2072 (2020).
Douglass, K., Hixon, S., Wright, H. T., Godfrey, L. R. & Crowley, B. E. A critical review of radiocarbon dates clarifies the human settlement of Madagascar. Quat. Sci. Rev. 221, 105878 (2019).
Orozco-Terwengel, P., Andreone, F., Louis, E. & Vences, M. Mitochondrial introgressive hybridization following a demographic expansion in the tomato frogs of Madagascar, genus. Dyscophus. Mol. Ecol. 22, 6074–6090 (2013).
Johnson, J. A. et al. Long-term survival despite low genetic diversity in the critically endangered Madagascar fish-eagle. Mol. Ecol. 18, 54–63 (2009).
Sommer, S. Effects of habitat fragmentation and changes of dispersal behaviour after a recent population decline on the genetic variability of noncoding and coding DNA of a monogamous Malagasy rodent. Mol. Ecol. 12, 2845–2851 (2003).
Craul, M. et al. Influence of forest fragmentation on an endangered large-bodied lemur in northwestern Madagascar. Biol. Conserv. 142, 2862–2871 (2009).
Parga, J. A., Sauther, M. L., Cuozzo, F. P., Jacky, I. A. Y. & Lawler, R. R. Evaluating ring-tailed lemurs (Lemur catta) from southwestern Madagascar for a genetic population bottleneck. Am. J. Phys. Anthropol. 147, 21–29 (2012).
Dewar, R. E. et al. Stone tools and foraging in northern Madagascar challenge Holocene extinction models. Proc. Natl Acad. Sci. USA 110, 12583–12588 (2013).
Schüler, L. & Hemp, A. Atlas of pollen and spores and their parent taxa of Mt. Kilimanjaro and tropical East Africa. Quat. Int. 425, 301–386 (2016).
Du Puy, D. J. & Moat, J. Vegetation mapping and classification in Madagascar (using GIS): implications and recommendations for the conservation of biodiversity. in Chorology, Taxonomy and Ecology of the floras of Africa and Madagascar, 97–117 (1998, in press).
Guillaumet, J.-L., Betsch, J.-M. & Callmander, M. W. Renaud Paulian et le programme du CNRS sur les hautes montagnes à Madagascar: étage vs domaine. Zoosystema 30, 723 (2008).
Weisrock, D. W. et al. Delimiting species without nuclear monophyly in Madagascar’s mouse lemurs. PLoS ONE 5, e9883 (2010).
Croudace, I. W., Rindby, A. & Rothwell, R. G. ITRAX: description and evaluation of a new multi-function X-ray core scanner. Geol. Soc. Lond. Spec. Publ. 267, 51–63 (2006).
Blott, S. J. & Pye, K. GRADISTAT: a grain size distribution and statistics package for the analysis of unconsolidated sediments. Earth Surf. Process. Landforms 26, 1237–1248 (2001).
Hogg, A. G. et al. SHCal13 Southern Hemisphere calibration, 0–50,000 years cal BP. Radiocarbon 55, 1889–1903 (2013).
Rina Evasoa, M. et al. Sources of variation in social tolerance in mouse lemurs (Microcebus spp.). BMC Ecol. 19, 1–16 (2019).
Aleixo-Pais, I. et al. The genetic structure of a mouse lemur living in a fragmented habitat in Northern Madagascar. Conserv. Genet. 20, 229–243 (2019).
Radespiel, U., Jurić, M. & Zimmermann, E. Sociogenetic structures, dispersal and the risk of inbreeding in a small nocturnal lemur, the golden-brown mouse lemur (Microcebus ravelobensis). Behaviour 146, 607–628 (2009).
Radespiel, U., Ehresmann, P. & Zimmermann, E. Species-specific usage of sleeping sites in two sympatric mouse lemur species (Microcebus murinus and M. ravelobensis) in northwestern Madagascar. Am. J. Primatol. 59, 139–151 (2003).
Larsen, P. A. et al. Hybrid de novo genome assembly and centromere characterization of the gray mouse lemur (Microcebus murinus). BMC Biol. 15, 1–17 (2017).
Metzker, M. L. Sequencing technologies — the next generation. Nat. Rev. Genet. 11, 31 (2010).
Skotte, L., Korneliussen, T. S. & Albrechtsen, A. Estimating individual admixture proportions from next generation sequencing. Data 195, 693–702 (2013).
Korneliussen, T. S., Albrechtsen, A. & Nielsen, R. ANGSD: analysis of next generation sequencing data. BMC Bioinforma. 15, 1–13 (2014).
Korneliussen, T. S. & Moltke, I. Sequence analysis NgsRelate: a software tool for estimating pairwise relatedness from next-generation sequencing data. Bioinformatics 31, 4009–4011 (2015).
Soraggi, S., Wiuf, C. & Albrechtsen, A. Powerful inference with the D-Statistic on low-coverage whole-genome data. G3 8, 551–566 (2017).
Chikhi, L., Sousa, V. C., Luisi, P., Goossens, B. & Beaumont, M. A. The confounding effects of population structure, genetic diversity and the sampling scheme on the detection and quantification of population size changes. Genetics 186, 983–995 (2010).
Kopelman, N. M., Mayzel, J., Jakobsson, M., Rosenberg, N. A. & Mayrose, I. Clumpak: a program for identifying clustering modes and packaging population structure inferences across K. Mol. Ecol. Resour. 15, 1179–1191 (2015).
Evanno, G., Regnaut, S. & Goudet, J. Detecting the number of clusters of individuals using the software STRUCTURE: a simulation study. Mol. Ecol. 14, 2611–2620 (2005).
Salmona, J., Heller, R., Quéméré, E. & Chikhi, L. Climate change and human colonization triggered habitat loss and fragmentation in Madagascar. Mol. Ecol. 26, 5203–5222 (2017).
Schneider, N., Chikhi, L., Currat, M. & Radespiel, U. Signals of recent spatial expansions in the grey mouse lemur (Microcebus murinus). BMC Evol. Biol. 10, 105 (2010).
Radespiel, U., Lutermann, H., Schmelting, B. & Zimmermann, E. An empirical estimate of the generation time of mouse lemurs. Am. J. Primatol. 81, 1–8 (2019).
Hawkins, M. T. R. et al. Genome sequence and population declines in the critically endangered greater bamboo lemur (Prolemur simus) and implications for conservation. BMC Genomics 19, 1–15 (2018).
Poelstra, J. et al. Cryptic patterns of speciation in cryptic primates: microendemic mouse lemurs and the multispecies coalescent. Syst. Biol. https://doi.org/10.1093/sysbio/syaa053 (2020).
Campbell, C. R. et al. Pedigree-based and phylogenetic methods support surprising patterns of mutation rate and spectrum in the gray mouse lemur. Heredity 127.2, 233–244 (2021).
Hudson, R. R. Generating samples under a Wright–Fisher neutral model of genetic variation. Bioinformatics 18, 337–338 (2002).
Fredsted, T., Pertoldi, C., Schierup, M. H. & Kappeler, P. M. Microsatellite analyses reveal fine-scale genetic structure in grey mouse lemurs (Microcebus murinus). Mol. Ecol. 14, 2363–2372 (2005).
Radespiel, U., Schulte, J., Burke, R. J. & Lehman, S. M. Molecular edge effects in the endangered golden-brown mouse lemur Microcebus ravelobensis. Oryx 53, 716–726 (2019).
Radespiel, U., Lutermann, H., Schmelting, B., Bruford, M. W. & Zimmermann, E. Patterns and dynamics of sex-biased dispersal in a nocturnal primate, the grey mouse lemur, Microcebus murinus. Anim. Behav. 65, 709–719 (2003).
Radespiel, U., Rakotondravony, R. & Chikhi, L. Natural and anthropogenic determinants of genetic structure in the largest remaining population of the endangered golden-brown mouse lemur, Microcebus ravelobensis. Am. J. Primatol. 70, 860–870 (2008).
Schliehe-Diecks, S., Eberle, M. & Kappeler, P. M. Walk the line-dispersal movements of gray mouse lemurs (Microcebus murinus). Behav. Ecol. Sociobiol. 66, 1175–1185 (2012).
Excoffier, L., Dupanloup, I., Huerta-Sánchez, E., Sousa, V. C. & Foll, M. Robust demographic inference from genomic and SNP data. PLoS Genet. 9, e1003905 (2013).
Beerli, P. Effect of unsampled populations on the estimation of population sizes and migration rates between sampled populations. Mol. Ecol. 13, 827–836 (2004).
Akaike, H. A new look at the statistical model identification. IEEE Trans. Automat. Control 19, 716–723 (1974).
Bagley, R. K., Sousa, V. C., Niemiller, M. L. & Linnen, C. R. History, geography and host use shape genomewide patterns of genetic variation in the redheaded pine sawfly (Neodiprion lecontei). Mol. Ecol. 26, 1022–1044 (2017).
Acknowledgements
We thank Madagascar National Parks, the director of Montagne d’Ambre National Park, the Direction du Système des Aires Protégées, the Direction Générale du Ministère de l’Environnement et des Forêts de Madagascar, Madagascar’s Ad Hoc Committee for Fauna and Flora, and the Organizational Committee for Environmental Research for their permission to conduct the field work in Montagne d’Ambre National Park (N°78/17/MEEF/SG/DGF/DSAP/SCB.Re and N°79/17 MEEF/SG/DGF/DSAP/SCB/RE) and for their support. We thank Prof. Perle Ramavovololona for her support in organizing the paleoecological fieldwork. We thank Adolphe Rakotomanantena and Augustin Rakotonandrianina, the guides of Montagne d’Ambre National Park and the local communities for their indispensable help in the field. We thank Victor C. Sousa who kindly provided the scripts for the fastsimcoal2 analyses and the necessary guidance for this approach, and Dr. Ariel Rodriguez for his help with computational issues. We thank Armando Arredondo and Olivier Mazet for their guidance and advice about the IICR analyses. We are grateful to Sophie Manzi and the Get-Plage platform for library preparation and sequencing, to the Genotoul bioinformatics and North-German Supercomputing Alliance (HLRN) platforms for providing computing resources. Finally, we acknowledge Christopher Barratt and the two anonymous reviewers whose comments on the previous version improved the quality of this paper substantially. This study was funded by the Deutsche Forschungsgemeinschaft (ME 4517/2-1, RA 502/20-1, RA 502/20-3, and BE 2161/30-1). The work also benefited from several meetings with collaborators organized under the ERA-NET BiodivERsA initiative (No. 2015-138), project: INFRAGECO (Inference, Fragmentation, Genomics, and Conservation), financed on the German side by the Bundesministerium für Bildung und Forschung (#01LC1617A).
Funding
Open Access funding enabled and organized by Projekt DEAL.
Author information
Authors and Affiliations
Contributions
U.R., H.B., and V.M. conceptualized and designed the study and planned the field expeditions together with R.R.. U.R. guided the lemur field work, and H.T. and V.M. conducted the field work with support of R.R. and Sa.R.. H.T. collected the mouse lemur samples for the genomic analyses, carried out the laboratory work, processed the RADseq data with guidance of J.S., L.C., and U.R., and wrote the first draft of the paper together with V.M.. J.S. developed the bioinformatics pipeline used to analyze the raw RADseq data and advised on various genomic analytical steps. J.M. performed the whole-genomic sequencing and the PSMC analyses. J.S. and L.C. helped to delineate the demographic models. The coring was performed by V.M., L.B., and Sa.R., pollen analyses have been realized by V.M., charcoal counting by S.R., and grain size and magnetic susceptibility by G.D. and T.K.. V.M. discussed paleoecological and sedimentological results with the guidance of T.K., G.D., L.B. and H.B.. All authors revised the paper and the final version of the paper was approved by everyone.
Corresponding authors
Ethics declarations
Competing interests
The authors declare no competing interests.
Additional information
Peer review information Communications Biology thanks Christopher Barratt and the other, anonymous, reviewers for their contribution to the peer review of this work. Primary Handling Editors: Michelle Lawing and Caitlin Karniski.
Publisher’s note Springer Nature remains neutral with regard to jurisdictional claims in published maps and institutional affiliations.
Rights and permissions
Open Access This article is licensed under a Creative Commons Attribution 4.0 International License, which permits use, sharing, adaptation, distribution and reproduction in any medium or format, as long as you give appropriate credit to the original author(s) and the source, provide a link to the Creative Commons license, and indicate if changes were made. The images or other third party material in this article are included in the article’s Creative Commons license, unless indicated otherwise in a credit line to the material. If material is not included in the article’s Creative Commons license and your intended use is not permitted by statutory regulation or exceeds the permitted use, you will need to obtain permission directly from the copyright holder. To view a copy of this license, visit http://creativecommons.org/licenses/by/4.0/.
About this article

Cite this article
Teixeira, H., Montade, V., Salmona, J. et al. Past environmental changes affected lemur population dynamics prior to human impact in Madagascar. Commun Biol 4, 1084 (2021). https://doi.org/10.1038/s42003-021-02620-1
Received:
Accepted:
Published:
DOI: https://doi.org/10.1038/s42003-021-02620-1
This article is cited by
-
Past volcanic activity predisposes an endemic threatened seabird to negative anthropogenic impacts
Scientific Reports (2024)
-
Zonal control on Holocene precipitation in northwestern Madagascar based on a stalagmite from Anjohibe
Scientific Reports (2024)
-
Cutmarked bone of drought-tolerant extinct megafauna deposited with traces of fire, human foraging, and introduced animals in SW Madagascar
Scientific Reports (2022)
-
Impact of model assumptions on demographic inferences: the case study of two sympatric mouse lemurs in northwestern Madagascar
BMC Ecology and Evolution (2021)
Comments
By submitting a comment you agree to abide by our Terms and Community Guidelines. If you find something abusive or that does not comply with our terms or guidelines please flag it as inappropriate.
