
Abstract
Smartphones are now nearly ubiquitous; their numerous built-in sensors enable continuous measurement of activities of daily living, making them especially well-suited for health research. Researchers have proposed various human activity recognition (HAR) systems aimed at translating measurements from smartphones into various types of physical activity. In this review, we summarized the existing approaches to smartphone-based HAR. For this purpose, we systematically searched Scopus, PubMed, and Web of Science for peer-reviewed articles published up to December 2020 on the use of smartphones for HAR. We extracted information on smartphone body location, sensors, and physical activity types studied and the data transformation techniques and classification schemes used for activity recognition. Consequently, we identified 108 articles and described the various approaches used for data acquisition, data preprocessing, feature extraction, and activity classification, identifying the most common practices, and their alternatives. We conclude that smartphones are well-suited for HAR research in the health sciences. For population-level impact, future studies should focus on improving the quality of collected data, address missing data, incorporate more diverse participants and activities, relax requirements about phone placement, provide more complete documentation on study participants, and share the source code of the implemented methods and algorithms.
Introduction
Progress in science has always been driven by data. More than 5 billion mobile devices were in use in 20201, with multiple sensors (e.g., accelerometer and GPS) that can capture detailed, continuous, and objective measurements on various aspects of our lives, including physical activity. Such proliferation in worldwide smartphone adoption presents unprecedented opportunities for the collection of data to study human behavior and health. Along with sufficient storage, powerful processors, and wireless transmission, smartphones can collect a tremendous amount of data on large cohorts of individuals over extended time periods without additional hardware or instrumentation.
Smartphones are promising data collection instruments for objective and reproducible quantification of traditional and emerging risk factors for human populations. Behavioral risk factors, including but not limited to sedentary behavior, sleep, and physical activity, can all be monitored by smartphones in free-living environments, leveraging the personal or lived experiences of individuals. Importantly, unlike some wearable activity trackers2, smartphones are not a niche product but instead have become globally available, increasingly adopted by users of all ages both in advanced and emerging economies3,4. Their adoption in health research is further supported by encouraging findings made with other portable devices, primarily wearable accelerometers, which have demonstrated robust associations between physical activity and health outcomes, including obesity, diabetes, various cardiovascular diseases, mental health, and mortality5,6,7,8,9. However, there are some important limitations to using wearables for studying population health: (1) their ownership is much lower than that of smartphones10; (2) most people stop using their wearables after 6 months of use11; and (3) raw data are usually not available from wearable devices. The last point often forces investigators to rely on proprietary device metrics, which lowers the already low rate of reproducibility of biomedical research in general12 and makes uncertainty quantification in the measurements nearly impossible.
Human activity recognition (HAR) is a process aimed at the classification of human actions in a given period of time based on discrete measurements (acceleration, rotation speed, geographical coordinates, etc.) made by personal digital devices. In recent years, this topic has been proliferating within the machine learning research community; at the time of writing, over 400 articles had been published on HAR methods using smartphones. This is a substantial increase from just a handful of articles published a few years earlier (Fig. 1). As data collection using smartphones becomes easier, analysis of the collected data is increasingly identified as the main bottleneck in health research13,14,15. To tackle the analytical challenges of HAR, researchers have proposed various algorithms that differ substantially in terms of the type of data they use, how they manipulate the collected data, and the statistical approaches used for inference and/or classification. Published studies use existing methods and propose new methods for the collection, processing, and classification of activities of daily living. Authors commonly discuss data filtering and feature selection techniques and compare the accuracy of various machine learning classifiers either on previously existing datasets or on datasets they have collected de novo for the purposes of the specific study. The results are typically summarized using classification accuracy within different groups of activities, such as ambulation, locomotion, and exercise.
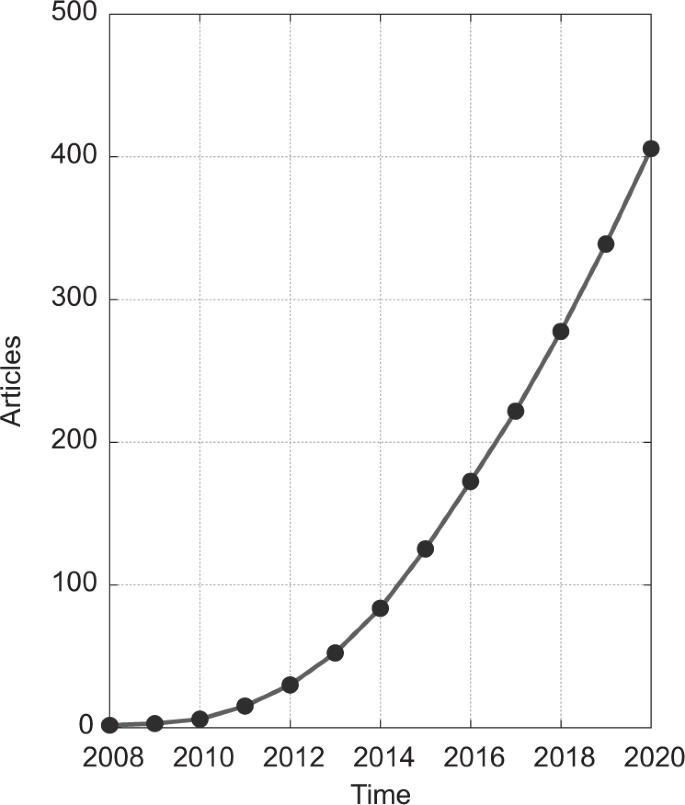
Articles were published between January 2008 and December 2020, based on a search of PubMed, Scopus, and Web of Science databases (for details, see “Methods”).
To successfully incorporate developments in HAR into research in public health and medicine, there is a need to understand the approaches that have been developed and identify their potential limitations. Methods need to accommodate physiological (e.g., weight, height, age) and habitual (e.g., posture, gait, walking speed) differences of smartphone users, as well as differences in the built environment (e.g., buildings and green spaces) that provide the physical and social setting for human activities. Moreover, the data collection and statistical approaches typically used in HAR may be affected by location (where the user wears the phone on their body) and orientation of the device16, which complicates the transformation of collected data into meaningful and interpretable outputs.
In this paper, we systematically review the emerging literature on the use of smartphones for HAR for health research in free-living settings. Given that the main challenge in this field is shifting from data collection to data analysis, we focus our analysis on the approaches used for data acquisition, data preprocessing, feature extraction, and activity classification. We provide insight into the complexity and multidimensionality of HAR utilizing smartphones, the types of data collected, and the methods used to translate digital measurements into human activities. We discuss the generalizability and reproducibility of approaches, i.e., the features that are essential and applicable to large and diverse cohorts of study participants. Lastly, we identify challenges that need to be tackled to accelerate the wider utilization of smartphone-based HAR in public health studies.
Methods
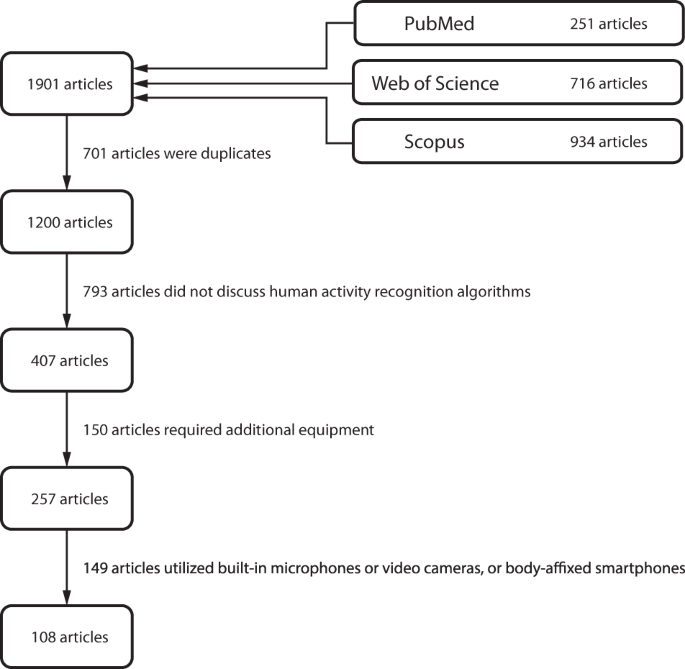
Our systematic review was conducted by searching for articles published up to December 31, 2020, on PubMed, Scopus, and Web of Science databases. The databases were screened for titles, abstracts, and keywords containing phrases “activity” AND (“recognition” OR “estimation” OR “classification”) AND (“smartphone” OR “cell phone” OR “mobile phone”). The search was limited to full-length journal articles written in English. After removing duplicates, we read the titles and abstracts of the remaining publications. Studies that did not investigate HAR approaches were excluded from further screening. We then filtered out studies that employed auxiliary equipment, like wearable or ambient devices, and studies that required carrying multiple smartphones. Only studies that made use of commercially available consumer-grade smartphones (either personal or loaner) were read in full. We excluded studies that used the smartphone microphone or video camera for activity classification as they might record information about an individual’s surroundings, including information about unconsented individuals, and thus hinder the large-scale application of the approach due to privacy concerns. To focus on studies that mimicked free-living settings, we excluded studies that utilized devices strapped or glued to the body in a fixed position.
Results
Our search resulted in 1901 hits for the specified search criteria (Fig. 2). After removal of articles that did not discuss HAR algorithms (n = 793), employed additional hardware (n = 150), or utilized microphones, cameras, or body-affixed smartphones (n = 149), there were 108 references included in this review.
The search was conducted in PubMed, Scopus, and Web of Science databases and included full-length peer-reviewed articles written in English. The search was carried out on January 2, 2021.
Most HAR approaches consist of four stages: data acquisition, data preprocessing, feature extraction, and activity classification (Fig. 3). Here, we provide an overview of these steps and briefly point to significant methodological differences among the reviewed studies for each step. Figure 4 summarizes specific aspects of each study. Of note, we decomposed data acquisition processes into sensor type, experimental environment, investigated activities, and smartphone location; we indicated which studies preprocessed collected measurements using signal correction methods, noise filtering techniques, and sensor orientation-invariant transformations; we marked investigations based on the types of signal features they extracted, as well as the feature selection approaches used; we indicated the adopted activity classification principles, utilized classifiers, and practices for accuracy reporting; and finally, we highlighted efforts supporting reproducibility and generalizability of the research. Before diving into these technical considerations, we first provide a brief description of study populations.

The map displays common aspects of HAR systems together with their operational definitions. The methodological differences between the reviewed studies are highlighted in Figure 4.

The columns correspond to the 108 reviewed studies and the rows correspond to different technical aspects of each study. Cells marked with a cross (x) indicate that the given study used the given method, algorithm, or approach. Rows have been grouped to correspond to different stages of HAR, such as data processing, and color shading of rows indicates how frequently a particular aspect is present among the studies (darker shade corresponds to higher frequency).
Study populations
We use the term study population to refer to the group of individuals investigated in any given study. In the reviewed studies, data were usually collected from fewer than 30 individuals, although one larger study analyzed data from 440 healthy individuals17. Studies often included healthy adults in their 20s and 30s, with only a handful of studies involving older individuals. Most studies did not report the full distribution of ages, only the mean age or the age range of participants (Fig. 5). To get a sense of the distribution of participant ages, we attempted to reconstruct an overall approximate age distribution by assuming that the participants in each study are evenly distributed in age between the minimum and maximum ages, which may not be the case. A comparison of the reconstructed age distribution of study participants with nationwide age distributions clearly demonstrates that future HAR research in health settings needs to broaden the age spectrum of the participants. Less effort was devoted in the studies to investigating populations with different demographic and disease characteristics, such as elders18,19,20 and individuals with Parkinson’s disease21.

Panel a displays age of the population corresponding to individual studies, typically described by its range (lines) or mean (dots). Panel b displays the reconstructed age distribution in the reviewed studies (see the text). Nationwide age distributions displayed in panel c of three countries offer a stark contrast with the reconstructed distribution of study participant ages.
Data acquisition
We use the term data acquisition to refer to a process of collecting and storing raw sub-second-level smartphone measurements for the purpose of HAR. The data are typically collected from individuals by an application that runs on the device and samples data from built-in smartphone sensors according to a predefined schedule. We carefully examined the selected literature for details on the investigated population, measurement environment, performed activities, and smartphone settings.
In the reviewed studies, data acquisition typically took place in a research facility and/or nearby outdoor surroundings. In such environments, study participants were asked to perform a series of activities along predefined routes and to interact with predefined objects. The duration and order of performed activities were usually determined by the study protocol and the participant was supervised by a research team member. A less common approach involved observation conducted in free-living environments, where individuals performed activities without specific instructions. Such studies were likely to provide more insight into diverse activity patterns due to individual habits and unpredictable real-life conditions. Compared to a single laboratory visit, studies conducted in free-living environments also allowed investigators to monitor behavioral patterns over many weeks22 or months23.
Activity selection is one of the key aspects of HAR. The studies in our review tended to focus on a small set of activities, including sitting, standing, walking, running, and stair climbing. Less common activities involved various types of mobility, locomotion, fitness, and household routines, e.g., slow, normal, and brisk walking24, multiple transportation modes, such as by car, bus, tram, train, metro, and ferry25, sharp body-turns26, and household activities, like sweeping a floor or walking with a shopping bag27. More recent studies concentrated solely on walking recognition28,29. As shown in Fig. 4, the various measured activities in the reviewed studies can be grouped into classes: “posture” refers to lying, sitting, standing, or any pair of these activities; “mobility” refers to walking, stair climbing, body-turns, riding an elevator or escalator, running, cycling, or any pair of these activities; “locomotion” refers to motorized activities; and “other” refers to various household and fitness activities or singular actions beyond the described groups.
The spectrum of investigated activities determines the choice of sensors used for data acquisition. At the time of writing, a standard smartphone is equipped with a number of built-in hardware sensors and protocols that can be used for activity monitoring, including an accelerometer, gyroscope, magnetometer, GPS, proximity sensor, and light sensor, as well as to collect information on ambient pressure, humidity, and temperature (Fig. 6). Accurate estimation of commonly available sensors over time is challenging given a large number of smartphone manufacturers and models, as well as the variation in their adoption in different countries. Based on global statistics on smartphone market shares30 and specifications of flagship models31, it appears that accelerometer, gyroscope, magnetometer, GPS, and proximity and light sensors were fairly commonly available by 2010. Other smartphone sensors were introduced a couple of years later; for example, the barometer was included in Samsung Galaxy S III released in 2012, and thermometer and hygrometer were included in Samsung Galaxy S4 released in 2013.

Inertial sensors (accelerometer, gyroscope, and magnetometer) provide measurements with respect to the three orthogonal axes (x, y, z) of the body of the phone; the remaining sensors are orientation-invariant.
Our literature review revealed that the most commonly used sensors for HAR are the accelerometer, gyroscope, and magnetometer, which capture data about acceleration, angular velocity, and phone orientation, respectively, and provide temporally dense, high-resolution measurements for distinguishing among activity classes (Fig. 7). Inertial sensors were often used synchronously to provide more insight into the dynamic state of the device. Some studies showed that the use of a single sensor can yield similar accuracy of activity recognition as using multiple sensors in combination32. To alleviate the impact of sensor position, some researchers collected data using the built-in barometer and GPS sensors to monitor changes in altitude and geographic location33,34,35. Certain studies benefited from using the broader set of capabilities of smartphones; for example, some researchers additionally exploited the proximity sensor and light sensor to allow recognition of a measurement’s context, e.g., the distance between a smartphone and the individual’s body, and changes between in-pocket and out-of-pocket locations based on changes in illumination36,37. The selection of sensors was also affected by secondary research goals, such as simplicity of classification and minimization of battery drain. In these studies, data acquisition was carried out using a single sensor (e.g., accelerometer22), a small group of sensors (e.g., accelerometer and GPS38), or a purposely modified sampling frequency or sampling scheme (e.g., alternating between data collection and non-collection cycles) to reduce the volume of data collected and processed39. Supplementing GPS data with other sensor data was motivated by the limited indoor reception of GPS; satellite signals may be absorbed or attenuated by walls and ceilings17 up to 60% of the time inside buildings and up to 70% of the time in underground trains23.

a A person is sitting by the desk with the smartphone placed in the front pants pocket; b a person is walking normally (~1.9 steps per second) with the smartphone placed in a jacket pocket; c a person is ascending stairs with the smartphone placed in the backpack; d a person is walking slowly (~1.4 steps per second) holding the smartphone in hand; e a person is jogging (~2.8 steps per second) with the smartphone placed in back short’s pocket.
Sampling frequency specifies how many observations are collected by a sensor within a 1-s time interval. The selection of sampling frequency is usually performed as a trade-off between measurement accuracy and battery drain. Sampling frequency in the reviewed studies typically ranged between 20 and 30 Hz for inertial sensors and 1 and 10 Hz for the barometer and GPS. The most significant variations were seen in studies where limited energy consumption was a priority (e.g., accelerometer sampled at 1 Hz40) or if investigators used advanced signal processing methods, such as time-frequency decomposition methods, or activity templates that required higher sampling frequency (e.g., accelerometer sampled at 100 Hz41). Some studies stated that inertial sensors sampled at 20 Hz provided enough information to distinguish between various types of transportation42, while 10 Hz sampling rate was sufficient to distinguish between various types of mobility43. One study demonstrated that reducing the sampling rate from 100 Hz to 12.5 Hz increased the duration of data collection by a factor of three on a single battery charge44.
A crucial parameter in the data acquisition process is the smartphone’s location on the body. This is important mainly because of the nonstationary nature of real-life conditions and the strong effect it has on the smartphone’s inertial sensors. The main challenge in HAR in free-living conditions is that data recorded by the accelerometer, gyroscope, and magnetometer sensors differ between the upper and lower body as the device is not affixed to any specific location or orientation45. Therefore, it is essential that studies collect data from as many body locations as possible to ensure the generalizability of results. In the reviewed literature, study participants were often instructed to carry the device in a pants pocket (either front or back), although a number of studies also considered other placements, such as jacket pocket46, bag or backpack47,48, and holding the smartphone in the hand49 or in a cupholder50.
To establish the ground truth for physical activity in HAR studies, data were usually annotated manually by trained research personnel or by the study participants themselves51,52. However, we also noted several approaches that automated this process both in controlled and free-living conditions, e.g., through a designated smartphone application22 or built-in step counter combined paired with GPS data53., used a built-in step counter and GPS data to produce “weak” labels. The annotation was also done using the built-in microphone54, video camera18,20, or an additional body-worn sensor29.
Finally, the data acquisition process in the reviewed studies was carried out on purposely designed applications that captured data. In studies with online activity classification, the collected data did not leave the device, but instead, the entire HAR pipeline was implemented on the smartphone; in contrast, studies using offline classification transmitted data to an external (remote) server for processing using a cellular, Wi-Fi, Bluetooth, or wired connection.
Data preprocessing
We use the term data preprocessing to refer to a collection of procedures aimed at repairing, cleaning, and transforming measurements recorded for HAR. The need for such step is threefold: (1) measurement systems embedded in smartphones are often less stable than research-grade data acquisition units, and the data might therefore be sampled unevenly or there might be missingness or sudden spikes that are unrelated to an individual’s actual behavior; (2) the spatial orientation (how the phone is situated in a person’s pocket, say) of the device influences tri-axial measurements of inertial sensors, thus potentially degrading the performance of the HAR system; and (3) despite careful planning and execution of the data acquisition stage, data quality may be compromised due to other unpredictable factors, e.g., lack of compliance by the study participants, unequal duration of activities in the measurement (i.e., dataset imbalance), or technological issues.
In our literature review, the first group of obstacles was typically addressed using signal processing techniques (in Fig. 4, see “standardization”). For instance, to alleviate the mismatch between requested and effective sampling frequency, researchers proposed the use of linear interpolation55 or spline interpolation56 (Fig. 8). Such procedures were imposed on a range of affected sensors, typically the accelerometer, gyroscope, magnetometer, and barometer. Further time-domain preprocessing considered data trimming, carried out to remove unwanted data components. For this purpose, the beginning and end of each activity bout, a short period of activity of a specified kind, were clipped as nonrepresentative for the given activity46. During this stage, the researchers also dealt with dataset imbalance, which occurs when there are different numbers of observations for different activity classes in the training dataset. Such a situation makes the classifier susceptible to overfitting in favor of the larger class; in the reviewed studies, this issue was resolved using up-sampling or down-sampling of data17,57,58,59. In addition, the measurements were processed for high-frequency noise cancellation (i.e., “denoising”). The literature review identified several methods suitable for this task, including the use of low-pass finite impulse response filters (with a cutoff frequency typically equal to 10 Hz for inertial sensors and 0.1 Hz for barometers)60,61, which remove the portion of the signal that is unlikely to result from the activities of interest; weighted moving average55; moving median45,62; and singular-value decomposition63. GPS data were sometimes de-noised based on the maximum allowed positional accuracy64.

Standardization includes relabeling (a), when labels are reassigned to better match transitions between activities; trimming (b), when part of the signal is removed to balance the dataset for system training; interpolation (c), when missing data are filled in based on adjacent observations; and denoising (d), when the signal is filtered from redundant components. The transformation includes normalization (e), when the signal is normalized to unidimensional vector magnitude; rotation (f), when the signal is rotated to a different coordinate system; and separation (g), when the signal is separated into linear and gravitational components. Raw accelerometer data are shown in gray, and preprocessed data are shown using different colors.
Another element of data preprocessing considers device orientation (in Fig. 4, see “transformation”). Smartphone measurements are sensitive to device orientation, which may be due to clothing, body shape, and movement during dynamic activities57. One of the popular solutions reported in the literature was to transform the three-dimensional signal into a univariate vector magnitude that is invariant to rotations and more robust to translations. This procedure was often applied to accelerometer, gyroscope, and magnetometer data. Accelerometer data were also subjected to digital filtering by separating the signal into linear (related to body motions) and gravitational (related to device spatial orientation) acceleration65. This separation was typically performed using a high-pass Butterworth filter of low order (e.g., order 3) with a cutoff frequency below 1 Hz. Other approaches transformed tri-axial into bi-axial measurement with horizontal and vertical axes49, or projected the data from the device coordinate system into a fixed coordinate system (e.g., the coordinate system of a smartphone that lies flat on the ground) using a rotation matrix (Euler angle-based66 or quaternion47,67).
Feature extraction
We use the term feature extraction to refer to a process of selecting and computing meaningful summaries of smartphone data for the goal of activity classification. A typical extraction scheme includes data visualization, data segmentation, feature selection, and feature calculation. A careful feature extraction step allows investigators not only to understand the physical nature of activities and their manifestation in digital measurements, but also, and more importantly, to help uncover hidden structures and patterns in the data. The identified differences are later quantified through various statistical measures to distinguish between activities. In an alternative approach, the process of feature extraction is automated using deep learning, which handles feature selection using simple signal processing units, called neurons, that have been arranged in a network structure that is multiple layers deep59,68,69,70. As with many applications of deep learning, the results may not be easily interpretable.
The conventional approach to feature extraction begins with data exploration. For this purpose, researchers in our reviewed studies employed various graphical data exploration techniques like scatter plots, lag plots, autocorrelation plots, histograms, and power spectra71. The choice of tools was often dictated by the study objectives and methods. For example, research on inertial sensors typically presented raw three-dimensional data from accelerometers, gyroscopes, and magnetometers plotted for the corresponding activities of standing, walking, and stair climbing50,72,73. Acceleration data were often inspected in the frequency domain, particularly to observe periodic motions of walking, running, and cycling45, and the impact of the external environment, like natural vibration frequencies of a bus or a subway74. Locomotion and mobility were investigated using estimates of speed derived from GPS. In such settings, investigators calculated the average speed of the device and associated it with either the group of motorized (car, bus, train, etc.) or non-motorized (walking, cycling, etc.) modes of transportation.
In the next step, measurements are divided into smaller fragments (also, segments or epochs) and signal features are calculated for each fragment (Fig. 9). In the reviewed studies, this segmentation was typically conducted using a windowing technique that allows consecutive windows to overlap. The window size usually had a fixed length that varied from 1 to 5 s, while the overlap of consecutive windows was often set to 50%. Several studies that investigated the optimal window size supported this common finding: short windows (1–2 s) were sufficient for recognizing posture and mobility, whereas somewhat longer windows (4–5 s) had better classification performance75,76,77. Even longer windows (10 s or more) were recommended for recognizing locomotion modes or for HAR systems employing frequency-domain features calculated with the Fourier transform (resolution of the resulting frequency spectrum is inversely proportional to window length)42. In principle, this calibration aims to closely match the window size with the duration of a single instance of the activity (e.g., one step). Similar motivation led researchers to seek more adaptive segmentation methods. One idea was to segment data based on specific time-domain events, like zero-cross points (when the signal changes value from positive to negative or vice versa), peak points (local maxima), or valley points (local minima), which represent the start and endpoints of a particular activity bout55,57. This allowed for segments to have different lengths corresponding to a single fundamental period of the activity in question. Such an approach was typically used to recognize quasiperiodic activities like walking, running, and stair climbing63.

An analyzed measurement (a) is segmented into smaller fragments using a sliding window (b). Depending on the approach, each segment may then be used to compute time-domain (c) or frequency-domain features (d), but also it may serve as the activity template (e), or as input for deep learning networks that compute hidden (“deep”) features (f). The selected feature extraction approach determines the activity classifier: time- and frequency-domain features are paired with machine learning classifiers (g) and activity templates are investigated using distance metrics (h), while deep features are computed within embedded layers of convolutional neural networks (i).
The literature described a large variety of signal features used for HAR, which can be divided into several categories based on the initial signal processing procedure. This enables one to distinguish between activity templates (i.e., raw signal), deep features (i.e., hidden features calculated within layers of deep neural networks), time-domain features (i.e., statistical measures of time-series data), and frequency-domain features (i.e., statistical measures of frequency representation of time-series data). The most popular features in the reviewed papers were calculated from time-domain signals as descriptive statistics, such as local mean, variance, minimum and maximum, interquartile range, signal energy (defined as the area under the squared magnitude of the considered continuous signal), and higher-order statistics. Other time-domain features included mean absolute deviation, mean (or zero) crossing rate, regression coefficients, and autocorrelation. Some studies described novel and customized time-domain features, like histograms of gradients78, and the number of local maxima and minima, their amplitude, and the temporal distance between them39. Time-domain features were typically calculated over each axis of the three-dimensional measurement or orientation-invariant vector magnitude. Studies that used GPS also calculated average speed64,79,80, while studies that used the barometer analyzed the pressure derivative81.
Signals transformed to the frequency domain were less exploited in the literature. A commonly performed signal decomposition used the fast Fourier transform (FFT)82,83, an algorithm that converts a temporal sequence of samples to a sequence of frequencies present in that sample. The essential advantage of frequency-domain features over time-domain features is their ability to identify and isolate certain periodic components of performed activities. This enabled researchers to estimate (kinetic) energy within particular frequency bands associated with human activities, like gait and running51, as well as with different modes of locomotion74. Other frequency-domain features included spectral entropy and parameters of the dominant peak, e.g., its frequency and amplitude.
Activity templates function essentially as blueprints for different types of physical activity. In the HAR systems, we reviewed, these templates were compared to patterns of observed raw measurements using various distance metrics38,84, such as the Euclidean or Manhattan distance. Given the heterogeneous nature of human activities, activity templates were often enhanced using techniques similar to dynamic time warping29,57, which measures the similarity of two temporal sequences that may vary in speed. As an alternative to raw measurements, some studies used signal symbolic approximation, which translates a segmented time-series signal into sequences of symbols based on a predefined mapping rule (e.g., amplitude between −1 and −0.5 g represents symbol “a”, amplitude between −0.5 and 0 g represents symbol “b”, and so on)85,86,87.
More recent studies utilized deep features. In these approaches, smartphone data were either fed to deep neural networks as raw univariate or multivariate time series35,48,60 or preprocessed into handcrafted time- and frequency-domain feature vectors82,83. Within the network layers, the input data were then transformed (e.g., using convolution) to produce two-dimensional activation maps that revealed hidden spatial relations between axes and sensors specific to a given activity. To improve the resolution of input data, one study proposed to split the integer and decimal values of accelerometer measurements41.
In the reviewed articles, the number of extracted features typically varied from a few to a dozen. However, some studies purposely calculated too many features (sometimes hundreds) and let the analytical method perform variable selection, i.e., identify those features that were most informative for HAR88. Support vector machines81,89, gain ratio43, recursive feature elimination38, correlation-based feature selection51, and principal component analysis90 were among the popular feature selection/dimension reduction methods used.
Activity classification
We use the term activity classification to refer to a process of associating extracted features with particular activity classes based on the adopted classification principle. The classification is typically performed by a supervised learning algorithm that has been trained to recognize patterns between features and labeled physical activities in the training dataset. The fitted model is then validated on separate observations, using a validation dataset, usually data obtained from the same group of study participants. The comparison between predictions made by the model and the known true labels allows one to assess the accuracy of the approach. This section summarizes the methods used in classification and validation, and also provides some insights into reporting on HAR performance.
The choice of classifier aims to identify a method that has the highest classification accuracy for the collected datasets and for the given data processing environment (e.g., online vs. offline). The reviewed literature included a broad range of classifiers, from simple decision trees18, k-nearest neighbors65, support vector machines91,92,93, logistic regression21, naïve Bayes94, and fuzzy logic64 to ensemble classifiers such as random forest76, XGBoost95, AdaBoost45,96, bagging24, and deep neural networks48,60,82,97,98,99. Simple classifiers were frequently compared to find the best solution in the given measurement scenario43,53,100,101,102. A similar type of analysis was implemented for ensemble classifiers79. Incremental learning techniques were proposed to adapt the classification model to new data streams and unseen activities103,104,105. Other semi-supervised approaches were proposed to utilize unlabeled data to improve the personalization of HAR systems106 and data annotation53,70. To increase the effectiveness of HAR, some studies used a hierarchical approach, where the classification was performed in separate stages and each stage could use a different classifier. The multi-stage technique was used for gradual decomposition of activities (coarse-grained first, then fine-grained)22,37,52,60 and to handle the predicament of changing sensor location (body location first, then activity)91. Multi-instance multi-label approaches were adapted for the classification of complex activities (i.e., activities that consist of several basic activities)62,107 as well as for recognition of basic activities paired with different sensor locations108.
Classification accuracy could also be improved by using post-processing, which relies on modifying the initially assigned label using the rules of logic and probability. The correction was typically performed based on activity duration74, activity sequence25, and activity transition probability and classification confidence80,109.
The selected method is typically cross-validated, which splits the collected dataset into two or more parts—training and testing—and only uses the part of the data for testing that was not used for training. The literature mentions a few cross-validation procedures, with k-fold and leave-one-out cross-validation being the most common110. Popular train-test proportions were 90–10, 70–30, and 60–40. A validation is especially valuable if it is performed using studies with different demographics and smartphone use habits. Such an approach allows one to understand the generalizability of the HAR system to real-life conditions and populations. We found a few studies that followed this validation approach18,21,71.
Activity classification is the last stage of HAR. In our review, we found that analysis results were typically reported in terms of classification accuracy using various standard metrics like precision, recall, and F-score. Overall, the investigated studies reported very high classification accuracies, typically above 95%. Several comparisons revealed that ensemble classifiers tended to outperform individual or single classifiers27,77, and deep-learning classifiers tended to outperform both individual and ensemble classifiers48. More nuanced summaries used the confusion matrix, which allows one to examine which activities are more likely to be classified incorrectly. This approach was particularly useful for visualizing classification differences between similar activities, such as normal and fast walking or bus and train riding. Additional statistics were usually provided in the context of HAR systems designed to operate on the device. In this case, activity classification needed to be balanced among acceptable classifier performance, processing time, and battery drain44. The desired performance optimum was obtained by making use of dataset remodeling (e.g., by replacing the oldest observations with the newest ones), low-cost classification algorithms, limited preprocessing, and conscientious feature selection45,86. Computation time was sometimes reported for complex methods, such as deep neural networks20,82,111 and extreme learning machine112, as well as for symbolic representation85,86 and in comparative analyses46. A comprehensive comparison of results was difficult or impossible, as discussed below.
Discussion
Over the past decade, many studies have investigated HAR using smartphones. The reviewed literature provides detailed descriptions of essential aspects of data acquisition, data preprocessing, feature extraction, and activity classification. Studies were conducted with one or more objectives, e.g., to limit technological imperfections (e.g., no GPS signal reception indoors), to minimize computational requirements (e.g., for online processing of data directly on the device), and to maximize classification accuracy (all studies). Our review summarizes the most frequently used methods and offers available alternatives.
As expected, no single activity recognition procedure was found to work in all settings, which underlines the importance of designing methods and algorithms that address specific research questions in health while keeping the specifics of the study cohort in mind (e.g., age distribution, the extent of device use, and nature of disability). While datasets were usually collected in laboratory settings, there was little evidence that algorithms trained using data collected in these controlled settings could be generalized to free-living conditions113,114. In free-living settings, duration, frequency, and specific ways of performing any activity are subject to context and individual ability, and these degrees of freedom need to be considered in the development of HAR systems. Validation of these data in free-living settings is essential, as the true value of HAR systems for public health will come through transportable and scalable applications in large, long-term observational studies or real-world interventions.
Some studies were conducted with a small number of able-bodied volunteers. This makes the process of data handling and classification easier but also limits the generalizability of the approach to more diverse populations. The latter point was well demonstrated in two of the investigated studies. In the first study, the authors observed that the performance of a classifier trained on a young cohort significantly decreases if validated on an older cohort18. Similar conclusions can be drawn from the second study, where the observations on healthy individuals did not replicate in individuals with Parkinson’s disease21. These facts highlight the role of algorithmic fairness (or fairness of machine learning), the notion that the performance of an algorithm should not depend on variables considered sensitive, such as race, ethnicity, sexual orientation, age, and disability. A highly visible example of this was the decision of some large companies, including IBM, to stop providing facial recognition technology to police departments for mass surveillance115, and the European Commission has considered a ban on the use of facial recognition in public spaces116. These decisions followed findings demonstrating the poor performance of facial recognition algorithms when applied to individuals with dark-skin tones.
The majority of the studies we reviewed utilized stationary smartphones at a single-body position (i.e., a specific pants pocket), sometimes even with a fixed orientation. However, such scenarios are rarely observed in real-life settings, and these types of studies should be considered more as proofs of concept. Indeed, as demonstrated in several studies, inertial sensor data might not share similar features across body locations49,117, and smartphone orientation introduces additional artifacts to each axis of measurement which make any distribution-based features (e.g., mean, range, skewness) difficult to use without appropriate data preprocessing. Many studies provided only incomplete descriptions of the experimental setup and study protocol and provided few details on demographics, environmental context, and the details of the performed activities. Such information should be reported as fully and accurately as possible.
Only a few studies considered classification in a context that involves activities outside the set of activities the system was trained on; for example, if the system was trained to recognize walking and running, these were the only two activities that the system was later tested on. However, real-life activities are not limited to a prescribed set of behaviors, i.e., we do not just sit still, stand still, walk, and climb stairs. These classifiers, when applied to free-living conditions, will naturally miss the activities they were not trained on but will also likely overestimate those activities they were trained on. An improved scheme could assume that the observed activities are a sample from a broader spectrum of possible behaviors, including periods when the smartphone is not on a person, or assess the uncertainty associated with the classification of each type of activity84. This could also provide for an adaptive approach that would enable observation/interventions suited to a broad range of activities relevant for health, including decreasing sedentary behavior, increasing active transport (i.e., walking, bicycling, or public transit), and improving circadian patterns/sleep.
The use of personal digital devices, in particular smartphones, makes it possible to follow large numbers of individuals over long periods of time, but invariably investigators need to consider approaches to missing sensor data, which is a common problem. The importance of this problem is illustrated in a recent paper that introduced a resampling approach to imputing missing smartphone GPS data; the authors found that relative to linear interpolation—the naïve approach to missing spatial data—imputation resulted in a tenfold reduction in the error averaged across all daily mobility features118. On the flip side of missing data is the need to propagate uncertainty, in a statistically principled way, from the gaps in the raw data to the inferences that investigators wish to draw from the data. It is a common observation that different people use their phones differently, and some may barely use their phones at all; the net result is not that the data collected from these individuals are not useful, but instead the data are less informative about the behavior of this individual than they ideally might be. Dealing with missing data and accounting for the resulting uncertainty is important because it means that one does not have to exclude participants from a study because their data fail meet some arbitrary threshold of completeness; instead, everyone counts, and every bit of data from each individual counts.
The collection of behavioral data using smartphones understandably raises concerns about privacy; however, investigators in health research are well-positioned to understand and address these concerns given that health data are generally considered personal and private in nature. Consequently, there are established practices and common regulations on human subjects’ research, where informed consent of the individual to participate is one of the key foundations of any ethically conducted study. Federated learning is a machine learning technique that can be used to train an algorithm across decentralized devices, here smartphones, using only local data (data from the individual) and without the need to exchange data with other devices. This approach appears at first to provide a powerful solution to the privacy problem: the personal data never leave the person’s phone and only the outputs of the learning process, generally parameter estimates, are shared with others. This is where the tension between privacy and the need for reproducible research arises, however. The reason for data collection is to produce generalizable knowledge, but according to an often-cited study, 65% of medical studies were inconsistent when retested and only 6% were completely reproducible12. In the studies reviewed here, only 4 out of 108 made the source code or the methods used in the study publicly available. For a given scientific question, studies that are not replicable require the collection of more private and personal data; this highlights the importance of reproducibility of studies, especially in health, where there are both financial and ethical considerations when conducting research. If federated learning provides no possibility to confirm data analyses, to re-analyze data using different methods, or to pool data across studies, it by itself cannot be the solution to the privacy problem. Nevertheless, the technique may act as inspiration for developing privacy-preserving methods that also enable future replication of studies. One possibility is to use publicly available datasets (Table 1). If sharing of source code were more common, HAR methods could be tested on these publicly available datasets, perhaps in a similar way as datasets of handwritten digits are used to test classification methods in machine learning research. Although some efforts have been made in this area42,119,120,121, the recommended course of action assumes collecting and analyzing data from a large spectrum of sensors on diverse and understudied populations and validating classifiers against widely accepted gold standards.
When accurate, reproducible, and transportable methods coalesce to recognize a range of relevant activity patterns, smartphone-based HAR approaches will provide a fundamental tool for public health researchers and practitioners alike. We hope that this paper has provided to the reader some insights into how smartphones may be used to quantify human behavior in health research and the complexities that are involved in the collection and analysis of such data in this challenging but important field.
Data availability
Aggregated data analyzed in this study are available from the corresponding author upon request.
Code availability
Scripts used to process the aggregated data are available from the corresponding author upon request.
References
Association, G. The mobile economy 2020. https://www.gsma.com/mobileeconomy/wp-content/uploads/2020/03/GSMA_MobileEconomy2020_Global.pdf (2020).
Mercer, K. et al. Acceptance of commercially available wearable activity trackers among adults aged over 50 and with chronic illness: a mixed-methods evaluation. JMIR mHealth uHealth 4, e7 (2016).
Anderson, M. & Perrin, A. Tech adoption climbs among older adults. http://www.pewinternet.org/wp-content/uploads/sites/9/2017/05/PI_2017.05.17_Older-Americans-Tech_FINAL.pdf (2017).
Taylor, K. & Silver, L. Smartphone ownership is growing rapidly around the world, but not always equally. http://www.pewresearch.org/global/wp-content/uploads/sites/2/2019/02/Pew-Research-Center_Global-Technology-Use-2018_2019-02-05.pdf (2019).
Cooper, A. R., Page, A., Fox, K. R. & Misson, J. Physical activity patterns in normal, overweight and obese individuals using minute-by-minute accelerometry. Eur. J. Clin. Nutr. 54, 887–894 (2000).
Ekelund, U., Brage, S., Griffin, S. J. & Wareham, N. J. Objectively measured moderate- and vigorous-intensity physical activity but not sedentary time predicts insulin resistance in high-risk individuals. Diabetes Care 32, 1081–1086 (2009).
Legge, A., Blanchard, C. & Hanly, J. G. Physical activity, sedentary behaviour and their associations with cardiovascular risk in systemic lupus erythematosus. Rheumatology https://doi.org/10.1093/rheumatology/kez429 (2019).
Loprinzi, P. D., Franz, C. & Hager, K. K. Accelerometer-assessed physical activity and depression among U.S. adults with diabetes. Ment. Health Phys. Act. 6, 79–82 (2013).
Smirnova, E. et al. The predictive performance of objective measures of physical activity derived from accelerometry data for 5-year all-cause mortality in older adults: National Health and Nutritional Examination Survey 2003–2006. J. Gerontol. Ser. A https://doi.org/10.1093/gerona/glz193 (2019).
Wigginton, C. Global Mobile Consumer Trends, 2nd edition. Deloitte, https://www2.deloitte.com/content/dam/Deloitte/us/Documents/technology-media-telecommunications/us-global-mobile-consumer-survey-second-edition.pdf (2017).
Coorevits, L. & Coenen, T. The rise and fall of wearable fitness trackers. Acad. Manag. 2016, https://doi.org/10.5465/ambpp.2016.17305abstract (2016).
Prinz, F., Schlange, T. & Asadullah, K. Believe it or not: how much can we rely on published data on potential drug targets? Nat. Rev. Drug Discov. 10, 712 (2011).
Kubota, K. J., Chen, J. A. & Little, M. A. Machine learning for large-scale wearable sensor data in Parkinson’s disease: concepts, promises, pitfalls, and futures. Mov. Disord. 31, 1314–1326 (2016).
Iniesta, R., Stahl, D. & McGuffin, P. Machine learning, statistical learning and the future of biological research in psychiatry. Psychol. Med. 46, 2455–2465 (2016).
Kuehn, B. M. FDA’s foray into big data still maturing. J. Am. Med. Assoc. 315, 1934–1936 (2016).
Straczkiewicz, M., Glynn, N. W. & Harezlak, J. On placement, location and orientation of wrist-worn tri-axial accelerometers during free-living measurements. Sensors 19, 2095 (2019).
Esmaeili Kelishomi, A., Garmabaki, A. H. S., Bahaghighat, M. & Dong, J. Mobile user indoor-outdoor detection through physical daily activities. Sensors 19, 511 (2019).
Del Rosario, M. B. et al. A comparison of activity classification in younger and older cohorts using a smartphone. Physiol. Meas. 35, 2269–2286 (2014).
Del Rosario, M. B., Lovell, N. H. & Redmond, S. J. Learning the orientation of a loosely-fixed wearable IMU relative to the body improves the recognition rate of human postures and activities. Sensors 19, 2845 (2019).
Nan, Y. et al. Deep learning for activity recognition in older people using a pocket-worn smartphone. Sensors 20, 7195 (2020).
Albert, M. V., Toledo, S., Shapiro, M. & Kording, K. Using mobile phones for activity recognition in Parkinson’s patients. Front. Neurol. 3, 158 (2012).
Liang, Y., Zhou, X., Yu, Z. & Guo, B. Energy-efficient motion related activity recognition on mobile devices for pervasive healthcare. Mob. Netw. Appl. 19, 303–317 (2014).
Gjoreski, H. et al. The university of Sussex-Huawei locomotion and transportation dataset for multimodal analytics with mobile devices. IEEE Access 6, 42592–42604 (2018).
Wu, W., Dasgupta, S., Ramirez, E. E., Peterson, C. & Norman, G. J. Classification accuracies of physical activities using smartphone motion sensors. J. Med. Internet Res. 14, e130 (2012).
Guvensan, M. A., Dusun, B., Can, B. & Turkmen, H. I. A novel segment-based approach for improving classification performance of transport mode detection. Sensors 18, 87 (2018).
Pei, L. et al. Human behavior cognition using smartphone sensors. Sensors 13, 1402–1424 (2013).
Della Mea, V., Quattrin, O. & Parpinel, M. A feasibility study on smartphone accelerometer-based recognition of household activities and influence of smartphone position. Inform. Heal. Soc. Care 42, 321–334 (2017).
Klein, I. Smartphone location recognition: a deep learning-based approach. Sensors 20, 214 (2020).
Casado, F. E. et al. Walking recognition in mobile devices. Sensors 20, 1189 (2020).
O’Dea, S. Global smartphone market share worldwide by vendor 2009–2020. https://www.statista.com/statistics/271496/global-market-share-held-by-smartphone-vendors-since-4th-quarter-2009/ (2021).
GSMArena. https://www.gsmarena.com/ (2021). Accessed 24 March 2021.
Shoaib, M., Bosch, S., Durmaz Incel, O., Scholten, H. & Havinga, P. J. M. Fusion of smartphone motion sensors for physical activity recognition. Sensors 14, 10146–10176 (2014).
Vanini, S., Faraci, F., Ferrari, A. & Giordano, S. Using barometric pressure data to recognize vertical displacement activities on smartphones. Comput. Commun. 87, 37–48 (2016).
Wan, N. & Lin, G. Classifying human activity patterns from smartphone collected GPS data: a fuzzy classification and aggregation approach. Trans. GIS 20, 869–886 (2016).
Gu, Y., Li, D., Kamiya, Y. & Kamijo, S. Integration of positioning and activity context information for lifelog in urban city area. Navigation 67, 163–179 (2020).
Miao, F., He, Y., Liu, J., Li, Y. & Ayoola, I. Identifying typical physical activity on smartphone with varying positions and orientations. Biomed. Eng. Online 14, 32 (2015).
Lee, Y.-S. & Cho, S.-B. Layered hidden Markov models to recognize activity with built-in sensors on Android smartphone. Pattern Anal. Appl. 19, 1181–1193 (2016).
Martin, B. D., Addona, V., Wolfson, J., Adomavicius, G. & Fan, Y. Methods for real-time prediction of the mode of travel using smartphone-based GPS and accelerometer data. Sensors 17, 2058 (2017).
Oshin, T. O., Poslad, S. & Zhang, Z. Energy-efficient real-time human mobility state classification using smartphones. IEEE Trans. Comput. 64, 1680–1693 (2015).
Shin, D. et al. Urban sensing: Using smartphones for transportation mode classification. Comput. Environ. Urban Syst. 53, 76–86 (2015).
Hur, T. et al. Iss2Image: a novel signal-encoding technique for CNN-based human activity recognition. Sensors 18, 3910 (2018).
Gjoreski, M. et al. Classical and deep learning methods for recognizing human activities and modes of transportation with smartphone sensors. Inf. Fusion 62, 47–62 (2020).
Wannenburg, J. & Malekian, R. Physical activity recognition from smartphone accelerometer data for user context awareness sensing. IEEE Trans. Syst. Man, Cybern. Syst. 47, 3143–3149 (2017).
Yurur, O., Labrador, M. & Moreno, W. Adaptive and energy efficient context representation framework in mobile sensing. IEEE Trans. Mob. Comput. 13, 1681–1693 (2014).
Li, P., Wang, Y., Tian, Y., Zhou, T.-S. & Li, J.-S. An automatic user-adapted physical activity classification method using smartphones. IEEE Trans. Biomed. Eng. 64, 706–714 (2017).
Awan, M. A., Guangbin, Z., Kim, C.-G. & Kim, S.-D. Human activity recognition in WSN: a comparative study. Int. J. Networked Distrib. Comput. 2, 221–230 (2014).
Chen, Z., Zhu, Q., Soh, Y. C. & Zhang, L. Robust human activity recognition using smartphone sensors via CT-PCA and online SVM. IEEE Trans. Ind. Inform. 13, 3070–3080 (2017).
Zhu, R. et al. Efficient human activity recognition solving the confusing activities via deep ensemble learning. IEEE Access 7, 75490–75499 (2019).
Yang, R. & Wang, B. PACP: a position-independent activity recognition method using smartphone sensors. Inf 7, 72 (2016).
Gani, M. O. et al. A light weight smartphone based human activity recognition system with high accuracy. J. Netw. Comput. Appl. 141, 59–72 (2019).
Reddy, S. et al. Using mobile phones to determine transportation modes. ACM Trans. Sens. Networks 6, 1–27 (2010).
Guidoux, R. et al. A smartphone-driven methodology for estimating physical activities and energy expenditure in free living conditions. J. Biomed. Inform. 52, 271–278 (2014).
Cruciani, F. et al. Automatic annotation for human activity recognition in free living using a smartphone. Sensors 18, 2203 (2018).
Micucci, D., Mobilio, M. & Napoletano, P. UniMiB SHAR: A dataset for human activity recognition using acceleration data from smartphones. Appl. Sci. 7, 1101 (2017).
Derawi, M. & Bours, P. Gait and activity recognition using commercial phones. Comput. Secur. 39, 137–144 (2013).
Gu, F., Khoshelham, K., Valaee, S., Shang, J. & Zhang, R. Locomotion activity recognition using stacked denoising autoencoders. IEEE Internet Things J. 5, 2085–2093 (2018).
Chen, Y. & Shen, C. Performance analysis of smartphone-sensor behavior for human activity recognition. IEEE Access 5, 3095–3110 (2017).
Javed, A. R. et al. Analyzing the effectiveness and contribution of each axis of tri-axial accelerometer sensor for accurate activity recognition. Sensors 20, 2216 (2020).
Mukherjee, D., Mondal, R., Singh, P. K., Sarkar, R. & Bhattacharjee, D. EnsemConvNet: a deep learning approach for human activity recognition using smartphone sensors for healthcare applications. Multimed. Tools Appl. 79, 31663–31690 (2020).
Avilés-Cruz, C., Ferreyra-Ramírez, A., Zúñiga-López, A. & Villegas-Cortéz, J. Coarse-fine convolutional deep-learning strategy for human activity recognition. Sensors 19, 1556 (2019).
Guiry, J. J., van de Ven, P. & Nelson, J. Multi-sensor fusion for enhanced contextual awareness of everyday activities with ubiquitous devices. Sensors 14, 5687–5701 (2014).
Saha, J., Chowdhury, C., Ghosh, D. & Bandyopadhyay, S. A detailed human activity transition recognition framework for grossly labeled data from smartphone accelerometer. Multimed. Tools Appl. https://doi.org/10.1007/s11042-020-10046-w (2020).
Ignatov, A. D. & Strijov, V. V. Human activity recognition using quasiperiodic time series collected from a single tri-axial accelerometer. Multimed. Tools Appl. 75, 7257–7270 (2016).
Das, R. D. & Winter, S. Detecting urban transport modes using a hybrid knowledge driven framework from GPS trajectory. ISPRS Int. J. Geo-Information 5, 207 (2016).
Arif, M., Bilal, M., Kattan, A. & Ahamed, S. I. Better physical activity classification using smartphone acceleration sensor. J. Med. Syst. 38, 95 (2014).
Heng, X., Wang, Z. & Wang, J. Human activity recognition based on transformed accelerometer data from a mobile phone. Int. J. Commun. Syst. 29, 1981–1991 (2016).
Gao, Z., Liu, D., Huang, K. & Huang, Y. Context-aware human activity and smartphone position-mining with motion sensors. Remote Sensing 11, 2531 (2019).
Kang, J., Kim, J., Lee, S. & Sohn, M. Transition activity recognition using fuzzy logic and overlapped sliding window-based convolutional neural networks. J. Supercomput. 76, 8003–8020 (2020).
Shojaedini, S. V. & Beirami, M. J. Mobile sensor based human activity recognition: distinguishing of challenging activities by applying long short-term memory deep learning modified by residual network concept. Biomed. Eng. Lett. 10, 419–430 (2020).
Mairittha, N., Mairittha, T. & Inoue, S. On-device deep personalization for robust activity data collection. Sensors 21, 41 (2021).
Khan, A. M., Siddiqi, M. H. & Lee, S.-W. Exploratory data analysis of acceleration signals to select light-weight and accurate features for real-time activity recognition on smartphones. Sensors 13, 13099–13122 (2013).
Ebner, M., Fetzer, T., Bullmann, M., Deinzer, F. & Grzegorzek, M. Recognition of typical locomotion activities based on the sensor data of a smartphone in pocket or hand. Sensors 20, 6559 (2020).
Voicu, R.-A., Dobre, C., Bajenaru, L. & Ciobanu, R.-I. Human physical activity recognition using smartphone sensors. Sensors 19, 458 (2019).
Hur, T., Bang, J., Kim, D., Banos, O. & Lee, S. Smartphone location-independent physical activity recognition based on transportation natural vibration analysis. Sensors 17, 931 (2017).
Bashir, S. A., Doolan, D. C. & Petrovski, A. The effect of window length on accuracy of smartphone-based activity recognition. IAENG Int. J. Comput. Sci. 43, 126–136 (2016).
Lu, D.-N., Nguyen, D.-N., Nguyen, T.-H. & Nguyen, H.-N. Vehicle mode and driving activity detection based on analyzing sensor data of smartphones. Sensors 18, 1036 (2018).
Wang, G. et al. Impact of sliding window length in indoor human motion modes and pose pattern recognition based on smartphone sensors. Sensors 18, 1965 (2018).
Jain, A. & Kanhangad, V. Human activity classification in smartphones using accelerometer and gyroscope sensors. IEEE Sens. J. 18, 1169–1177 (2018).
Bedogni, L., Di Felice, M. & Bononi, L. Context-aware Android applications through transportation mode detection techniques. Wirel. Commun. Mob. Comput. 16, 2523–2541 (2016).
Ferreira, P., Zavgorodnii, C. & Veiga, L. edgeTrans—edge transport mode detection. Pervasive Mob. Comput. 69, 101268 (2020).
Gu, F., Kealy, A., Khoshelham, K. & Shang, J. User-independent motion state recognition using smartphone sensors. Sensors 15, 30636–30652 (2015).
Li, X., Wang, Y., Zhang, B. & Ma, J. PSDRNN: an efficient and effective HAR scheme based on feature extraction and deep learning. IEEE Trans. Ind. Inform. 16, 6703–6713 (2020).
Zhao, B., Li, S., Gao, Y., Li, C. & Li, W. A framework of combining short-term spatial/frequency feature extraction and long-term IndRNN for activity recognition. Sensors 20, 6984 (2020).
Huang, E. J. & Onnela, J.-P. Augmented movelet method for activity classification using smartphone gyroscope and accelerometer data. Sensors 20, 3706 (2020).
Montero Quispe, K. G., Sousa Lima, W., Macêdo Batista, D. & Souto, E. MBOSS: a symbolic representation of human activity recognition using mobile sensors. Sensors 18, 4354 (2018).
Sousa Lima, W., de Souza Bragança, H. L., Montero Quispe, K. G. & Pereira Souto, E. J. Human activity recognition based on symbolic representation algorithms for inertial sensors. Sensors 18, 4045 (2018).
Bragança, H., Colonna, J. G., Lima, W. S. & Souto, E. A smartphone lightweight method for human activity recognition based on information theory. Sensors 20, 1856 (2020).
Saeedi, S. & El-Sheimy, N. Activity recognition using fusion of low-cost sensors on a smartphone for mobile navigation application. Micromachines 6, 1100–1134 (2015).
Bilal, M., Shaikh, F. K., Arif, M. & Wyne, M. F. A revised framework of machine learning application for optimal activity recognition. Clust. Comput. 22, 7257–7273 (2019).
Shi, D., Wang, R., Wu, Y., Mo, X. & Wei, J. A novel orientation- and location-independent activity recognition method. Pers. Ubiquitous Comput. 21, 427–441 (2017).
Antos, S. A., Albert, M. V. & Kording, K. P. Hand, belt, pocket or bag: practical activity tracking with mobile phones. J. Neurosci. Methods 231, 22–30 (2014).
Shi, J., Zuo, D. & Zhang, Z. Transition activity recognition system based on standard deviation trend analysis. Sensors 20, 3117 (2020).
Garcia-Gonzalez, D., Rivero, D., Fernandez-Blanco, E. & Luaces, M. R. A public domain dataset for real-life human activity recognition using smartphone sensors. Sensors 20, 2200 (2020).
Saeedi, S., Moussa, A. & El-Sheimy, N. Context-aware personal navigation using embedded sensor fusion in smartphones. Sensors 14, 5742–5767 (2014).
Zhang, W., Zhao, X. & Li, Z. A comprehensive study of smartphone-based indoor activity recognition via Xgboost. IEEE Access 7, 80027–80042 (2019).
Ferrari, A., Micucci, D., Mobilio, M. & Napoletano, P. On the personalization of classification models for human activity recognition. IEEE Access 8, 32066–32079 (2020).
Zhou, B., Yang, J. & Li, Q. Smartphone-based activity recognition for indoor localization using a convolutional neural network. Sensors 19, 621 (2019).
Pires, I. M. et al. Pattern recognition techniques for the identification of activities of daily living using a mobile device accelerometer. Electronics 9, 509 https://www.mdpi.com/2079-9292/9/3/509#cite (2020).
Alo, U. R., Nweke, H. F., Teh, Y. W. & Murtaza, G. Smartphone motion sensor-based complex human activity identification using deep stacked autoencoder algorithm for enhanced smart healthcare system. Sensors 20, 6300 https://www.mdpi.com/2079-9292/9/3/509#cite (2020).
Otebolaku, A. M. & Andrade, M. T. User context recognition using smartphone sensors and classification models. J. Netw. Comput. Appl. 66, 33–51 (2016).
Zhuo, S. et al. Real-time smartphone activity classification using inertial sensors—recognition of scrolling, typing, and watching videos while sitting or walking. Sensors 20, 655 (2020).
Asim, Y., Azam, M. A., Ehatisham-ul-Haq, M., Naeem, U. & Khalid, A. Context-aware human activity recognition (CAHAR) in-the-wild using smartphone accelerometer. IEEE Sens. J. 20, 4361–4371 (2020).
Zhao, Z., Chen, Z., Chen, Y., Wang, S. & Wang, H. A class incremental extreme learning machine for activity recognition. Cogn. Comput. 6, 423–431 (2014).
Abdallah, Z. S., Gaber, M. M., Srinivasan, B. & Krishnaswamy, S. Adaptive mobile activity recognition system with evolving data streams. Neurocomputing 150, 304–317 (2015).
Guo, H., Chen, L., Chen, G. & Lv, M. Smartphone-based activity recognition independent of device orientation and placement. Int. J. Commun. Syst. 29, 2403–2415 (2016).
Cruciani, F. et al. Personalizing activity recognition with a clustering based semi-population approach. IEEE ACCESS 8, 207794–207804 (2020).
Saha, J., Ghosh, D., Chowdhury, C. & Bandyopadhyay, S. Smart handheld based human activity recognition using multiple instance multiple label learning. Wirel. Pers. Commun. https://doi.org/10.1007/s11277-020-07903-0 (2020).
Mohamed, R., Zainudin, M. N. S., Sulaiman, M. N., Perumal, T. & Mustapha, N. Multi-label classification for physical activity recognition from various accelerometer sensor positions. J. Inf. Commun. Technol. 17, 209–231 (2018).
Wang, C., Xu, Y., Liang, H., Huang, W. & Zhang, L. WOODY: a post-process method for smartphone-based activity recognition. IEEE Access 6, 49611–49625 (2018).
Garcia-Ceja, E. & Brena, R. F. An improved three-stage classifier for activity recognition. Int. J. Pattern Recognit. Artif. Intell. 32, 1860003 (2018).
Ravi, D., Wong, C., Lo, B. & Yang, G.-Z. A deep learning approach to on-node sensor data analytics for mobile or wearable devices. IEEE J. Biomed. Heal. Inform. 21, 56–64 (2017).
Chen, Z., Jiang, C. & Xie, L. A novel ensemble ELM for human activity recognition using smartphone sensors. IEEE Trans. Ind. Inform. 15, 2691–2699 (2019).
van Hees, V. T., Golubic, R., Ekelund, U. & Brage, S. Impact of study design on development and evaluation of an activity-type classifier. J. Appl. Physiol. 114, 1042–1051 (2013).
Sasaki, J. et al. Performance of activity classification algorithms in free-living older adults. Med. Sci. Sports Exerc. 48, 941–950 (2016).
Allyn, B. IBM abandons facial recognition products, condemns racially biased surveillance. https://www.npr.org/2020/06/09/873298837/ibm-abandons-facial-recognition-products-condemns-racially-biased-surveillance (2020).
Chee, F. Y. EU mulls five-year ban on facial recognition tech in public areas. https://www.reuters.com/article/uk-eu-ai/eu-mulls-five-year-ban-on-facial-recognition-tech-in-public-areas-idINKBN1ZF2QN (2020).
Saha, J., Chowdhury, C., Chowdhury, I. R., Biswas, S. & Aslam, N. An ensemble of condition based classifiers for device independent detailed human activity recognition using smartphones. Information 9, 94 (2018).
Barnett, I. & Onnela, J.-P. Inferring mobility measures from GPS traces with missing data. Biostatistics 21, e98–e112 (2020).
Wang, L. et al. Enabling reproducible research in sensor-based transportation mode recognition with the Sussex-Huawei dataset. IEEE ACCESS 7, 10870–10891 (2019).
Lee, M. H., Kim, J., Jee, S. H. & Yoo, S. K. Integrated solution for physical activity monitoring based on mobile phone and PC. Healthc. Inform. Res. 17, 76–86 (2011).
Fahim, M., Fatima, I., Lee, S. & Park, Y.-T. EFM: evolutionary fuzzy model for dynamic activities recognition using a smartphone accelerometer. Appl. Intell. 39, 475–488 (2013).
Yurur, O., Liu, C. H. & Moreno, W. Light-weight online unsupervised posture detection by smartphone accelerometer. IEEE Internet Things J. 2, 329–339 (2015).
Awan, M. A., Guangbin, Z., Kim, H.-C. & Kim, S.-D. Subject-independent human activity recognition using Smartphone accelerometer with cloud support. Int. J. Ad Hoc Ubiquitous Comput. 20, 172–185 (2015).
Chen, Z., Wu, J., Castiglione, A. & Wu, W. Human continuous activity recognition based on energy-efficient schemes considering cloud security technology. Secur. Commun. Netw. 9, 3585–3601 (2016).
Guo, J. et al. Smartphone-based patients’ activity recognition by using a self-learning scheme for medical monitoring. J. Med. Syst. 40, 140 (2016).
Walse, K. H., Dharaskar, R. V. & Thakare, V. M. A study of human activity recognition using AdaBoost classifiers on WISDM dataset. IIOAB J. 7, 68–76 (2016).
Lee, K. & Kwan, M.-P. Physical activity classification in free-living conditions using smartphone accelerometer data and exploration of predicted results. Comput. Environ. Urban Syst. 67, 124–131 (2018).
Ahmad, N. et al. SARM: salah activities recognition model based on smartphone. Electronics 8, 881 (2019).
Usman Sarwar, M. et al. Recognizing physical activities having complex interclass variations using semantic data of smartphone. Softw. Pract. Exp. 51, 532–549 (2020).
Kwapisz, J. R., Weiss, G. M. & Moore, S. A. Activity recognition using cell phone accelerometers. in Proceedings of the Fourth International Workshop on Knowledge Discovery from Sensor Data 10–18 https://doi.org/10.1145/1964897.1964918 (Association for Computing Machinery, 2010).
Sharma, A., Singh, S. K., Udmale, S. S., Singh, A. K. & Singh, R. Early transportation mode detection using smartphone sensing data. IEEE Sens. J. 1, https://doi.org/10.1109/JSEN.2020.3009312 (2020).
Chen, Z. et al. Smartphone sensor-based human activity recognition using feature fusion and maximum full a posteriori. IEEE Trans. Instrum. Meas. 69, 3992–4001 (2020).
Vavoulas, G. Chatzaki, C. Malliotakis, T. Pediaditis, M. & Tsiknakis, M. The MobiAct Dataset: recognition of activities of daily living using smartphones. In Proceedings of the International Conference on Information and Communication Technologies for Ageing Well and e-Health (eds. Röcker, C., Ziefle, M., O’Donoghue, J, Maciaszek, L. & Molloy W.) Vol. 1: ICT4AWE, (ICT4AGEINGWELL 2016) 143–151, https://www.scitepress.org/ProceedingsDetails.aspx?ID=VhZYzluZTNE=&t=1 (SciTePress, 2016).
Shoaib, M., Bosch, S., Incel, O. D., Scholten, H. & Havinga, P. J. M. Complex human activity recognition using smartphone and wrist-worn motion sensors. Sensors 16, 426 (2016).
Lockhart, J. W. et al. Design considerations for the WISDM smart phone-based sensor mining architecture. in Proceedings of the Fifth International Workshop on Knowledge Discovery from Sensor Data. 25–33 https://doi.org/10.1145/2003653.2003656 (Association for Computing Machinery, 2011).
Vaizman, Y., Ellis, K. & Lanckriet, G. Recognizing detailed human context in the wild from smartphones and smartwatches. IEEE Pervasive Comput. 16, 62–74 (2017).
Sztyler, T. & Stuckenschmidt, H. On-body localization of wearable devices: an investigation of position-aware activity recognition. in 2016 IEEE International Conference on Pervasive Computing and Communications (PerCom) 1–9 https://ieeexplore.ieee.org/document/7456521 (IEEE, 2016).
Malekzadeh, M., Clegg, R. G., Cavallaro, A. & Haddadi, H. Mobile sensor data anonymization. in Proceedings of the International Conference on Internet of Things Design and Implementation. 49–58 https://doi.org/10.1145/3302505.3310068 (ACM, 2019).
Carpineti, C., Lomonaco, V., Bedogni, L., Felice, M. D. & Bononi, L. Custom dual transportation mode detection by smartphone devices exploiting sensor diversity. in 2018 IEEE International Conference on Pervasive Computing and Communications Workshops (PerCom Workshops) 367–372 https://ieeexplore.ieee.org/document/8480119 (IEEE, 2018).
Ichino, H., Kaji, K., Sakurada, K., Hiroi, K. & Kawaguchi, N. HASC-PAC2016: large scale human pedestrian activity corpus and its baseline recognition. in Proceedings of the 2016 ACM International Joint Conference on Pervasive and Ubiquitous Computing: Adjunct. 705–714 https://doi.org/10.1145/2968219.2968277 (Association for Computing Machinery, 2016).
Acknowledgements
Drs. Straczkiewicz and Onnela are supported by NHLBI award U01HL145386 and NIMH award R37MH119194. Dr. Onnela is also supported by the NIMH award U01MH116928. Dr. James is supported by NCI award R00CA201542 and NHLBI award R01HL150119.
Author information
Authors and Affiliations
Contributions
M.S. conducted the review, prepared figures, and wrote the initial draft. P.J. and J.P.O. revised the manuscript. J.P.O. supervised the project. All authors reviewed the manuscript.
Corresponding author
Ethics declarations
Competing interests
The authors declare no competing interests.
Additional information
Publisher’s note Springer Nature remains neutral with regard to jurisdictional claims in published maps and institutional affiliations.
Rights and permissions
Open Access This article is licensed under a Creative Commons Attribution 4.0 International License, which permits use, sharing, adaptation, distribution and reproduction in any medium or format, as long as you give appropriate credit to the original author(s) and the source, provide a link to the Creative Commons license, and indicate if changes were made. The images or other third party material in this article are included in the article’s Creative Commons license, unless indicated otherwise in a credit line to the material. If material is not included in the article’s Creative Commons license and your intended use is not permitted by statutory regulation or exceeds the permitted use, you will need to obtain permission directly from the copyright holder. To view a copy of this license, visit http://creativecommons.org/licenses/by/4.0/.
About this article

Cite this article
Straczkiewicz, M., James, P. & Onnela, JP. A systematic review of smartphone-based human activity recognition methods for health research. npj Digit. Med. 4, 148 (2021). https://doi.org/10.1038/s41746-021-00514-4
Received:
Accepted:
Published:
DOI: https://doi.org/10.1038/s41746-021-00514-4
This article is cited by
-
Unlocking the potential of smartphone and ambient sensors for ADL detection
Scientific Reports (2024)
-
Self-supervised learning for human activity recognition using 700,000 person-days of wearable data
npj Digital Medicine (2024)
-
Activity recognition based on smartphone sensor data using shallow and deep learning techniques: A Comparative Study
Multimedia Tools and Applications (2024)
-
A “one-size-fits-most” walking recognition method for smartphones, smartwatches, and wearable accelerometers
npj Digital Medicine (2023)
-
Data filtering and deep learning for enhanced human activity recognition from UWB radars
Journal of Ambient Intelligence and Humanized Computing (2023)
