
Abstract
Recent climate modeling studies point to an increase in tropical cyclone rainfall rates in response to climate warming. These studies indicate that the percentage increase in tropical cyclone rainfall rates often outpaces the increase in saturation specific humidity expected from the Clausius-Clapeyron relation (~7% °C−1). We explore the change in tropical cyclone rainfall rates over all oceans under global warming using a high-resolution climate model with the ability to simulate the entire intensity spectrum of tropical cyclones. Consistent with previous results, we find a robust increase of tropical cyclone rainfall rates. The percentage increase for inner-core tropical cyclone rainfall rates in our model is markedly larger than the Clausius-Clapeyron rate. However, when the impact of storm intensity is excluded, the rainfall rate increase shows a much better match with the Clausius-Clapeyron rate, suggesting that the “super Clausius-Clapeyron” scaling of rainfall rates with temperature increase is due to the warming-induced increase of tropical cyclone intensity. The increase of tropical cyclone intensity and environmental water vapor, in combination, explain the tropical cyclone rainfall rate increase under global warming.
Introduction
Rainfall associated with tropical cyclones (TCs) is a prominent component of global precipitation.1,2 The heavy rainfall and resultant freshwater flooding and/or landslides associated with landfalling TC events account for numerous fatalities and large socioeconomic losses.3,4 One of the most prominent examples is Hurricane Harvey in 2017, the second costliest tropical cyclone (behind Hurricane Katrina in 2005) and the wettest tropical cyclone on record in the United States.5 The unprecedented rainfall from Harvey produced catastrophic flooding in the Houston metropolitan area, the primary cause for deaths and property damage. Several studies have concluded that the extreme rainfall from Harvey was made more intense, or equivalently the probability of an event like Harvey was increased, due to anthropogenic warming5,6,7,8 and urbanization.9 It should be noted that, in addition to storm rain rate, the slow motion of Harvey after landfall is another critical element of the high rainfall totals. Although this study focuses on the future change of TC rainfall rate rather than TC translation speed,10 it is worthwhile to point out that the latter is another important factor that affects future local rainfall amounts. There is growing interest on the extent to which the slow translation speed of Harvey may be part of a broader global slowdown of TC translation speed.10,11,12,13
Recent global and regional climate modeling studies projected increased TC rainfall rate in response to global warming scenarios.14,15,16,17,18,19,20,21,22,23,24,25 An important element of the projected increase is the atmospheric moistening that, in absense of changes in circulation, should lead to enhanced moisture convergence and thus increase of rainfall rate. The Clausius-Clapeyron relation indicates that warmer air has a larger holding capacity for water vapor. For a typical low-level tropospheric temperature, the saturated specific humidity content increases by about 7% per degree Celsius increase in temperature. If one ignores the typically small change to boundary layer relative humidity,26 a 2 °C increase of temperature leads to a 14% increase of atmospheric moisture content.
A previous global TC downscaling study19 found that the projected increases of TC rainfall rates over most tropical ocean basins exceed the increase of environmental water vapor expected from the Clausius-Clapeyron relation, particularly for rainfall rates within about 100 km of the storm center. Therefore, atmospheric moistening related to increased temperature cannot fully explain the modeled increase of TC rainfall rates in that model. Because TCs with high intensity tend to produce high rainfall rates in observations,27,28 we hypothesize that increased storm intensity16 is another factor responsible for the projected increase of TC rainfall rates with climate warming. A study examining the impact of the past long-term climate change on TC rainfall, focusing on two landfalling TCs in Taiwan, identified the enhanced secondary circulation associated with increased storm intensity as an important ingredient of increased TC rainfall rate in their two case studies.29 In our study we test the hypothesis for TC activity in general in all ocean basins.
Climate models with relatively coarse horizontal resolution (i.e., >50 km grid spacing) may suffer from limited skill in simulating intense storms (e.g., major hurricanes). A recently developed high-resolution climate model at the Geophysical Fluid Dynamics Laboratory (GFDL), HiFLOR, can accurately reproduce the observed spectrum of TC intensity,30 allowing us to further explore the impact of TC intensification on storm rainfall. We use a set of HiFLOR climate experiments31 to examine the change of TC rainfall rates for all oceans in response to global warming, and we test the hypothesis that increased TC intensity is an important cause of increased storm rainfall rates in addition to atmospheric moistening. Details of the model runs can be found in Methods.
Results
We use the projected change of climatological sea surface temperature (SST) over the main TC development region (MDR) in each basin (Supplementary Fig. 1) to quantify the expected role of atmospheric moisture change in TC rainfall change under global warming. Several arguments support the use of this simple scaling approach. First, we assume the low-level relative humidity of the TC environment has negligible change under global warming. At global scales, a relatively small change of relative humidity is a robust characteristic of greenhouse warming.26 HiFLOR projects a change of relative humidity within 1% from near surface up to 500 hPa for the tropical ocean basins (30oS–30oN) (Supplementary Fig. 2). Although relative humidity at levels higher than 500 hPa has proportionately larger change, it should not have large impact on rainfall rates due to the much smaller water vapor background level compared to low levels (Supplementary Fig. 3). In addition, HiFLOR projects an increase of total precipitable water in tropical oceans (30oS–30oN) of 13.6%, close to the increase of saturated water vapor content (12.6%) indicated by the 1.8 K increase of tropical SST, assuming a 7% increase in water vapor content per degree Celsius increase in SST. For the local TC environment, observations show that the surface relative humidity within 100 km of the storm center can reach 90% or higher. We assume the close-to-saturation TC environmental condition would not change significantly as climate warms. Thus, the low-level atmospheric moisture content over tropical oceans would increase in a warming climate, enhancing atmospheric moisture convergence into TCs. Because the low-level water vapor convergence is a key element of the TC water budget,29,32,33,34 the storm rainfall rate is expected to increase accordingly. We also assume that atmospheric moisture for the TC environment and for the large-scale environment would have similar change in response to global warming. We tested this assumption using the North Atlantic as an example and found that the change of daily SST (warming climate vs. present-day) underlying TCs with a range of storm sizes resembles that of monthly SST over the MDR (Supplementary Table 1; with details in the supplementary discussion).
We compute averaged storm rainfall rate within 100 km from the storm center using 6-hourly TC samples. The projected increase of 100-km TC rainfall rate under the late twenty-first-century warming scenario for storms with at least tropical storm intensity (wind speed ≥34 kt) ranges from 19% (13% per °C) to 29% (17% per °C) for each ocean (Fig. 1), generally consistent with a review of previous studies.16 The largest increase occurs in the North Atlantic and North Western Pacific. The increase in the other four oceans reaches approximately 20% (approximately 13% per °C) (Fig. 1). In the warming scenario, SSTs over the MDRs in various basins show an increase ranging from 1.3 °C to 1.8 °C, implying an increase of low-level atmospheric moisture content from 9.1 to 13%. The greater TC rainfall rate increase, compared to the moisture content, indicates a super-Clausius-Clapeyron scaling, suggesting that atmospheric moistening is only part of the physical mechanism responsible for the projected increase of TC rainfall rate in the HiFLOR model. For averaging radii larger than 100 km, the change of TC rainfall rate also shows a super-Clausius-Clapeyron scaling at global scales (Supplementary Fig. 4) and each ocean basin (Supplementary Fig. 5).
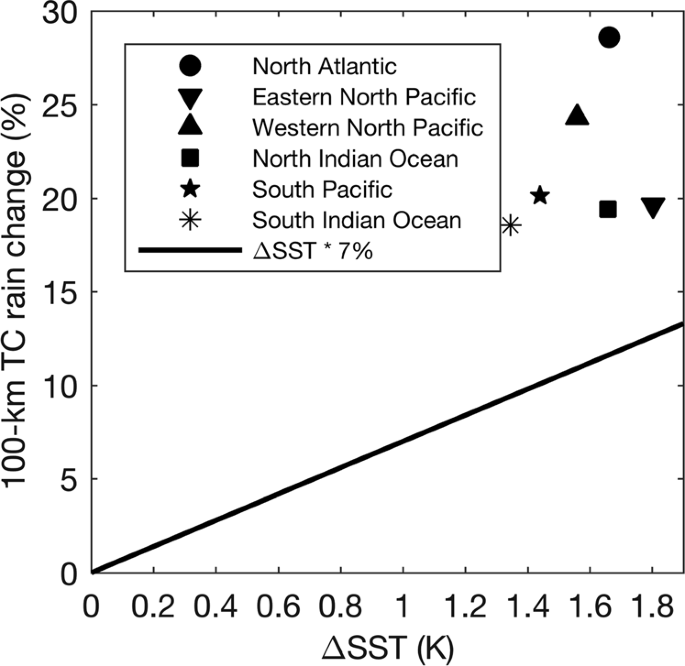
The percentage change of TC rainfall rates within 100 km from the storm center for each ocean basin. The black line indicates the 7% increase in low-level atmospheric water vapor content per degree Celsius increase in SST as in the Clausius-Clapeyron relation. For all basins, the change of TC rainfall between present-day run and warm-climate run is statistically significant (p < 0.01) based on a two-sided Mann–Whitney–Wilcoxon median test
As documented in observational analyses, TCs with high storm intensity tend to produce high rainfall rates, especially towards the storm center.28,35,36 Previous work on future TC activity in response to global warming reported increased storm intensity in most basins.15,16,19,23,31,37,38,39 We hypothesize that storm intensity is another important factor contributing to projected storm rainfall rate increase. In HiFLOR simulations, TCs with high intensity tend to produce high rain rates within 100 km of the storm center (Supplementary Fig. 6), in general agreement with observed TC rainfall rate profiles over oceans.28
HiFLOR also projects a significant increase (p–value < 0.01 based on a two-sided Mann–Whitney–Wilcoxon median test) of mean TC intensity in terms of maximum surface winds for each ocean basin as climate warms (Supplementary Fig. 7). The magnitude of intensity increase ranges from 3.2 to 9.0% across oceans,31,39 lying within the range of 2 to 11% for global mean TC intensity increase for the late twenty-first-century, as summarized in a previous assessment.16 However, there are models that project decreased storm intensity in some basins,19 the impact of which on storm rainfall rate will be discussed later.
To isolate the impact of storm intensity on TC rainfall rate changes, we divided the TC samples into four categories based on the Saffir–Simpson intensity scale. Within each category and for each TC basin, the average storm intensity shows negligible change in response to climate warming (Supplementary Fig. 8). The change of storm rainfall rate for the four categories is expected to better highlight the impact of atmospheric moistening due to heavily reduced influence from storm intensity. As shown in Fig. 2, the projected increase of TC rainfall rate within each storm category shows a much better match with the Clausius-Clapeyron scaling than that for all storm samples combined. This alternative sampling of the data highlights the role of storm intensity in the future projected changes of storm rainfall rate. Increased TC intensity leads to increased low-level radial inflow and thus enhanced moisture convergence for storm rainfall production. For all storm samples, the 10-m radial inflow at 50–100 km from storm center showed considerable strengthening as climate warms (Supplementary Fig. 9). In contrast, for storms within each intensity category, there is little strengthening of radial inflow. This is consistent with the feature seen in changes of TC rainfall rate and supports our hypothesis that the increase of storm intensity, in addition to the increase of environmental water vapor, is an important contributor to increased TC rainfall rates.

The percentage change of 100-km TC rainfall rate with respect to each category of the Saffir-Simpson TC wind intensity scale (black dots) in a North Atlantic, b Eastern North Pacific, c Western North Pacific, d North Indian Ocean, e South Pacific, and f South Indian Ocean. The red line indicates the percentage change of water vapor content indicated by SST change, assuming a 7% increase in water vapor content per degree Celsius increase in SST in the basin. Only storm categories with sample size >100 are shown
This “super Clausius-Clapeyron” scaling for TC rainfall rate change within 100 km of the storm center is also found in other studies.16,19 Compared to the present study, Knutson, et al.19 used a downscaling approach based on the GFDL hurricane model and reported a smaller increase of 100-km TC rainfall rate (−1.2 to +21%) than our present study (+19 to +29%), consistent with the slightly smaller tropical SST increases in their study (1.1–1.7 °C) compared with HiFLOR (1.3–1.8 °C). Another likely important reason for the difference of TC rain rate change in the two studies may lie in the differences between their TC intensity responses to warming with the GFDL hurricane model projecting less increase of storm intensity (−4.8 to +4.9% per degree Celsius) than HiFLOR (+2.0 to +5.4% per degree Celsius). More reliable projections of TC intensity would increase our confidence in projections of TC rain rates and riverine flood risks.
Discussion
In this study, we explored the physical mechanisms responsible for the projected increases of inner-core TC rainfall rates in response to climate warming, examining all TC basins and using a high-resolution global climate model (HiFLOR). The percentage increase of TC rainfall rates for all TC samples combined markedly exceeds the Clausius-Clapeyron rate, indicating a “super Clausius-Clapeyron” scaling. However, the percentage increase for the storms within each category of the Saffir–Simpson wind scale shows a much better match with the Clausius-Clapeyron rate. Because the average storm intensity within each category shows negligible change in response to global warming, the contrast of TC rainfall rate increases for all TC samples and for each intensity category highlights the role of storm intensification in the “super Clausius-Clapeyron” scaling. In particular, atmospheric moistening and increased storm intensity both lead to enhanced water vapor convergence and thus an increase of TC rainfall rates. The combination of the two influences helps explain the very marked increase of storm rainfall rates in the HiFLOR model in response to anthropogenic warming.
Methods
We use the High-Resolution Forecast-Oriented Low Ocean Resolution (FLOR) model (HiFLOR) developed at Geophysical Fluid Dynamics Laboratory (GFDL).30,31,40,41 HiFLOR has a horizontal resolution of approximately 25 km for the atmosphere and land components and a coarser (~1°) resolution for the oceanic and sea ice components. HiFLOR was developed from the lower resolution FLOR model (~50 km resolution);42,43,44 which in turn was developed from the GFDL Coupled Models version 2.145 and 2.5.46 The resolution of the atmospheric component of HiFLOR is comparable to that used in Chen and Lin.47 In addition to simulating a much more realistic storm intensity spectrum than FLOR, including major hurricanes, HiFLOR shows improved skills in simulating and predicting the impact of seasonal to interannual climate variability on TC activity.30,40,48
With HiFLOR, a 70-year control climate simulation is generated by nudging the model’s SSTs toward climatological SST over the period 1986–2005 from the Met Office Hadley Centre SST dataset (HadISST1.1).49 The radiative forcing and land surface conditions are prescribed with conditions of 1995. For the future climate experiment, we add the projected change of SST from a multi-model mean of seventeen Coupled Model Intercomparison Project Phase 5 (CMIP5) models to the observed SST climatology. The future SST anomaly is the difference between the periods 2081–2100 and 1986–2005 under representative concentration pathway (RCP) 4.5 pathway. The seventeen models are ACCESS1-0, ACCESS1-3, CanESM2, CCSM4, CMCC-CM, CSIRO-Mk3-6-0, GFDL-CM3, GFDL-ESM2G, GFDL-ESM2M, GISS-E2-H, GISS-E2-R, HadGEM2-CC, HadGEM2-ES, MIROC-ESM, MIROC-ESM-CHEM, MPI-ESM-LR, and NorESM1-M. The radiative forcing is prescribed with conditions of 2090. These experiments are further explored in van der Wiel, et al.50 and Bhatia, et al.31
Tropical cyclones are tracked with the algorithm of Harris, et al.,51 with parameter settings as in Murakami, et al.30 Only TCs with tropical storm or higher intensity (i.e., wind speed ≥34 kt) are analyzed. We focus on the TC rainfall within 100 km from the storm center. To avoid the influence of extratropical transition on TC rainfall,52,53 the study region is constrained between 30°S and 30°N. We focus on core hurricane seasons: July–November in the North Hemisphere and December–April in the South Hemisphere.
Data availability
The code of the climate model used in this study is available at the NOAA/GFDL website (https://www.gfdl.noaa.gov/cm2-5-and-flor/). The data that support the findings of this study are available from the corresponding author on request.
Code availability
Analysis code that support the findings of this study is available upon request from the corresponding author.
References
Jiang, H. & Zipser, E. J. Contribution of tropical cyclones to the global precipitation from eight seasons of TRMM data: regional, seasonal, and interannual variations. J. Clim. 23, 1526–1543 (2010).
Khouakhi, A., Villarini, G. & Vecchi, G. A. Contribution of tropical cyclones to rainfall at the global scale. J. Clim. 30, 359–372 (2017).
Rappaport, E. N. Fatalities in the United States from Atlantic Tropical Cyclones: new data and interpretation. Bull. Am. Meteor. Soc. 95, 341–346 (2014).
Pielke, R. A. et al. Normalized Hurricane Damage in the United States: 1900–2005. Nat. Hazards Rev. 9, 29–42 (2008).
Emanuel, K. Assessing the present and future probability of Hurricane Harvey’s rainfall. Proc. Natl Acad. Sci. USA 114, 12681–12684 (2017).
Wang, S. Y. S., Lin, Z., Jin-Ho, Y., Phil, K. & Robert, R. G. Quantitative attribution of climate effects on Hurricane Harvey’s extreme rainfall in Texas. Environ. Res. Lett. 13, 054014 (2018).
van Oldenborgh, G. J. et al. Attribution of extreme rainfall from Hurricane Harvey. Environ. Res. Lett. 12, 124009 (2017).
Risser, M. D. & Wehner, M. F. Attributable human-induced changes in the likelihood and magnitude of the observed extreme precipitation during hurricane harvey. Geophys. Res. Lett. 44, 12457–12464 (2017).
Zhang, W., Villarini, G., Vecchi, G. A. & Smith, J. A. Urbanization exacerbated the rainfall and flooding caused by hurricane Harvey in Houston. Nature 563, 384–388 (2018).
Kossin, J. P. A global slowdown of tropical-cyclone translation speed. Nature 558, 104–107 (2018).
Moon, I.-J., Kim, S.-H. & Chan, J. C. L. Climate Change and tropical cyclone trend. Nature 570(7759), E3–E5 (2019).
Lanzante, J. R. Uncertainties in tropical-cyclone translation speed. Nature 570(7759), E6–E15 (2019).
Kossin, J. P. Reply to: Moon, I.-J. et al.; Lanzante, J. R. Nature 570(7759), E16–E22 (2019).
Bengtsson, L. et al. How may tropical cyclones change in a warmer climate? Tellus A 59, 539–561 (2007).
Kim, H.-S. et al. Tropical cyclone simulation and response to CO2 doubling in the GFDL CM2.5 high-resolution coupled climate model. J. Clim. 27, 8034–8054 (2014).
Knutson, T. R. et al. Tropical cyclones andclimate change. Nat. Geosci. 3, 157–163 (2010).
Knutson, T. R., Sirutis, J. J., Garner, S. T., Vecchi, G. A. & Held, I. M. Simulated reduction in Atlantic hurricane frequency under twenty-first-century warming conditions. Nat. Geosci. 1, 359–364 (2008).
Knutson, T. R. et al. Dynamical downscaling projections of twenty-first-century atlantic hurricane activity: CMIP3 and CMIP5 model-based scenarios. J. Clim. 26, 6591–6617 (2013).
Knutson, T. R. et al. Global projections of intense tropical cyclone activity for the late twenty-first century from dynamical downscaling of CMIP5/RCP4.5 scenarios. J. Clim. 28, 7203–7224 (2015).
Scoccimarro, E. et al. Intense precipitation events associated with landfalling tropical cyclones in response to a warmer climate and increased CO2. J. Clim. 27, 4642–4654 (2014).
Villarini, G. et al. Sensitivity of tropical cyclone rainfall to idealized global-scale forcings. J. Clim. 27, 4622–4641 (2014).
Wright, D. B., Knutson, T. R. & Smith, J. A. Regional climate model projections of rainfall from U.S. landfalling tropical cyclones. Clim. Dyn. 45, 3365–3379 (2015).
Yoshida, K., Sugi, M., Mizuta, R., Murakami, H. & Ishii, M. Future changes in tropical cyclone activity in high-resolution large-ensemble simulations. Geophys. Res. Lett. 44, 9910–9917 (2017).
Yoshimura, J., Sugi, M. & Noda, A. Influence of greenhouse warming on tropical cyclone frequency. J. Meteorological Soc. Jpn Ser. II 84, 405–428 (2006).
Patricola, C. M. & Wehner, M. F. Anthropogenic influences on major tropical cyclone events. Nature 563, 339–346 (2018).
Held, I. M. & Soden, B. J. Robust responses of the hydrological cycle to global warming. J. Clim. 19, 5686–5699 (2006).
Jiang, H., Halverson, J. B. & Zipser, E. J. Influence of environmental moisture on TRMM-derived tropical cyclone precipitation over land and ocean. Geophys. Res. Lett. 35, L17806 (2008).
Lonfat, M., Marks, F. D. & Chen, S. S. Precipitation distribution in tropical cyclones using the tropical rainfall measuring mission (TRMM) microwave imager: a global perspective. Mon. Weather Rev. 132, 1645–1660 (2004).
Wang, C.-C., Lin, B.-X., Chen, C.-T. & Lo, S.-H. Quantifying the effects of long-term climate change on tropical cyclone rainfall using a cloud-resolving model: examples of two landfall typhoons in Taiwan. J. Clim. 28, 66–85 (2015).
Murakami, H. et al. Simulation and prediction of category 4 and 5 hurricanes in the high-resolution GFDL HiFLOR coupled climate model. J. Clim. 28, 9058–9079 (2015).
Bhatia, K., Vecchi, G., Murakami, H., Underwood, S. & Kossin, J. Projected response of tropical cyclone intensity and intensification in a global climate model. J. Clim. 31, 8281–8303 (2018).
Fritz, C. & Wang, Z. Water vapor budget in a developing tropical cyclone and its implication for tropical cyclone formation. J. Atmos. Sci. 71, 4321–4332 (2014).
Braun, S. A. High-resolution simulation of hurricane bonnie (1998). Part II: Water budget. J. Atmos. Sci. 63, 43–64 (2006).
Yang, M.-J., Braun, S. A. & Chen, D.-S. Water budget of typhoon nari (2001). Mon. Weather Rev. 139, 3809–3828 (2011).
Lau, W. K. M. & Zhou, Y. P. Observed recent trends in tropical cyclone rainfall over the North Atlantic and the North Pacific. J. Geophys. Res. 117, D03104 (2012).
Lin, Y., Zhao, M. & Zhang, M. Tropical cyclone rainfall area controlled by relative sea surface temperature. Nat Commun 6, 6591 (2015).
Murakami, H. et al. Future changes in tropical cyclone activity projected by the new high-resolution MRI-AGCM. J. Clim. 25, 3237–3260 (2012).
Emanuel, K., Sundararajan, R. & Williams, J. Hurricanes and global warming: results from downscaling IPCC AR4 simulations. Bull. Am. Meteor. Soc. 89, 347–368 (2008).
Vecchi, G. A. et al. Tropical cyclone sensitivities to CO2 doubling: roles of atmospheric resolution, synoptic variability and background climate changes. Clim. Dyn. https://doi.org/10.1007/s00382-019-04913-y (2019).
Murakami, H. et al. Seasonal forecasts of major hurricanes and landfalling tropical cyclones using a high-resolution GFDL coupled climate model. J. Clim. 29, 7977–7989 (2016).
Wiel, Kvd et al. The resolution dependence of contiguous U.S. precipitation extremes in response to CO2 forcing. J. Clim. 29, 7991–8012 (2016).
Jia, L. et al. Improved seasonal prediction of temperature and precipitation over land in a high-resolution GFDL climate model. J. Clim. 28, 2044–2062 (2015).
Vecchi, G. A. et al. On the seasonal forecasting of regional tropical cyclone activity. J. Clim. 27, 7994–8016 (2014).
Yang, X. et al. Seasonal predictability of extratropical storm tracks in GFDL’s high-resolution climate prediction model. J. Clim. 28, 3592–3611 (2015).
Delworth, T. L. et al. GFDL’s CM2 global coupled climate models. Part I: formulation and simulation characteristics. J. Clim. 19, 643–674 (2006).
Delworth, T. L. et al. Simulated climate and climate change in the GFDL CM2.5 high-resolution coupled climate model. J. Clim. 25, 2755–2781 (2012).
Chen, J.-H. & Lin, S.-J. Seasonal predictions of tropical cyclones using a 25-km-resolution general circulation model. J. Clim. 26, 380–398 (2013).
Zhang, W. et al. Improved simulation of tropical cyclone responses to ENSO in the Western North Pacific in the high-resolution GFDL HiFLOR Coupled Climate Model. J. Clim. 29, 1391–1415 (2016).
Rayner, N. A. et al. Global analyses of sea surface temperature, sea ice, and night marine air temperature since the late nineteenth century. J. Geophys. Res. 108, 4407 (2003).
van der Wiel, K., Kapnick, S. B. & Vecchi, G. A. Shifting patterns of mild weather in response to projected radiative forcing. Clim. Change 140, 649–658 (2017).
Harris, L. M., Lin, S.-J. & Tu, C. High-resolution climate simulations using GFDL HiRAM with a stretched global grid. J. Clim. 29, 4293–4314 (2016).
Atallah, E. H., Bosart, L. F. & Aiyyer, A. R. Precipitation distribution associated with landfalling tropical cyclones over the eastern United States. Mon. Weather Rev. 135, 2185–2206 (2007).
Atallah, E. H. & Bosart, L. R. The extratropical transition and precipitation distribution of hurricane Floyd (1999). Mon. Weather Rev. 131, 1063–1081 (2003).
Acknowledgements
This work was supported in part by Award NA14OAR4830101 from the National Oceanic and Atmospheric Administration, U.S. Department of Commerce, the National Science Foundation (Grants EAR1520683 and AGS-1262099), and Award 80NSSC19K0482 from the National Aeronautics and Space Administration. This work supported in part by the Carbon Mitigation Initiative at Princeton University.
Author information
Authors and Affiliations
Contributions
M.L., G.A.V. and J.A.S. designed the research; G.A.V. performed the simulations; M.L. performed analysis; M.L. wrote the draft; and all the authors contributed to the interpretation of the results and the writing of the paper.
Corresponding author
Ethics declarations
Competing interests
The authors declare no competing interests.
Additional information
Publisher’s note Springer Nature remains neutral with regard to jurisdictional claims in published maps and institutional affiliations.
Supplementary information
Rights and permissions
Open Access This article is licensed under a Creative Commons Attribution 4.0 International License, which permits use, sharing, adaptation, distribution and reproduction in any medium or format, as long as you give appropriate credit to the original author(s) and the source, provide a link to the Creative Commons license, and indicate if changes were made. The images or other third party material in this article are included in the article’s Creative Commons license, unless indicated otherwise in a credit line to the material. If material is not included in the article’s Creative Commons license and your intended use is not permitted by statutory regulation or exceeds the permitted use, you will need to obtain permission directly from the copyright holder. To view a copy of this license, visit http://creativecommons.org/licenses/by/4.0/.
About this article

Cite this article
Liu, M., Vecchi, G.A., Smith, J.A. et al. Causes of large projected increases in hurricane precipitation rates with global warming. npj Clim Atmos Sci 2, 38 (2019). https://doi.org/10.1038/s41612-019-0095-3
Received:
Accepted:
Published:
DOI: https://doi.org/10.1038/s41612-019-0095-3
This article is cited by
-
Locally opposite responses of the 2023 Beijing–Tianjin–Hebei extreme rainfall event to global anthropogenic warming
npj Climate and Atmospheric Science (2024)
-
Spatiotemporal evolution of tropical cyclone precipitation in China from 1971 to 2020
Natural Hazards (2024)
-
2023: Weather and Climate Extremes Hitting the Globe with Emerging Features
Advances in Atmospheric Sciences (2024)
-
Global tropical cyclone precipitation scaling with sea surface temperature
npj Climate and Atmospheric Science (2023)
-
Increasing sequential tropical cyclone hazards along the US East and Gulf coasts
Nature Climate Change (2023)
