
Abstract
Over the past 30–40 years, vehicle tailpipe emissions of particulate matter (PM), nitrogen oxides (NOx), carbon monoxide (CO), and hydrocarbons (HCs) have decreased significantly. Advanced emission after-treatment technologies have been developed for gasoline and diesel vehicles to meet increasingly stringent regulations, yielding absolute emission reductions from the fleet despite increased vehicle travel. As a result of mobile and stationary source emission controls, air quality has generally improved substantially in cities across the US and Europe. Emission regulations (such as Tier 3 in the US, LEV III in California, and Euro 6 rules in the EU) will lead to even lower vehicle emissions and further improvements in air quality. We review historical vehicle emission and air quality trends, discuss the future outlook for air quality, and note that modern internal combustion engine vehicles typically have lower exhaust emissions than battery electric vehicle upstream emissions. As vehicle manufacturers and city officials grapple with questions about future mobility in cities, we raise the question “how low should we go?” for future vehicle criteria emissions. The answer to this question will have profound implications for automotive and fuel companies and for the future economic and environmental health of urban areas.
Introduction
Vehicle emissions affect local and regional air quality. The criteria pollutant emissions generated from fuel combustion by internal combustion engines (ICE) include nitrogen oxides (NO and NO2, together called NOx), hydrocarbons (HC)—also known as volatile organic compounds (VOCs) or non-methane hydrocarbons (NMHC), carbon monoxide (CO), and particulate matter of size <10 microns (PM10) and <2.5 microns (PM2.5) including black carbon (BC). Governments worldwide regulate vehicle emissions of criteria pollutants.1 The US and EU began regulating emissions in the 1970s. Currently in the US the federal Tier 3 and California LEV III light-duty vehicle (LDV) standards phase-in from 2015 to 2025. In the EU, the current Euro 6 LDV standard went into effect in 2015, while real driving emissions (RDE) standards phase-in beginning in 2017. Heavy duty vehicle (HDV) emission standards include the Euro VI standards (we adopt the convention of using Roman numerals and Arabic numerals for heavy- and light-duty standards, respectively), effective in 2013, and the current US HD standards, fully phased-in as of 2010. Other regions’ vehicle emission standards are usually modified versions of the Euro or US standards (Euro 3-Euro 6 and Tier 1-Tier 3).1
The successive LDV emission standards have lowered the regulated emission intensity (g/mile or g/km) of NMHC + NOx emissions by 97% in the US (Tier 1–3 in 2025) and by 80–85% in the EU (Euro 1–6),1 and of total hydrocarbons (THC) + NOx in China by 84% (China 1–5).2 Likewise, HDV emission standards for NMHC + NOx have decreased by 95% or more since 1988 in the US.1 To meet these standards, advanced vehicle emission after-treatment systems such as three-way catalytic converters, lean NOx traps, selective catalytic reduction (SCR), and diesel particulate filters (DPFs) have been developed and implemented.3,4,5,6,7
This paper focuses on criteria pollutants. Emissions from ICE vehicles also include carbon dioxide (CO2), a greenhouse gas that is the main combustion product of carbon-based fuels. Vehicle CO2 emissions are regulated around the world and are reduced by improving the fuel efficiency of the vehicles.
As a result of regulations and technology improvements, emissions from vehicles and stationary sources have decreased and air quality has improved significantly in most large cities in the US and Europe. The following sections review historical vehicle emission and air quality trends, examine the outlook for air quality, and discuss the future of vehicle regulations.
Vehicle emission trends
Vehicle emission intensities have decreased by factors of 2–100 over the past several decades to meet regulatory standards.1,8 The regulatory test cycle emissions are generally achieved in US on-road operation. On-road measurements show substantial declines in real-world emissions of HC, NOx, and CO at four U.S. urban locations since the late 1990s.9,10,11 In contrast, in the EU the New European Drive Cycle (NEDC) and test procedure did not fully reflect on-road emissions, and the decrease in NOx emissions from diesel vehicles in the real world has been less than expected based on emission standards as tested under laboratory conditions. Diesel LDV on-road NOx emission rates in the EU have not improved relative to the 1990s and the measured NO2 share of NOx has increased.12 However, gasoline vehicle on-road NOx emission rates have decreased by a factor of 8–10 since pre-Euro 1 emission controls.12 In 2017, the severity of Euro 6 regulations increased substantially by including an RDE component to bring on-road diesel NOx close to the laboratory standard.13,14 The future China 6 vehicle emission regulations also include RDE testing modeled after the EU.1
As the vehicle emission intensity has declined, vehicle population and travel demand has increased. In the US, LDV distance traveled grew 180% between 1970 and 2015, and 50% between 1990 and 2015.15 The number of registered passenger cars in the EU grew about 40% from 1995 to 2015 and passenger car travel (passenger km) increased 21% over the same time.16 Since 1985 the number of vehicles in China has increased by a factor of 20.17
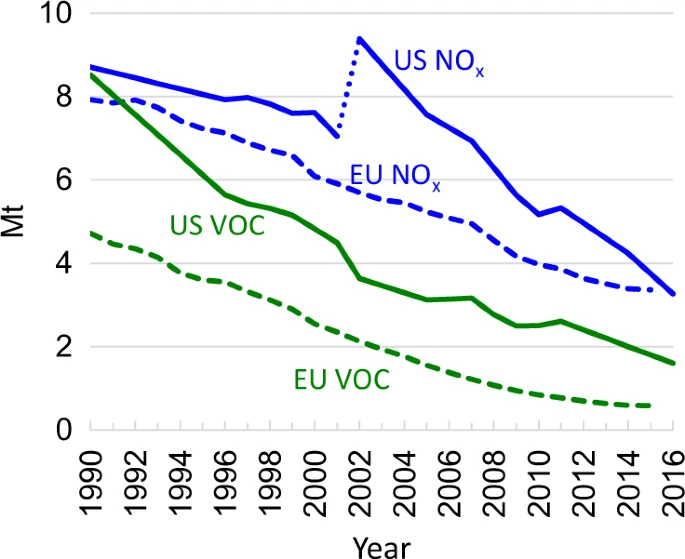
Nonetheless, total highway vehicle (LDV, HDV, commercial vehicle and motorcycle) NOx and VOC emissions in the US and EU have declined 60–80% since 1990 as shown in Fig. 1.18,19 Edwards et al.20 modeled real-world LDV and HDV emissions for the years 2000–2030 following the implementation of Tier 3 and Euro 6 RDE regulations. Future emissions of most pollutants in most regions are projected to decline significantly following the introduction of these regulations, even without electric vehicles and with increased travel overall. The exception is in China where the travel demand increases by a factor of 10, partially offsetting the vehicle emission intensity improvements. Wu et al.’s modeling2 shows that while the China passenger LDV stock more than doubles from 2015 to 2030, total vehicle emissions decline as China 6 regulations take effect and fleet electrification increases.
Air quality trends
Air quality has improved steadily as vehicle and stationary source emissions have decreased. In the US, ambient concentrations of ozone (O3), NOx, PM, CO and other pollutants are declining.21 US annual O3 concentrations (4th highest 8-h average) have decreased 31% from 1980 to 2016 as shown in Fig. 2a,22 and PM2.5 (annual average) has decreased 42% since 2000. California peak O3 concentrations have decreased by approximately a factor of 5 since the 1960s.23

In Europe, O3 precursor emissions (NOx and VOCs) are declining.24 Figure 2b shows that EU region-wide average O3 concentrations have been stable since 2000,25 somewhat lower than the standard of 120 μg/m3 (0.06 ppm).26 NO2 and PM2.5 annual mean urban concentrations also have decreased since 2000.27
Studies in China analyzing data from a nationwide O3 monitoring system implemented in 2012 show an increase in observed ozone between 2013 and 2015,28,29 although decreasing emissions of NOx, which can remove O3 through chemical reactions, may have contributed to the ozone increase. Annual average PM2.5 concentrations decreased 33–45% between 2013 and 2017 in the Beijing–Tianjin–Hebei area but still exceed the national standard.30 In 2014–2015, 190 cities in China averaged annual PM2.5 concentrations of 57 ± 18 μg/m3,31 greater than the national standard of 35 μg/m3, but source apportionment models indicate transportation accounts for <10% of PM2.5 annual average concentrations in China.32,33
While country-wide average air quality today is much improved in the US and EU, local concentrations can still exceed the ambient air quality standards. In many areas of the US, especially in California, O3 concentrations continue to exceed the air quality standard (0.07 ppm=140 μg/m3), despite the large decreases in emissions and ambient concentrations of VOC and NOx.34,35 Likewise, many European monitoring stations exceed the O3 standard (120 μg/m3 on >25 days per year)36 Furthermore, the EU annual air quality standard for NO2 is still widely exceeded, particularly at roadside monitoring stations.37
Zero-emission vehicles
Because of local exceedances of air quality standards, vehicle emission programs beyond the recently implemented Tier 3 and Euro 6 RDE standards are being considered. Limits or bans on ICE vehicles in several major city centers are being implemented to further control emissions.38 Countries are considering bans on the sale of gasoline and diesel vehicles beginning in 2025 or later.39 Zero-emission vehicle (ZEV) mandates are in place in California, 11 other US states, and China. All these programs require ZEVs, which can be pure battery electric vehicles (BEV) or hydrogen fuel cell vehicles (FCV). Plug-in hybrid electric vehicles (PHEV) may count as transitional ZEVs.
ZEVs do not produce tailpipe emissions, thus reducing roadside emissions and improving local air quality. However, ZEVs are not zero-emission in a regional or global sense because electricity (or hydrogen) generation can produce upstream emissions. Tailpipe emissions from an ICE vehicle can be comparable to the upstream electricity generation emissions. For example, a typical US 2017 BEV has a label electricity consumption of ~25 kWh/100 miles.40 The US electric grid, on average, produces 0.224 g NOx/kWh of generated electricity.41 Assuming 7% grid loss, the BEV produces upstream NOx emissions of 0.06 g/mile, somewhat less than the vehicle standard of 0.086 g NOx + NMHC/mile. The best-in-class ICE vehicle, an HEV, emits 0.004 g NOx + HC/mile,42 ten times less than the BEV. Table 1 compares the emissions of criteria pollutants for the BEV in the US, best-in-class U.S. ICE, U.S. average on-road fleet,10 typical Euro 6 gasoline direct injection (DI) ICE RDE models,43,44 and the EU passenger car and the US LDV standards. Ranking by total NOx emissions per km, new vehicle ICE emissions are less than BEV emissions, and both are below the new vehicle standards. The estimated emission intensity of the 2016 US on-road (ICE) fleet10 shown in Table 1 is comparable to the new vehicle standards and less than BEV total emissions. BEV-related NOx and SO2 emissions in the US are expected to improve over time41,45,46,47 as power generation regulations take effect, including the Cross-State Air Pollution Rule.
As vehicle exhaust emissions have decreased, non-exhaust emissions have become relatively more important.48,49 In particular, PM emitted from tire and brake wear is now comparable to exhaust emissions, as shown in Table 1,50,51,52 but BEVs and ICE vehicles can have different emission levels. Tire wear is a function of many factors: heavier BEVs are expected to give more tire wear PM emissions while brake wear PM emissions can be lower on electrified vehicles, which use regenerative braking. Timmers and Achten53 estimate the total PM emissions (exhaust + non-exhaust, including road wear and resuspension) are similar for ICE vehicles and BEVs. For windshield washer fluid VOC emissions, we assume ICE vehicles and BEVs emit similar amounts because this function is independent of powertrain and fuel.
Future air quality
Air quality models provide insights into the outcomes of future vehicle emission regulations and programs. Modeling for the US shows that when the Tier 3 standards are fully phased-in to the on-road fleet (2030), ozone will be reduced in most areas, but exceedances of the standard can occur.54 The same study also shows diminishing returns of successive vehicle emission regulations. Peak ozone declined by 1–13% from 2008 to 2018 (Tier 1–2) but is only expected to decrease by 1–4% from 2018 to 2030 (Tier 2–3).
European assessments also project substantial air quality improvements. Street canyon modeling in Germany shows significant reduction in local NO2 concentrations as a result of fleet turnover with replacement by Euro 6 RDE-compliant vehicles. By 2030 only 1% of roadside air monitors exceed the NO2 standard compared with 49% in 2015.55 Recognizing that the NO2/NOx ratio of diesel vehicle exhaust is smaller than previously assumed, Grange et al. conclude NO2 may improve faster at roadside monitors than anticipated in current emission inventories.56
The ongoing reductions for LDV emissions mean other sectors have increasingly greater leverage. Nopmongcol et al.57 modeled the effect of electrification of LDVs, HDVs and off-road equipment in the US in 2030. When 8–17% of vehicle travel is electrified, emission reductions lead to modest decreases in ozone and PM2.5 throughout the country. Electrification of off-road equipment (garden equipment, construction equipment) would provide more air quality improvement than on-road electrification. McDonald et al.58 showed that consumer products (adhesives, personal care products, etc.) are becoming the single largest source of petrochemical VOC emissions in industrialized cities.
Conclusions
Vehicle emission reductions and improvement in air quality in the US and EU have been impressive over the last three decades, despite growth of the LDV fleet. As other regions implement the latest US and European emission regulations, similar results can be expected. Regulations and auto manufacturer plans include increased vehicle electrification, further reducing local emissions. With continued improvement in air quality following vehicle emission reductions, it is time to consider the long-term outlook for future vehicle regulations.
Data and observations indicate ICE vehicle emissions may be approaching a ZEV-equivalent level. Modeling shows that successively more stringent vehicle regulations provide diminishing air quality benefit. As the vehicle sector emits a smaller share of the total emissions, other emission-reduction strategies can be more cost-effective in improving air quality. For example, reducing emissions from non-vehicle sources (power generation, house heating, off-road equipment) will yield a greater impact on air quality. Future vehicle emission-reduction efforts might be more profitably targeted on reducing the effect of gross emitters, which represents 2–5% of the fleet but can produce up to half the emissions.59 PHEVs may be used in electric mode where ICE bans are present, offering a solution for commercial, medium-, and heavy-duty vehicles whose duty cycles are not amenable to a fully electric platform. Going forward it will be important to have a more holistic view of emission sources and to assess the most cost-effective actions to achieve the desired air quality improvements.
With the continued reduction in fleet vehicle emissions and anticipated air quality improvement, the key question for industry, regulators, air quality experts, health impact researchers, city planners, and society at large is “How low should we go?”
Data availability
All data are publicly available and cited in the references.
References
TransportPolicy.net. Topics: Emissions standards. http://www.transportpolicy.net/topic/emissions-standards/ (2017).
Wu, Y. et al. On-road vehicle emissions and their control in China: a review and outlook. Sci. Total Environ. 574, 332–349 (2017).
Shelef, M. & McCabe, R. W. Twenty-five years after introduction of automotive catalysts: what next? Catal. Today 62, 35–50 (2000).
Nova, I. & Tronconi, E. (eds) Urea-SCR Technology for deNOx After Treatment of Diesel Exhausts. (Springer-Verlag, New York, 2014).
Piumetti, M., Bensaid, S., Fino, D. & Russo, N. Catalysis in diesel engine NOx after treatment: a review. Catal., Struct. React. 1, 155–173 (2015).
Johnson, T. V. Review of Vehicular Emissions Trends. SAE paper 2015-01-0093 (2015).
Hubbard, C. P., Anderson, J. E. & Wallington, T. J. Ethanol and air quality: influence of fuel ethanol content on emissions and fuel economy of flexible fuel vehicles. Environ. Sci. Technol. 48, 861–867 (2014).
Fegraus, C. E., Domke, C. J. & Marzen, J. Contribution of the vehicle population to atmospheric pollution, SAE Paper no. 730530 (1973).
Bishop, G. A. & Stedman, D. H. A decade of on-road emissions measurements. Environ. Sci. Technol. 5, 1651–1656 (2008).
Bishop, G. A. & Haugen, M. J. On-Road Remote Sensing of Automobile Emissions in the Chicago Area: Fall 2016. CRC Report E-106. https://crcao.org/reports/recentstudies2017/E-106/E-106%20Chicago%202016%20Final%20Report%20v4_Sept%202017.pdf (2017).
Bishop, G. A. & Stedman, D. H. On-Road Remote Sensing of Automobile Emissions in the Tulsa Area: Fall 2015, CRC Report E-106. https://crcao.org/reports/recentstudies2016/E-106%20Tulsa/CRC-106%20Tulsa%202015%20Final%20Report_June2016.pdf (2015).
Chen, Y. & Borken-Kleefeld, J. Real-driving emissions from cars and light commercial vehicles—results from 13 years remote sensing at Zurich/CH. Atmos. Environ. 88, 157–164 (2014).
Commission Regulation (EU). 2016/427 of 10 March 2016 amending Regulation (EC) No 692/2008 as regards emissions from light passenger and commercial vehicles (Euro 6) (Text with EEA relevance). Off. J. Eur. Union 59, 1–98 (2016). L 82.
Commission Regulation (EU). 2016/646 of 20 April 2016 amending Regulation (EC) No 692/2008 as regards emissions from light passenger and commercial vehicles (Euro 6) (Text with EEA relevance). Off. J. Eur. Union 59, 1–22 (2016). L 109.
U.S. Federal Highway Administration. Public Road Mileage, Lane-Miles, and VMT 1920-2015. Highway Statistics 2015, Chart VMT-421c. https://www.fhwa.dot.gov/policyinformation/statistics/2015/vmt421c.cfm (2017).
European Union Transport in Figures: Statistical Pocketbook 2017. https://ec.europa.eu/transport/facts-fundings/statistics/pocketbook-2017_it (2017).
National Bureau of Statistics of China. China Statistical Yearbook 2015, Tables 18–25 and 18–26. http://www.stats.gov.cn/tjsj/ndsj/2015/indexeh.htm (2015).
U.S. EPA. Air pollutant emissions trends data. https://www.epa.gov/air-emissions-inventories/air-pollutant-emissions-trends-data. Accessed 25 September 2017.
EEA. Air pollutant emissions data viewer (Gothenburg Protocol, LRTAP Convention). https://www.eea.europa.eu/data-and-maps/dashboards/air-pollutant-emissions-data-viewer Accessed 4 December 2017.
Edwards, M. R. et al. Vehicle emissions of short-lived and long-lived climate forcers: trends and tradeoffs. Faraday Discuss. 200, 453–474 (2017).
U.S. EPA. National Air Quality: Status and Trends of Key Air Pollutants https://www.epa.gov/air-trends. Accessed 18 October 2017.
U.S. EPA (2017) Air Trends: Ozone Trends. https://www.epa.gov/air-trends/ozone-trends#oznat. Accessed 18 October 2017.
Calvert, J. G., Orlando, J. J., Stockwell, W. R., & Wallington, T. J. The Mechanisms of Reactions Influencing Atmospheric Ozone (Oxford University Press, New York, 2015).
Guerrierio, C. B. B., Foltescu, V. & de Leeuw, F. Air quality status and trends in Europe. Atmos. Environ. 98, 376–384 (2014).
EEA. Percentile 93.2 of the maximum daily 8-hour mean ozone concentrations observed at (sub)urban background stations. https://www.eea.europa.eu/data-and-maps/daviz/26th-highest-maximum-daily-3#tab-googlechartid_chart_11 Accessed 27 November 2017.
European Commission. Air Quality Standards. http://ec.europa.eu/environment/air/quality/standards.htm Accessed 18 October 2017.
EEA. Exceedance of air quality standards in urban areas. https://www.eea.europa.eu/data-and-maps/indicators/exceedance-of-air-quality-limit-3/assessment-3 Accessed 27 November 2017.
Wang, W.-N. et al. Assessing spatial and temporal patterns of observed ground-level ozone in China. Sci. Rep. 7, 3651 (2017). article number.
Wang, T. et al. Ozone pollution in China: a review of concentrations, meteorological influences, chemical precursors, and effects. Sci. Total Environ. 575, 1582–1596 (2017).
Wang, L. et al. Taking action on air pollution control in the Beijing-Tianjin-Hebei (BTH) region: progress, challenges and opportunities. Int. J. Environ. Res. Public. Health 15, 306–332 (2018).
Zhang, Y.-L. & Cao, F. Fine particulate matter (PM2.5) in China at a city level. Sci. Rep. 5, 14884 (2015).
Qiao, X. et al. Source apportionment of PM2.5 for 25 Chinese provincial capitals and municipalities using a source-oriented Community Multiscale Air Quality model. Sci. Total Environ. 612, 462–471 (2018).
Li, X. et al. Source contributions of urban PM2.5 in the Beijing–Tianjin–Hebei region: changes between 2006 and 2013 and relative impacts of emissions and meteorology. Atmos. Environ. 123(Part A), 229–239 (2015).
U.S. EPA. NAAQS Table. https://www.epa.gov/criteria-air-pollutants/naaqs-table. Accessed 18 October 2017.
U.S. EPA. A look back: Ozone in 2016. https://gispub.epa.gov/OAR_OAQPS/SeasonReview2016/index.html?appid=81efd40145584349a40b0869e20ffc3d
EEA. Air quality in Europe 2017. EEA Report No 13/2017. https://www.eea.europa.eu/publications/air-quality-in-europe-2017 (2017).
EEA. Exceedances of air quality objectives due to traffic. https://www.eea.europa.eu/data-and-maps/indicators/exceedances-of-air-quality-objectives-7/assessment (2017).
C40 Cities. Mayors of 12 Pioneering Cities Commit to Create Green and Healthy Streets. October 23, 2017. http://www.c40.org/press_releases/mayors-of-12-pioneering-cities-commit-to-create-green-and-healthy-streets
Petroff, A. These countries want to ban gas and diesel cars. CNN Money, September 11, 2017. http://money.cnn.com/2017/09/11/autos/countries-banning-diesel-gas-cars/index.html
U.S. DOE and U.S. EPA. New All-Electric Vehicles. 2017 Hyundai Ioniq Electric. http://www.fueleconomy.gov (2017). Accessed 30 January 2018.
U.S. Energy Information Administration. Annual Energy Outlook 2017. https://www.eia.gov/outlooks/aeo/ (2017).
U.S. EPA. Annual Certification Data for Vehicles and Engines. 2017 Certified Vehicle Test Result Report Data (XLS). (2017 Toyota Prius C) https://www.epa.gov/compliance-and-fuel-economy-data/annual-certification-data-vehicles-and-engines Accessed 30 August 2017.
Demuynck, J., Favre, C., Bosteels, D., Hamje, H. & Andersson, J. Real-world emissions measurements of a gasoline direct injection vehicle without and with a gasoline particulate filter. SAE 2017-01-0985 (2017).
Dimaratos, A., Triantafyllopoulos, G., Ntziachristos, L., Samaras, Z. Real-world emissions testing on four vehicles. EMISIA SA Report No: 17.RE.004.V1 (2017). https://www.theicct.org/sites/default/files/publications/EU-RDE-Vehicle-Testing_ICCT-EMISIA-Consultant-Report_29082017_vF.pdf.
U.S. EPA. eGRID 2014. (2017) https://www.epa.gov/energy/egrid-2014-summary-tables. Accessed 31 August 2017.
U.S. EPA. 2014 National Emissions Inventory (NEI) Data: Sector Summaries—Criteria and Hazardous Air Pollutants by 60 EIS emission sectors. https://www.epa.gov/air-emissions-inventories/2014-national-emissions-inventory-nei-data. Accessed 31 August 2017.
Energy Information Administration. Electric Power Annual with data for 2014: Table 3.1.A. https://www.eia.gov/electricity/annual/archive/2014/ Accessed 31 August 2017.
Harrison, R. M., Jones, A. M., Gietl, J., Yin, J. & Green, D. C. Estimation of the contributions of brake dust, tire wear, and resuspension to nonexhaust traffic particles derived from atmospheric measurements. Environ. Sci. Technol. 46, 6523–6529 (2012).
Amatoa, F. et al. Urban air quality: the challenge of traffic non-exhaust emissions. J. Hazard Mater. 275, 31–36 (2014).
Grigoratos, T. & Martini, G. Non-exhaust traffic related emissions. Brake and tyre wear PM. Literature Review. JRC Report EUR 26648 EN (2014).
Ntziachristos, L. & Boulter, P. EMEP/EEA air pollutant emission inventory guidebook 2016. Part B 1.A.3.b.vi Road transport: Automobile tyre and brake wear. EEA Report No. 21/2016 (2016).
U.S. EPA. Brake and Tire Wear Emissions from On-road Vehicles in MOVES2014. EPA-420-R-15-018 (2015).
Timmers, V. R. J. H. & Achten, P. A. J. Non-exhaust PM emissions from electric vehicles. Atmos. Env 134, 10–17 (2016).
Collet, S. et al. Evaluation of light-duty vehicle mobile source regulations on ozone concentration trends in 2018 and 2030 in the western and eastern United States. J. Air Waste Manag. Assoc. 64, 175–183 (2014).
Toenges-Schuller, N., Schneider, C., Niederau, A., Vogt, R. & Hausberger, S. Modelling the effect on air quality of Euro 6 emission factor scenarios. J. Earth Sci. Geotech. Eng. 6, 227–244 (2016).
Grange, S. K., Lewis, A. C., Moller, S. J. & Carslaw, D. C. Lower vehicular primary emissions of NO2 in Europe than assumed in policy projections. Nat. Geosci. 10, 914–918 (2017).
Nopmongcol, U. et al. Air quality impacts of electrifying vehicles and equipment across the United States. Environ. Sci. Technol. 51, 2830–2837 (2017).
McDonald, B. C. et al. Volatile chemical products emerging as largest petrochemical source of urban organic emissions. Science 359, 760–764 (2018).
Bishop, G. A., Schuchmann, B. G., Stedman, D. H. & Lawson, D. R. Multispecies remote sensing measurements of vehicle emissions on Sherman Way in Van Nuys, California. J. Air Waste Manag. Assoc. 62, 1127–1133 (2012).
Acknowledgements
We thank Mike Tamor for his vision and insights on this topic.
Author information
Authors and Affiliations
Contributions
T.J.W. and W.C.R. developed the concept; S.L.W. conducted analyses and wrote the paper; J.E.A. and R.V. provided technical reviews; L.G. coordinated the project. All authors edited the manuscript.
Corresponding author
Ethics declarations
Competing interests
The authors declare no competing interests.
Additional information
Publisher's note: Springer Nature remains neutral with regard to jurisdictional claims in published maps and institutional affiliations.
Rights and permissions
Open Access This article is licensed under a Creative Commons Attribution 4.0 International License, which permits use, sharing, adaptation, distribution and reproduction in any medium or format, as long as you give appropriate credit to the original author(s) and the source, provide a link to the Creative Commons license, and indicate if changes were made. The images or other third party material in this article are included in the article’s Creative Commons license, unless indicated otherwise in a credit line to the material. If material is not included in the article’s Creative Commons license and your intended use is not permitted by statutory regulation or exceeds the permitted use, you will need to obtain permission directly from the copyright holder. To view a copy of this license, visit http://creativecommons.org/licenses/by/4.0/.
About this article

Cite this article
Winkler, S.L., Anderson, J.E., Garza, L. et al. Vehicle criteria pollutant (PM, NOx, CO, HCs) emissions: how low should we go?. npj Clim Atmos Sci 1, 26 (2018). https://doi.org/10.1038/s41612-018-0037-5
Received:
Revised:
Accepted:
Published:
DOI: https://doi.org/10.1038/s41612-018-0037-5
This article is cited by
-
A Prospective on Energy and Environment Applications of High Entropy Alloys
Transactions of the Indian National Academy of Engineering (2024)
-
European road transport policy assessment: a case study for Germany
Environmental Sciences Europe (2022)
-
Decarbonization scenarios and carbon reduction potential for China’s road transportation by 2060
npj Urban Sustainability (2022)
-
Hybrid magnetron sputtering of ceramic superlattices for application in a next generation of combustion engines
Scientific Reports (2022)
-
Evaluation of roadside air quality using deep learning models after the application of the diesel vehicle policy (Euro 6)
Scientific Reports (2022)
