
Abstract
Data science can offer answers to a wide range of social science questions. Here we turn attention to the portrayal of women in movies, an industry that has a significant influence on society, impacting such aspects of life as self-esteem and career choice. To this end, we fused data from the online movie database IMDb with a dataset of movie dialogue subtitles to create the largest available corpus of movie social networks (15,540 networks). Analyzing this data, we investigated gender bias in on-screen female characters over the past century. We find a trend of improvement in all aspects of women‘s roles in movies, including a constant rise in the centrality of female characters. There has also been an increase in the number of movies that pass the well-known Bechdel test, a popular—albeit flawed—measure of women in fiction. Here we propose a new and better alternative to this test for evaluating female roles in movies. Our study introduces fresh data, an open-code framework, and novel techniques that present new opportunities in the research and analysis of movies.
Introduction
The film industry is one of the strongest branches of the media, reaching billions of viewers worldwide (MPAA, 2018; UNIC, 2017). Now more than ever, the media has a major influence on our daily lives (Silverstone, 2003), significantly influencing how we think (Entman, 1989), what we wear (Wilson and MacGillivray, 1998), and our self-image (Polce-Lynch et al., 2001). In particular, the representation of women in media has an enormous influence on society. As just one example, a new study shows that “women who regularly watch The X-Files are more likely to express interest in STEM, major in a STEM field in college, and work in a STEM profession than other women in the sample” (Fox, 2018).
Movies are the fulfillment of the vision of the movie director, who controls all aspects of the filming. It is well known that movie directors are primarily white and male (Smith et al., 2017). With such a gender bias, it is not surprising that there is a male gender dominance in movies (Smith and Choueiti, 2010; Ramakrishna et al., 2017). Studies from the past two decades have confirmed that women in the film industry are both underrepresented (University, 2017; Lauzen, 2018b) and portrayed stereotypically (Wood, 1994). A recent study found that the underrepresentation is so sizeable that there are twice as many male speaking characters as female in the average movie (Lauzen, 2018a).
While the gender gap in the film industry is a well-known issue (Lauzen, 2018a; Rose, 2018; Cohen, 2017; Lauzen, 2018b; Wood, 1994), there is still much value in researching this topic. Most previous gender studies can be categorized into two types: the first type offers simple statistics from the data to emphasize the gender gap (Lauzen, 2018b); and the second type introduces more advanced analytical methods, yet generally uses only a small amount of data (Agarwal et al., 2015; Garcia et al., 2014).
In this study, we present Subs2Network, a novel algorithm to construct a movie character’s social network. We demonstrate possible utilizations of Subs2Network by employing the latest data science tools to comprehensively analyze gender in movies (see Fig. 1Footnote 1). This is the largest study to date that uses social network analysis (SNA) to investigate the gender gap problem in the film industry and how it evolved.

The evolution of female representation in the Star Wars movies series.
The study’s primary goals are to answer the following four questions:
Question 1: Are there movie genres that do not exhibit a gender gap?
Question 2: What do characters’ relationships reveal about gender, and how has this changed over time?
Question 3: Are women receiving more central movie roles today than in the past?
Question 4: How has the fairness of female representation in movies changed over the years?
To answer these questions, we first analyzed movie subtitles using text-processing algorithms and a list of movie characters’ names (see Fig. 2). We then developed Subs2Network to construct a movie character’s social network. We created an open-source code framework to collect and analyze movie data, and we used this framework to construct the largest open movie social network dataset that exists today.

Turning subtitles into a network, step by step: a perform named entity recognition on the subtitles; b match the entities to the movie characters; and c link the characters and increase the edge weight by one.
Using the constructed movie social networks, we extracted dozens of topological features that characterized each movie. By analyzing these features, we could observe the gender gap across movie genres and over the last 99 years. Moreover, by utilizing the dataset, we developed a machine-learning classifier, which is able to assess, how fairly women are represented in movies (i.e., if a movie passes the Bechdel test (Bechdel, 1985)).
Our results demonstrate that in most movie genres there is a statistically significant difference between men and women in centrality features like betweenness and closeness. These differences indicate that men are getting more central roles in movies than women (see Fig. 2a, b, and section “Results”). Another sign of the underrepresentation of women in movies is found by analyzing interactions among three characters: only 3.57% of the interactions are among three women, while 40.74% are among three men. These results strengthen previous studies‘ results that women play fewer central roles (Agarwal et al., 2015; Lauzen, 2018b), and indicates that on average women have more minor roles. Our results highlight how and where gender bias manifests in the film industry and provides an automatic way to evaluate it over time.
The key contributions presented in this paper are fivefold:
A novel algorithm (see section “Methods and experiments”) which utilizes movie subtitles and character lists to automatically construct a movie’s social network (see section “Constructing movie social networks” and Fig. 2).
The largest open movie social network dataset, 21 times larger than the previous dataset (Kaminski et al., 2018) (see section “Datasets”). Our dataset contains 15,540 dynamic networks of movies (937 of these networks are networks of biographic movies, which have information about real-world events).
An open-source framework for movie analysis. The code contains a framework to generate additional social networks of movies, facilitating research by creating and analyzing larger amounts of data than ever before.
A machine-learning classifier that can predict if a movie passes the Bechdel test (see section “Constructing the Bechdel test classifier”) and can evaluate the change in gender bias in thousands of movies over several decades (see section “Results”).
Our new and alternative automated Bechdel test to measure female representation in movies. This new test overcomes the weaknesses of the original Bechdel test.
Our study demonstrates that inequality is still widespread in the film industry. In movies of 2018, a median of 30% women and a mean of 33% were found in each movie’s top-10 most central roles. That being said, there is evidence that the gender gap is improving (see Fig. 3).

The change in the percentage of women in top 1, 3, and 10 most central roles over time.
The remainder of this paper is organized as follows: In section “Related work”, we present an overview of relevant studies. In section “Methods and experiments”, we describe the datasets, methods, algorithms, and experiments used throughout this study. In section “Results”, we present our results. Then, in section “Discussion”, we discuss the obtained results. Lastly, in section “Conclusions”, we present our conclusions from this study and offer future research directions.
Related work
Movie social networks
In the past decade, the study of social networks has gained massive popularity. Researchers have discovered that SNA techniques can be used in many domains that do not have explicit data with a network structure. One such domain is the film industry. Researchers have applied SNA to analyze movies, gaining not only new insights about specific movies but also about the film industry in general. For example, using social networks makes it possible to empirically analyze social ties between movie characters.
In 2009, Weng et al. (2009) presented RoleNet, a method to convert a movie into a social network. The RoleNet algorithm builds a network by connecting links between characters that appear in the same scene. RoleNet is based on using image processing for scene detection and face recognition to find character appearances. Weng et al. evaluated their method on 10 movies and three TV shows. The method was used to perform semantic analysis of movies, find communities, detect leading roles, and determinine story segmentation.
In 2012, Park et al. (2012) developed Character-net, another method to convert movies to networks. Character-net builds the social network based on dialog between characters, using script–subtitle alignment to extract who speaks to whom in the scene. Park et al. (2012) evaluated their method on 13 movies. Similar to RoleNet, Character-net was used to detect leading roles and to cluster communities.
In 2014, Agarwal et al. (2014) presented a method for parsing screenplays by utilizing machine-learning algorithms instead of using regular expressions. Their study showed that the parsed screenplay can be used to create a social network of character interactions. In 2015, Tran and Jung (2015) developed the CoCharNet, a method which adds weight to a link in the interaction network, where the weight is a function of the number of times two characters appear together. Tran and Jung used CoCharNet to evaluate the importance of characters in movies. They demonstrated that network centrality features such as closeness centrality, betweenness centrality, and weighted degree can be used to classify minor and main characters in a movie. For instance, they detected the main characters using closeness centrality with a precision of 74.16%.
In 2018, Lv et al. (2018) developed an algorithm to improve the accuracy of creating social networks of movies. They presented StoryRoleNet, which combines video and subtitle analysis to build a more accurate movie social network. The subtitles were used to add additional links that the video analysis might miss. Similar to RoleNet and Character-net, Lv et al. (2018) used the movie social networks to cluster communities and to detect important roles. They evaluated the StoryRoleNet method on three movies and one TV series, for which they manually created baseline networks (Lv et al., 2018).
Also in 2018, a dataset from Moviegalaxies (Kaminski et al., 2018)Footnote 2 was released. Moviegalaxies is a website that displays social networks of movie characters. The dataset contains 773 movie social networks that were constructed based on movie scripts. However, Moviegalaxies did not disclose the exact methods which were used for the construction of the networks.
Evaluating the gender gap
In recent years, there have been many studies that attempt to evaluate the gender gap between males and females across various domains (Jia et al., 2016; Larivière et al., 2013; Lauzen, 2018b; Wagner et al., 2015). For example, in 2018 the World Bank evaluated that the costs of gender bias are vast; gender inequality results in an estimated $160.2 trillion loss in human capital wealth (Worldbank, 2018).
Over the years, researchers have discovered many manifestations of the gender gap in our society. Larivière et al. (2013) discovered that scientific articles with women in dominant author positions receive fewer citations. Wagner et al. (2015) observed that men and women are covered equally on Wikipedia, but they also discovered that women on Wikipedia are portrayed differently from men. Jia et al. (2016) found that in online newspapers, women are underrepresented both in text and images.
The state of women in the film industry is similar to other domains: women are underrepresented and badly portrayed (Lauzen, 2018b; Wood, 1994). The Boxed In 2017–18 report (Lauzen, 2018b) observed a 2% decline in female major characters across all platforms, compared to the previous year.
To tackle the underrepresentation of women in movies in 1985, the cartoonist Alison Bechdel published a test in her comic strip Dykes to Watch Out For to assess how fairly women are presented in filmed media. The Bechdel–Wallace test (Bechdel, 1985) (denoted as the Bechdel test) has three rules that a movie has to pass to be considered “women friendly”:
- 1.
It has to have at least two women in it.
- 2.
The women have to talk to each other.
- 3.
The women must talk about something besides a man.
To Bechdel’s surprise, the media adopted her joke, and today it is a standard for female representation in movies (Douglas, 2017; Morlan, 2014; Hickey, 2014; Shift7, 2018; O’Hare, 2017). Today the Bechdel test is considered to be the mainstream benchmark for assessing the fairness of female representation in movies and today only 57% of current movies pass this test. Additionally, it is currently the only test that has available labeled data for about 8000 (Fest, 2019) out of 516,726 movies available on IMDb (IMDb, 2019b).
The Bechdel test is also used by researchers. In recent years, studies have utilized the test to evaluate gender bias in movies. In 2014, Garcia et al. (2014) quantified the Bechdel test and also applied it to social media. They joined YouTube trailers, movie scripts, and Twitter data, which resulted in 704 trailers for 493 movies and 2970 Twitter shares. Garcia et al. created a social network of dialogues for these movies. Additionally, they constructed a network of dialogues between Twitter users who discussed the trailers. They mapped dialogues between men who were referring to women and between women who were referring to men. This mapping was used to calculate the Bechdel score. They found that trailers of movies which are male biased are more popular. Also, they discovered that Twitter dialogues have a similar bias to movie dialogues (Garcia et al., 2014).
In 2015, Agarwal et al. (2015) studied the differences between movies that pass and fail the Bechdel test. Similar to Garcia et al., Agarwal et al. also constructed social networks using screenplays. They created a classifier to automate the Bechdel test, which was trained on 367 movies and evaluated on 90. In the evaluation, they discovered that network-based features perform better than linguistic features. Additionally, they discovered that movies that fail the Bechdel test tend to have women in less central roles (Agarwal et al., 2015). With this being said, the Bechdel test has several major flaws. The test does not take into account if women are represented stereotypically (Waletzko, 2017). Additionally, there are movies that are considered feminist but do not pass the test (Florio, 2019). Moreover, the test is considered to be a low threshold since a film can pass the test with a single line of dialogue between two women (Shift7, 2018).
In 2017, Ramakrishna et al. (2017) utilized screenplays to study the differences in the portrayal of characters in movies. For the analysis, they used 945 screenplays. Mainly they performed linguistical analysis to capture gender stereotypes. They discovered that movies with female directors have less gender-biased casts. Also, they found that female characters use more positive language than males. Additionally, they constructed social networks from the screenplays and performed centrality analysis. The networks in the study were constructed. For the construction of the networks they used a method that was originally developed for converting books into social networks. In the same year, Sap et al. (2017) used connotation frames to study gender bias in films. They performed their analysis on 7772 movie screenplays, discovering that men were portrayed to have more authority than women. Additionally, they studied the relationship between connotation frames and the Bechdel test. Surprisingly, they found that movies where female characters speak with high agency are less likely to pass the Bechdel test.
Graph features and named entity recognition
Data science tools and techniques have evolved rapidly in the past couple of years (Donoho, 2015). In this study, we primarily utilized data science algorithms from the domains of natural language processing (NLP) and SNA to computationally analyze movie content, movie social network structure, and how movie features change over time.
Namely, we used NLP to extract character names from the movie subtitles by utilizing named entity extraction (NER) algorithms (Nadeau and Sekine, 2007). We used both Stanford Named Entity Recognizer (Finkel et al., 2005) and spaCy Python Package (Honnibal and Montani, 2017) to find where characters appear in the text.
To match characters’ names in the subtitles with characters’ full names, we utilized FuzzyWuzzy (Fuzzywuzzy, 2019), a Python package for fuzzy string matching. Specifically, we used FuzzyWuzzy’s WRatio (Fuzzywuzzy, 2018), a method for measuring the similarity between strings. WRatio uses several different preprocessing methods that rebuild the strings and compare them using Levenshtein distance (Levenshtein, 1966). Also, WRatio takes into account the ratio between the string lengths.
After extracting the movie characters, we constructed the movie social networks and used various graph centrality algorithms, such as closeness, betweenness, degree centrality, and PageRank (Brandes and Erlebach, 2005) to identify the most central characters in each constructed movie network.
Methods and experiments
Constructing movie social networks
One of this study’s primary goals was to develop a straightforward algorithm that would construct the social network of character interaction within a given movie. We achieved this goal by utilizing movie subtitlesFootnote 3 and a list of movie character names. Namely, given a movie, we constructed the movie social network G := 〈V, E〉, where V is the network’s vertices set, and E is the set of links among the network’s vertices. Each vertex v ∈ V is defined to be a character in the movie. Each link e := (u, v, w) ∈ E is defined as the interaction between two movie characters u and v, w times. For a movie with a given subtitle text and a given character list, we constructed the movie’s social network using the following steps (see Fig. 2):
- 1.
First, we detected when each character appeared in the subtitles. To extract the characters from the subtitles we used NER, extracting all the entities which were labeled as a person or an organization. Additionally, for each entity, we stored the time the entity appeared in the movie.
- 2.
Next, we matched the entities found in the subtitles with the character list. It worth mentioning that it is not possible to map one-to-one between the characters in the character list and the characters extracted from the subtitle. For example, in the movie The Dark Knight, Bruce Wayne was referred to as “Bruce Wayne” 3 times, as “Bruce” 16 times, and as “Wayne” 20 times.
- 3.
To address the matching problem, we proposed the following mapping heuristic (see Algorithm 1). First, we split all the roles into first and last names and linked them to the actor and the character’s full name (line 2). Then, if there was only one character with a certain first or last name (one-to-one match), we linked to the character all its occurrences in the subtitles (lines 3–5). However, if we had several characters with the same first or last name, we did not always know who was referred to in the text. For example, in the movie Back to The Future there are three characters with the last name McFly; where only “McFly” was mentioned in the text, we could not determine which character was referenced. Another challenge we encountered was when only part of the character’s name was used. For instance, in the movie The Godfather, the main character is Don Vito Corleone, but he was never mentioned once by his full name because he usually was referred to as “Don Corleone.” Moreover, there are other Corleone family members in the movie. To overcome this challenge, we used WRatio to compare strings and match parts of a name to the full name. Using WRatio, we chose the highest matching character that received a score higher than Threshold (line 6).
Algorithm 1: Matching entities in the movie subtitles with the characters. - 4.
In fact, we were able to overcome many of these problems by using hearing-impaired subtitles. In many hearing-impaired subtitles, the name of the speaking character is part of the text. This property allowed us to avoid most the problems we described earlier and gain additional information. For instance, the movie The Matrix has a scene in which Morpheus calls Neo, and we can know this only because of the tag [PHONE RINGS]. Afterward, there is an annotation “MORPHEUS:” which tells us that Morpheus is the one calling. Without this annotation, we could not know who is on the other end of the line (see Fig. 4).
Fig. 4: Hearing-impaired subtitles for the movie The Matrix. 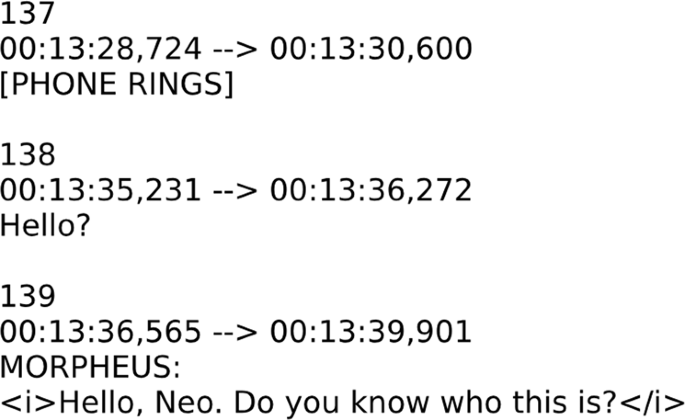
The textual format of subtitles in the SubRip format with additional data for hear-impaired. For example, the speaking charachter name, sounds in a textual fromat, etc.
- 5.
Using the matched characters, we created a link between characters u and v if they appeared in the movie in a time interval less than threshold t seconds (t was defined as 60). For each such appearance, we increased the weight w between u and v by one. Since in subtitles we do not have an indication of when each scene begins and ends, we used a heuristic to model the interaction between characters. We assumed that two characters who appear one after another in a short period of time probably relate. For example, in Fig. 2 we have part of the subtitles from the movie The Matrix. Morpheus introduces himself to Neo, and we know that Morpheus and Neo are talking within an interval of 5 s. Since, 5 s was smaller than the threshold, we increased the link weight between Morpheus and Neo by one.
- 6.
To reduce the number of false positive edges, we filtered all the edges with weight lower than wmin (wmin was defined as 3). There were two main reasons for the formation of edges that did not exist in the movie. The first case was when we matched an entity to the wrong character. The second case happened when in the interval of t seconds there was more than one scene. These kinds of false positive links add noise to the graph. Most of these links have a very low weight; hence, filtering edges with weight lower than wmin helps remove false positive links.

Evaluations of constructed networks
In addition to constructing movie social networks, we also empirically quantified the quality of these networks. Evaluating movie networks is a challenging task. Creating a perfect ground truth is a manual and unscalable process. It requires spending several hours for each movie to manually create ground truth networks. In previous studies (Weng et al., 2009; Park et al., 2012; Tran and Jung, 2015; Lv et al., 2018), manually labeling of movies has been done at a very small scale with only several movies (see section “Related work”). Another option is to use the IMDb or TMDB datasets character lists as a ground truth to evaluate only the network nodes. However, these lists contain mostly unnamed characters that are impossible to detect, for example, Guard #2. To solve this issue we could try using name datasets to filter these lists, but we will lose many characters that have foreign names or characters with unreal names like Batman, Superman, etc. To evaluate the quality of the constructed networks without the presented issues, we compared them to other publicly available movie network datasets. Since it is challenging to manually annotate movies, most of the studies only compared their networks to a handful of manually annotated ground truth networks (see section “Related work”).
In this study, to the best of our knowledge, we performed the first large-scale, fully automatic comparison between movie networks. For the comparison, we used a dataset published in 2018 by Kaminski et al. (2018) (denoted as ScriptNetwork); this is the only other publicly available movie social network dataset. The ScriptNetwork dataset is based on screenplays and can be considered as much easier content to parse than subtitles. Screenplays have additional information such as the exact name of the character who speaks in the scene even if this character is unnamed. For example, freckled kid is a character in the X-Men (2000) screenplay; unnamed characters like freckled kid are almost impossible to detect in regular texts like books or subtitles. Screenplays can be considered very close to the ground truth. However, screenplays sometimes have big differences with the final movie. For instance, in many screenplays, there are missing and even additional characters (see section “Discussion”).
To evaluate Subs2Network-constructed networks, we performed two types of evaluations:
Central character analysis: We tested if the most central roles in Subs2Network are actually the most central roles in the movie. As a ground truth, we used the IMDb ranking list similarly to Tran and Jung (2015). The IMDb characters list is ordered the same way as movie credits, which are ordered alphabetically or by the order of appearance (IMDb, 2019a). For the evolution, we filtered out all the movies where the credits were in alphabetical order, which was only 1%. The actor rank in the credits is considered to be a direct indication of the actor’s power and prestige (Rossman et al., 2010). Furthermore, it is very rare for an actor not in the top-10 credited roles to be nominated for an Academy Award (Rossman et al., 2010). In other words this indicates that in most movies the credit order has a significance, and the top-10 movie credits are likely to include most of the central characters.
We tested if the top-5 and top-10 ranked nodes (characters) at Subs2Network are the top-5 and top-10 ranked on IMDb. Additionally, we performed the same test on networks constructed from screenplays (Kaminski et al., 2018). Our motivation behind this experiment was to verify that Subs2Network’s networks contain the most significant characters in the movie.
Network coverage: We tested if the edges in Subs2Network are the same edges as in other movie networks. For each movie, we created two sub-graphs containing the characters that exist in both networks. Then we calculated the edge coverage in the created sub-graphs. Given two graphs G and H, we define the edge coverage as \({\mathrm {{Coverage}}}_H(G) = \frac{{|E_G\, \cap \,E_H|}}{{|E_H|}}\). We calculated CoverageSubs2Network(ScriptNetwork) and CoverageScriptNetwork(Subs2Network).
In addition to using the Kaminski et al. (2018) dataset for the network evaluation, we also constructed a small dataset of 15 character co-appearance networks utilizing Amazon X-Ray (Stiffler and Sampaco, 2018). The movies in the dataset were selected randomly from the Amazon Prime TV main page,Footnote 4 which includes the most popular movies in the platform. The dataset was constructed semi-automatically in the following way: given a movie, we define the movie’s social network graph Gxray := 〈Vxray, Exray〉. Similar to Subs2Network, each character in the movie is represented as a vertex v ∈ Vxray. Edges are defined as two characters that appear in the same scene according to Amazon X-Ray data. Namely, the set of movie edges Exray is defined to be \(E_{\mathrm {{xray}}}: = \{ (u,v,w)|u,v \in V_{\mathrm {{xray}}}\}\), where w is the number of scenes in which u and v appeared in the same scene. Additionally, as with Subs2Network, we filtered all the edges with weights lower than 3. Similarly to our comparison with the Kaminski et al. (2018) dataset, we also calculated Network Coverage. Additionally, we used the fact that Amazon X-Ray is based on the finished movie, which includes additional data such as the time the character appeared in the movie. By utilizing Gxray, we analyzed how well Subs2Network contains characters by their screen time. To this end, we calculated the total screen time (denoted as screen(v)) of each character in the X-Ray dataset and divided the characters into deciles according to their screen time. Lastly, we calculated for each decile, di, i = 1..10, the percentage of characters that were detected by the Subs2Network algorithm, out of all the characters that were detected by Amazon X-Ray and had screen time in the di decile. Namely, for each di, we calculated \({CharCover}(d_i) = \frac{{|V_{Subs2Network}\, \cap\, \{ v \in V_{\mathrm {{xray}}}| {screen}(v)\, \in \,d_i\} |}}{{\{ v\, \in \,V_{\mathrm {{xray}}}| {screen}(v)\, \in \,d_i\} }}\).
Datasets
To evaluate and test our movie social network construction algorithm described above on real-world data, we assembled large-scale datasets of movie subtitles and movie character lists. In addition, we collected movie character lists from the IMDb (Internet Movie Database) websiteFootnote 5 and movie subtitles from 15,540 movies. Furthermore, we also used data from Bechdel test scores of 4658 movies. In the following subsections, we describe in detail the datasets we used.
IMDb dataset
To collect movie and actor data, we used IMDb, which is an online site that contains information related to movies, TV series, video games, etc. (IMDb, 2019b). IMDb data is contributed by users worldwide. It contains 5,487,394 titles from which 505,380 are full-length movies (IMDb, n.d.). In this study, we used the official IMDb dataset.Footnote 6 From the IMDb dataset, which contains only a subset of the IMDb database, we mainly used movies’ titles, crews, and ratings data.
Subtitle dataset
To inspect gender bias in movies, we decided to extract information out of subtitles. Subtitles are freely and widely available online on numerous sites. For instance, OpenSubtitles.orgFootnote 7 alone hosts more than 500,000 English subtitles (opensubtitles.org, 2019) that were manually created by the community. We collected the subtitles using SubliminalFootnote 8, a Python library for searching and downloading subtitles. Subliminal downloads subtitles from multiple sources, and using an internal scoring method, it decides which subtitles are the best for a specific movie. Using Subliminal, we downloaded subtitles for 15,540 movies.
Bechdel test dataset
Bechdel test data is available at Bechdel Test Movie ListFootnote 9, which is a community-operated website where people can label movies’ Bechdel scores. Using the Bechdel Test Movie List API, we downloaded a dataset that contains 7871 movies with labeled Bechdel scores, from which only 7322 are full-length movies.
Even for humans, it is a challenging task to determine if a movie actually passes the Bechdel test; Bechdeltest.com has a comments section where users discuss the scores and their disagreements (Agarwal et al., 2015). For example, according to Bechdeltest.com, the movie The Dark Knight Rises failed the test. However, by taking a closer look at the community comments,Footnote 10 we noticed users arguing regarding the test results, which are hard to determine.
Dataset preprocessing
The most critical part of building a social network of characters’ interaction is mapping correctly between the characters in subtitles and the characters in the character list. The IMDb character data includes data on even the most minor roles such as a nurse, guard, and thug #1. These nameless minor characters are almost impossible to map correctly to their subtitle appearances. Usually, they just add false positive edges and do not add additional information.
To clean the data from nameless characters, we created a blacklist of minor characters (for a detailed explanation of the blacklist construction process see Section S.1). Additionally, to validate the characters’ names we used TMDb (The Movie Database)Footnote 11, another community-built movie database. For each character, we matched the IMDb and TMDb data by the actor name. Then, we compared the lengths of the character names and kept the longer one. The usage of the longer names captures more variations of the name and helped us match more occurrences of the character in the subtitles. For example, in the film The Godfather (1972) James Caan portrays Sonny Corleone. Not surprisingly, on IMDb he is called Sonny Corleone, but on TMDB he is named Santino Sonny Corleone. In the film, he is addressed 12 times as Santino. By using the longer name, we can map these instances to the character.
Analyzing movie social networks to identify gender bias
Network features
To study gender bias in movies, we calculated five types of features: vertex features, network features, movie features, gender representation features, and actor features. Through the study, we analyzed how these features change over time. Additionally, we used these features to construct machine-learning classifiers. To create a ground truth for actors’ gender, we had to determine whether each actor was male or female. For most of the characters, we extracted the gender from IMDb similarly to Danescu et al. Danescu-Niculescu-Mizil and Lee (2011). IMDb has an attribute of “actor” or “actress,” which allowed us to identify gender. As we mentioned earlier, the IMDb dataset is only partial, so to overcome this issue we used a dataset that maps the first name to the gender.Footnote 12 In the rest of this section, we supply the definitions of these features.
Vertex features: For a given v ∈ V, a neighborhood is defined as a set of v friends, Γ(v). Following are the formal definitions of the vertex-based features:
Total Weight : The total weight of all the edges, which represents the number of character v appearances in the movie, \({\mathrm {{Total}}}_{\mathrm {w}}(v) = \mathop {\sum}\nolimits_{\{ (v,u,w)|\left( {(v,u,w) \in E} \right.\} } w\).
Closeness Centrality: The inverse value of the total distance to all the nodes in the graph. It is based on the idea that a node closer to other nodes is more central, \(C_{\mathrm {c}}(v) = \frac{1}{{\mathop {\sum}\nolimits_{v \in V} d (v,u)}}\) Brandes and Erlebach (2005), where d(v, u) is the shortest distance between v and u.
Betweenness Centrality: Represents the number of times that a node is a part of the shortest path between two nodes Brandes and Erlebach (2005). A junction (node) that is part of more paths is more central, \(C_{\mathrm {b}}(v) = \mathop {\sum}\nolimits_{s,t \in V} {\frac{{\sigma (s,t|v)}}{{\sigma (s,t)}}}\) Brandes and Erlebach (2005), where v ≠ s ≠ t, σ(s,t) is the number of those paths passing through some node v.
Degree Centrality: A node that has a higher degree is considered more central, \(C_{\mathrm {d}}(v) = \frac{{|{\mathrm{\Gamma }}(v)|}}{{|V|\, - \,1}}\) Brandes and Erlebach (2005).
Clustering: Measures link formation between neighboring nodes, \(C(v) = \frac{{2T(v)}}{{|{\mathrm{\Gamma }}(v)|(|{\mathrm{\Gamma }}(v)|\, - \,1)}}\) (Saramäki et al., 2007), where T(v) is defined as the number of triangles through vertex v where a triangle is a closed triplet (three vertices that each connect to the other two).
Pagerank: A node centrality measure that takes into account the number and the centrality of the nodes pointing to the current node Brandes and Erlebach (2005).
Network features
Edge Number—the number of edges in the network |E|.
Vertex Number—the number of vertices in the network |V|.
Number of Cliques—the number of maximal cliques in the network Brandes and Erlebach (2005).
Statistical Network Features—set of features which are based on the vertex features. From these features, we calculate statistical features for the entire network. We calculate the mean, median, standard deviation, minimum, maximum, first quartile, and third quartile.
Gender representation features
Triangles with N women: The number of triangles that contain N females and 3-N males, where N ∈ 1, 2, 3.
Percent of triangles with N women: The percent of triangles that contain N females and 3-N males, where N ∈ 1, 2, 3.
Females in Top-10 roles: The number of females in top-10 roles ordered by PageRank.
Male count: The number of male actors in the movie.
Female count: The number of female actors in the movie.
Movie features:
Release Year—the year when the movie was first aired.
Movie Rating—the rating the movie has on IMDb.
Runtime—the movie total runtime in minutes.
Genres—the movie genre by IMDb.
Number of Votes—number of votes by which the rating was calculated on IMDb.
Actor features:
Actor Birth Year—the year the actor was born.
Actor Death Year—the year the actor died.
Actor Age Filming—the age of the actor when the movie was released (\(Release\,Year - Actor\,Birth\,Year\)).
Network feature analysis
To examine the state of the gender gap, in movies generally and by genre in particular, we analyzed only the most popular movies (movies which had more than n votes on IMDb). We analyzed only the most popular movies since they have better, more correct data, and more importantly, better represent the mainstream media. To decide on n, we observed the distribution of movies by year. We found a right-tailed distribution and decided that n = 2000 should be a large enough number. To answer our first research question—if there are genres that do not show a gender gap (see section “Introduction”)—we calculated vertex and actor features (see section “Network features”) for all the roles. Next, we split the data by gender and movie genre. Finally, we utilized a Mann–Whitney U (Mann and Whitney, 1947) test on these features to check if there are statistical differences between the male and female roles in different genres.
To study relationships in movies, and to answer our second question regarding what relationships reveal about gender, we calculated all the relationship triangles in the network and grouped them by the number of women in each triangle. Afterward, we segmented the triangles by genres and how they changed over time.
To investigate the role of centrality by gender, our third research question regarding the centrality of female roles, we calculated PageRank for the nodes in all our movie networks. We analyzed the number of men and women in the top-10 characters in movies and examined how this number has changed over the years.
Constructing the Bechdel test classifier
As we described in section “Related work”, the Bechdel test is used to assess how fairly women are represented in a movie. The test has three criteria:
- 1.
Are there at least two named women in the movie?
- 2.
Do the women talk to each other?
- 3.
Do the women talk about something other than men?
These criteria are hierarchical; hence, if a movie passes the last test, it has passed all of the tests.
To train the classifier, we extracted all the network, vertex, and gender representation features (see section “Network features”). For testing the trained model, we used the 1000 newest movies in the Bechdel test dataset.Footnote 13 The rest of the movies were used as the training set. As for the classifier, we used Random Forest with max depth 5 to avoid overfitting. For the classifier evaluation, we used AUC. This measure presents how many of the results the classifier is confident it classified correctly. Additionally, we compared our results to the results of Agarwal et al. (2015).
To answer the fourth research question regarding the fairness of female representation, we analyzed the change in the average probability of a movie passing the Bechdel test over time. Additionally, using the Random Forest feature importance, we inspected which feature was the most important for the Bechdel test classification. Finally, we analyzed the change over time by genre.
Alternative test
The Bechdel test has several major shortcomings; for instance, a movie passes the test if it consists of only one sentence between two women who do not speak about a man. For instance, American Pie 2, which by no means can be considered to be a movie that fairly presents women, passes the Bechdel test in such a way. To offer solutions to the problems with the Bechdel test (see section “Discussion”), we propose a new gender equality test. We believe that a good test can be created by comparing the number of interactions according to each gender. Hence, we propose an interaction test that compares the total degree of male and female nodes. By utilizing over 15,000 movie social networks in our datasets, we observed that in only 16.7% of movies do female characters have an equal or higher total degree than male characters. Moreover, in 55.8% of analyzed movies, the total degree of male characters is at least twice as high as female characters. We think that a good rule of thumb for a movie should be \(0.8\, < \,\frac{ {{TotalDegree}_{\mathrm {F}}}}{{ {TotalDegree}_{\mathrm {M}}}}\, < \,1.2\). The Gender Degree Ratio test is neither male nor female-biased; it is a gender equality test.
To evaluate the ability of the proposed test to distinguish between gender-biased and gender-equal movies, first we calculated the Gender Degree Ratio for all the movies in our dataset. Next, we performed significance tests between groups of movies with and without gender bias. Before performing the significance tests, we performed a Shapiro–Wilk test on the Gender Degree Ratio scores of our dataset to test if they distributed normally. To create the gender-biased and gender-equal movie lists, we utilized the three following movie lists:
- 1.
The 100 best feminist films of all time (Rothkopf, 2018): From this list we had 67 movies in our dataset (see Section S.2). We used this list to test if feminist movies get higher Gender Degree Ratio scores than the general population of movies.
- 2.
100 Must see movies: The Essential Men’s Movie Library (McKay and McKay, 2019)—from this list we had 79 movies in our dataset (see Section S.2). This goal of using this list was to see if our test would give lower scores to male-centric movies than to the general population.
- 3.
17 Blockbuster movies that surprisingly pass the Bechdel test (Allen, 2019)—this list contains movies where women are not presented fairly but still pass the Bechdel test. From this list we had 15 in our dataset (see Section S.2). The goal of testing these movies was to validate that they should fail the proposed test.
For the first two lists, we performed a significance test and compared their scores with the general population of movies. Additionally, the third list was used to test if the Gender Degree Ratio dealt with the shortcomings of the Bechdel test, specifically whether a movie with poor female representation yet passed the Bechdel test would fail our suggested ratio test.
Results
To analyze the gender gap in the film industry, we analyzed subtitles of movies that had at least 1000 votes on IMDb. This resulted in a dataset containing 15,540 movies, which is a dataset 20 times bigger than the largest movie dataset currently available (Kaminski et al., 2018).
First, we analyzed the gender gap, in general, and by genres, in particular (see Tables S1 and S2). We found that the genres with the largest number of features that are distributed similarly between men and women are film-noir, history, horror, music, musical, mystery, and war. In these genres, 9 out of 10 features distribute similarly; only the clustering coefficient distributes differently between men and women. In terms of features, Total Weight and Weighted Betweenness are the features that distribute most similarities between the genders, with 15 out of 21 genres distributing the same. On the other side of the scale, Age Filming is the feature that distributes least similarly, with 0 out of 21 genres distributing similarly.
Second, to examine relationships among characters, we analyzed relationship triangles in the networks. We found that most triangles have three men, and triangles with three women are the least common (see Table 1). Out of 21 genres, in 8 genres the most common type of triangle is 3 men (without any women) and in all the others it is 2 men and a woman. According to the results, Romance is the genre with the most interaction among women and War is the genre where women have the least interaction. Inspecting the change in the number of triangles over time (see Fig. 5), we can observe that in many genres there is an equalizing improvement over the years, but there are genres like Sport without a big change.

The change in the number of females in relationship triangles for each decaded for different genres.
Third, we analyzed how characters are ranked in terms of centrality (see Table 2). We found that among central roles, there are considerably more men than women. For example, men have about twice the roles that ranked in the top-10 most central roles than women. In all top-10 most central roles, the female percentage is the same except for the most central role.
Fourth, we analyzed the gender composition of the top-10 central roles in movies (see Fig. 6). We discovered that most of the movies have more men in central roles than women. Moreover, from the data, we can observe that there are almost no movies with no men and 10 women in the top-10 roles. Also, there are a considerable number of movies where the majority of the top-10 most central roles are men.

The distribution of movies by gender of the top-10 most central characters where: a The percentage of movies where out of top-10 role N are of a specific gender. b The number of movies where out of top-10 role N are of a specific gender.
Fifth, we wanted to observe how the percentage of women in top 1, 3 and 10 most central roles has evolved over time. We analyzed the change in this metric over almost from 1965 up to todayFootnote 14 (see Fig. 3).
It can be seen from the network that there is a constant rise in the number of women in top-10 most central roles.
Sixth, to create an automatic classifier that can assess the fairness of female representation in movies, we created the Bechdel test classifier. Our classifier achieved an AUC of 0.81. We also inspected which feature was more important (see Table 3). Seven of 10 features were triangle-based features. Moreover, all the features in the table are a subset of the Gender Representation Features (see section “Network features”).
Next, we trained our automated Bechdel test classifier on all the labeled data and calculated the average probability of the classifier by decade on all the unlabeled data (see Fig. 7). We can see that there is a trend of growth. Also, we examined how the probability changed by genres (see Fig. 8). Comparing our results to Agarwal et al. (2015) (see Table 4), we found that our classifier performs better than Agarwal’s in terms of F1 score.

Trend line of the average probability of passing the Bechdel test in the past 60 years by decade.

The average probability of a movie passing the Bechdel test by decade and genre.
Afterward, we analyzed the quality of the constructed social networks by comparing Subs2Network with the ScriptNetwork-released networks (Kaminski et al., 2018). We observed that the Subs2Network dataset contains 628 out of the 773 networks that appear in the ScriptNetwork dataset. On average, Subs2Network had more central characters than ScriptNetwork from the top-10 most central characters (see Table 5); for instance, in the top-10 characters Subs2Network matched 6.06 characters while ScriptNetwork matched 5.35 characters. In terms of edge coverage, we found that Subs2Network covered 65.4% of the edges in ScriptNetwork networks and ScriptNetwork covered 65.1% of the edges in Subs2Network networks. Additionally, we compared Subs2Network with networks we generated based on manually extracted Amazon X-Ray movie data. We observed that Subs2Network matched X-Ray nodes and edges at 79.6% and 54.5%, respectively. Additionally, when analyzing character matching by screen time, we found that we could detect main characters with a high accuracy of up to 96.4% (see Fig. 9).

The percent of character that are overlapping between Amazon X-Ray and Subs2Network where the x axis is the screen time of the charcters.
Finally, we analyzed the Gender Degree Ratio test. We found that the average score of all the movies in the dataset was 0.6, meaning there were only 6 female interactions for every 10 male interactions. In fact, we found that today only 12% of all movies pass the gender degree ratio test by having scores between 0.8 and 1.2 (see Fig. 10). For instance, Resident Evil: Retribution and The Age of Innocence pass the test with scores of 1.06 and 0.94, respectively. On the other hand, Armageddon and Batman Begins fail the test with scores of 0.2 and 0.24, respectively. To check if the proposed test can distinguish between gender-biased and non-biased movies, we performed significance tests on two groups of movies. First, by performing the Shapiro–Wilk test, we observed that the movie scores were not from a normal distribution. Since the data was not normally distributed, we performed the Mann-Whitney-U test and found that list 1 (feminist movie list) distributed differently from the general population (μ = 1.26, p-value = 6.7 × 10⁻¹⁵). Also, we discovered that list 2 (male-biased movie list) scores also distributed differently from the general population (μ = 0.34, p-value = 8.5 × 10−07). Regarding the movies that surprisingly passed the Bechdel test, only the movie Grease passed the Gender Degree Ratio test.

The number of movie and the ratio of between female and male characters.
Discussion
In this study, we present a method that converts movie subtitles into social networks, and we analyze these networks to study gender disparities in the film industry. Using this method, we created the largest available corpus of movie character social networks. The method and the corpus are available for use by other researchers to study additional movies and even TV shows, and it has the potential to revolutionize the study of filmed media.
When looking at relationship triangles, we can see that in 77% of all triangles men are in the majority. In an equal society, we would expect to find that the number of triangles with three men, with three women, and with two men and two women would be the same. However, we discovered that, on average, there are 11.4 times more triangles with three men than with three women, and almost twice as many triangles with two men than two women. At a deeper level of granularity, we can see a difference in the number of triangles between different movie genres. The Romance genre has the highest number of triangles that have two and three women. On the other side of the scale, 90.6% of triangles in the War genre have a majority of men. This result makes sense intuitively. By looking at Fig. S.1, we can see that genres with a higher percentage of movies that pass the Bechdel test also have a higher percentage of triangles with a majority of women.
In terms of centrality (see Table 2), we can see that men have more central roles than women. We expected to find more females in less central roles, but the percentage of females distributes evenly in the top-10 most central roles. We believe that these results correspond to the total percentage of women in the dataset, which is 32.3% and is very similar to previous studies of Lauzen (2018a) and Sap et al. (2017). This number is still lower than the total percentage of female roles in IMDb, which is 37.2%.
We also analyzed how many roles in a movie’s top-10 most central roles are those of women. Unsurprisingly, there is a dominance of movies with a majority of men. For instance, all Lord of the Rings movies have 10 men in the top-10 roles. We found only 5 films where all top-10 roles were female, and each of these featured only women (one of these films is called The Women, another movie Caged is about a women’s prison, and the movie The Trouble with Angels is about a girls’ school).
There is also the issue of what is considered fair. Mencarini (2014) states that fairness in gender context varies between cultures and historical periods. Sometimes women perceive their life as fair from a gender equality perspective while actually it is very low, and sometimes it is exactly the contrary. In a film context, some may argue that it is fair for war movies to have almost no women, while others will argue that it is not fair since women have taken part in all wars. Since fairness is subjective to measure, we used the Bechdel test, which is defined as “the basic measure to see if women are fairly represented in the film” (Fest, 2019). Centrality and fairness can sound very similar in the context of films, but they are two different notions. A character can be very central and very stereotypical at the same time. For example, Cinderella is the protagonist (most central character) in her story, but she is cooking and cleaning all day, and her life becomes better only when a rich and handsome prince arrives.
We also presented an automated Bechdel test classifier that can help assess the fairness of how women are presented in movies. We trained our model on data collected from bechdeltest.com, and we have indications that our model is even more accurate than the above presented results. We found that many movies on bechdeltest.com are misclassified. For example, The Young Offenders passes the test on bechdeltest.com (although the site does state this result is ‘dubious’), but our work classifies it as a fail. The reverse is true for the movie Never Let Go. Based on these observations, we believe that our classifier can automatically classify movies with high confidence in the classification. Moreover, while the Bechdel test is certainly a useful and important test, it fails to account for many parameters such as the centrality of the characters, repression, etc. Basically, if there is a movie with only two women who appear in one scene and talk about something other than men for 2 seconds, then the movie will pass the traditional Bechdel test. However, this is the only test that has data that can be used to train a classifier. Our classifier partially tackles this problem since it calculates a score of how strongly the movie passes the test.
To deal with the issues of the Bechdel test, we proposed a new test based on the ratio of the number of female interactions to the number of male interactions in a movie. We found that only 12% of all movies passed our Gender Ratio test (see Fig. 10), revealing how dominant gender disparities continue to be in the film industry. As anticipated, we found in our test that feminist movies received higher scores than the average movie. Additionally, we discovered that movies that passed the Bechdel test but did not have good female representation failed the Gender Ratio test, just as we had hoped. These results indicate that our proposed test dealt with some of the major problems of the Bechdel test and has the ability to differentiate between films with good and bad female representation. However, the test is not perfect and does not take into account context. For instance, we can see that Grease passed our test even though women in the film were presented stereotypically.
In future work, we are planning to perform statistical tests to compare the distributions of the degrees of male and female nodes and present a more accurate test. Creating a more accurate assessment of how women are truly represented in films requires manually watching thousands of movies and labeling data, which is impossible with the current research limitations. In the future, we plan to develop a more advanced method based on deep learning to create a better algorithm that will be able to create a much more accurate assessment of movie gender equality, taking into account additional parameters such as the context of the movie.
We also calculated the average probability of passing the Bechdel test for all the movies in our dataset that do not have a Bechdel test score. Afterward, we inspected the change in the average probability of movies passing the test over a long period of time and by different genres. In almost all genres there is a trend of improvement, and there is a correlation between relationship triangles and the Bechdel score. Looking at Fig. 8, we see that historically war movies have the lowest probability of passing the Bechdel test.
There are many factors that affect our method’s accuracy. The most critical factor is the quality of both the subtitles and the cast information from IMDb. In movies where the name of the character in the subtitles does not correspond to IMDb data, the actor cannot be linked to a character. During our study, we stumbled upon subtitles with spelling mistakes and other inconsistencies. Also, in some movies like superhero movies, we did not know how to link the different identities of a character with names such as “Captain America,” that potentially could be filtered because it looks like a nameless character. In addition, nameless characters like “Street Pedestrian” sometimes eluded our cleaning process. There is a balance between cleaning the IMDb data too much and not enough. We observed that more accurate networks were in movies that had hearing-impaired subtitles since they have additional data and are less affected by the NER accuracy. Some of these limitations will be addressed in future research. Additionally, there are many different improvements that can done to increase the accuracy of the networks; for instance, it is possible to use co-reference resolution, train an NER for subtitles, etc.
One of the biggest challenges of this study was to evaluate the quality of the constructed movie networks. For the evaluation, we compared the networks created by our algorithm with the networks created by screenplay analysis and by Amazon X-Ray. Screenplays have easier content to analyze than subtitles, and they contain plenty of structured information, such as character names, scenes, etc. However, there are also some shortcomings in using screenplays. First, only a small fraction of movies have screenplays available online. Currently, the Internet Movie Script Database (IMSDb)Footnote 15 has only 1198 scripts, while there are hundreds of thousands of movies’ subtitles available online. Moreover, many publicly available screenplays are drafts and have major differences from the actual movies. For instance, the Minority ReportFootnote 16 screenplay used by Kaminski et al. is completely different from the movie; almost all the characters’ names are different. Another example can be found in the X-Men (2000) movie where the character Beast appears in the screenplay. However, due to over-budget concerns, Beast was cut from the movie. From inspecting screenplays, we discovered many additional examples of extra, missing, and renamed characters. These problems show that comparing subtitles to screenplays is like comparing apples to oranges. The comparison indicates that there is a similarity between the networks, but it cannot be used as a precise measure of accuracy.
In addition to using screenplays to evaluate the constructed networks, we also used networks that were generated based on Amazon X-Ray. Unlike the screenplays, Amazon X-Ray is based on the finished movie and offers a more accurate representation of the movie’s social network. Using the X-Ray based networks, we found that even though sub2network is based on much less data than the X-Ray based networks, the networks are very similar. This similarity indicates that our graphs represent the essence of the movie. The biggest limitation in using X-Ray to generate movie social networks is that the full X-Ray dataset is not publicly available, and must be extracted manually.
There is no doubt that the presented method is not perfect. For instance, in the film Star Wars: Episode VI—Return of the Jedi (see Fig. 1), Princess Leia never meets Obi Wan Kenobi. Obi Wan Kenobi only talks with Luke about her, which created an edge in the graph. Nonetheless, from the network evaluation, we learn that the constructed networks represent the movie and have enough correct data to supply insights. Moreover, it is possible to perform many calibrations and parameter tunings to improve the method’s accuracy; for instance, we can manually select better subtitles to get more accurate networks. Such calibrations are out of the scope of this study, but in future studies we will explore such options.
Besides utilizing subtitles and screenplays, there are other possible ways to analyze movie content. The first option is to analyze movie videos as Weng et al. (2009) did. The problem with video analysis is that it is an expensive process which requires high computational power, especially when the plan is to analyze thousands of full-length movies. Moreover, most movies are copyrighted and not freely available online. The second option is to use speech recognition to extract information, which is what Park et al. (2012). However, this option has similar drawbacks.
Conclusions
Data science can provide great insights into many problems, including the gender gap in movies. In this work, we created a massive dataset of movie character interactions to present the largest-to-date SNA of gender disparities in the film industry. We constructed this dataset by fusing data from multiple sources, and then we analyzed the movie gender gap by examining multiple parameters over the past century.
Our results demonstrate that a gender gap remains in nearly all genres of the film industry. For instance, 3.5 times more relationship triangles in movies have a majority of men. In terms of top-10 most central movie roles, again there is a majority of men. However, we also saw an improvement in equality over the years. Today, women have more important movie roles than in the past, and our Bechdel test classifier quantifies this improvement over time by calculating a movie’s overall score. In a future study, we plan to analyze TV series, actors’ careers, and directors’ careers in a similar in-depth manner. We also plan to implement the tests that were proposed in (Walt et al., 2017) as well as develop new tests to gain further insight into how genders are represented in the film industry.
Data availability
The code and datasets generated during and analysed during the current study are available in the on the project’s website (http://data4good.io/dataset.html#Movie-Dynamics) and repository (https://github.com/data4goodlab/subs2network).
Notes
The Star Wars icons were created by Filipe de Carvalho and are licensed under CC BY-NC 4.0)
Many of the used movies’ subtitles were created by crowd-sourcing, i.e., by people who volunteered to create the subtitle.
American Beauty, Back to the Future, Back to the Future Part II, Funny People, Gladiator, Inglourious Basterds, Jurassic Park, Knight and Day, Marley & Me, Public Enemies, Serenity, Street Kings, Terminator 2 Judgment Day, The Godfather, The Godfather Part II.
https://bechdeltest.com/. Note the site uses the Bechdel test variation where women have to have names.
Similarly to Agarwal et al. (2015) this about 20%.
The bechdeltest.com data is mostly based on newer movies and there is too much noise in the graph for movies before 1965.
References
Agarwal A, Balasubramanian S, Zheng J, Dash S (2014) Parsing screen-plays for extracting social networks from movies, in ‘Proceedings of the 3rd Workshop on Computational Linguistics for Literature (CLFL)’, Associationfor Computational Linguistics, Gothenburg, Sweden, pp. 50–58
Agarwal A, Zheng J, Kamath S, Balasubramanian S, Dey SA (2015) Key female characters in film have more to talk about besides men: automating the Bechdel test. In: Proceedings of the 2015 Conference of the North American Chapter of the Association for Computational Linguistics: Human Language Technologies. pp. 830–840
Allen J (2019) 17 blockbuster movies that surprisingly pass bechdel test. https://thewhisp.mommyish.com/entertainment/movies/blockbuster-movies-pass-bechdel-test-surprising/. Accessed on 14 Jan 2020
Bechdel A (1985) The rule. Dykes to Watch Out For Ithaca, New York: Firebrand Books
Brandes U, Erlebach T (2005) Network analysis. Lecture notes in computer science, vol. 3418
Cohen A (2017) Women and hollywood sexism in the film industry problem. https://www.refinery29.com/en-us/2017/10/175956/melissa-silverstein-women-hollywood-gender-inequality. Accessed on 17 Dec 2018
Danescu-Niculescu-Mizil C, Lee L (2011) Chameleons in imagined conversations: a new approach to understanding coordination of linguistic style in dialogs. In: Proceedings of the 2nd Workshop on Cognitive Modeling and Computational Linguistics. Association for Computational Linguistics. pp. 76–87
Donoho D (2015) 50 years of data science. http://courses.csail.mit.edu/18.337/2015/docs/50YearsDataScience.pdf
Douglas N (2017) The bechdel test, and other media representation tests, explained. https://lifehacker.com/the-bechdel-test-and-other-media-representation-tests-1819324045. Accessed 23 Jan 2019
Entman RM (1989) How the media affect what people think: an information processing approach. J Politics 51(2):347–370
Fest BT (2019) About|Bechdel test fest. http://bechdeltestfest.com/about/. Accessed 21 Nov 2019
Finkel JR, Grenager T, Manning C (2005) Incorporating non-local information into information extraction systems by Gibbs sampling. In: Proceedings of the 43rd annual meeting on Association for Computational Linguistics. Association for Computational Linguistics, pp. 363–370. https://doi.org/10.3115/1219840.1219885
Florio A (2019) 22 movies that don’t pass the bechdel test but are still pretty darn feminist. https://www.bustle.com/p/22-movies-that-dont-pass-the-bechdel-test-but-are-still-pretty-darn-feminist-16961528. Accessed 2 Jul 2019
Fox C (2018) The scully effect: I want to believe in stem. https://seejane.org/wp-content/uploads/x-files-scully-effect-report-geena-davis-institute.pdf. Accessed 15 Nov 2019
Fuzzywuzzy (2018) Fuzzywuzzy wratio function code. https://github.com/seatgeek/fuzzywuzzy/blob/df5b67a32d7ddaf2e86fe1247b6ff7e3b57e0805/fuzzywuzzy/fuzz.py#L224. Accessed 17 Feb 2019
Fuzzywuzzy (2019) Fuzzy string matching in python. https://github.com/seatgeek/fuzzywuzzy. Accessed 4 Feb 2019
Garcia D, Weber I, Garimella VRK (2014) Gender asymmetries in reality and fiction: the Bechdel test of social media. In: ‘ICWSM’, pp. 131–140
Hickey W (2014) The dollar-and-cents case against hollywood’s exclusion of women | fivethirtyeight. https://fivethirtyeight.com/features/the-dollar-and-cents-case-against-hollywoods-exclusion-of-women/. Accessed 23 Jan 2019
Honnibal M, Montani I (2017) spacy 2: natural language understanding with bloom embeddings, convolutional neural networks and incremental parsing, in press
IMDb (2019a) How are cast credits ordered? why don’t the main stars appear at the top of the cast? https://help.imdb.com/article/contribution/filmography-credits/how-are-cast-credits-ordered-why-don-t-the-main-stars-appear-at-the-top-of-the-cast/G39K5N4YYV2QJ4GR?ref_=helpsect_pro_3_4#. Accessed 22 Nov 2019
IMDb (2019b) Press room—imdb. https://www.imdb.com/pressroom/?ref_=helpms_ih_gi_whatsimdb. Accessed 15 Dec 2018
IMDb (n.d.) Press room—imdb. https://www.imdb.com/pressroom/stats/. Accessed 17 Dec 2018
Jia S, Lansdall-Welfare T, Sudhahar S, Carter C, Cristianini N (2016) Women are seen more than heard in online newspapers. PLoS ONE 11(2):e0148434
Kaminski J, Schober M, Albaladejo R, Zastupailo O, Hidalgo C (2018) Moviegalaxies-social networks in movies. Harvard Dataverse
Larivière V, Ni C, Gingras Y, Cronin B, Sugimoto CR (2013) Bibliometrics: global gender disparities in science. Nat News 504(7479):211
Lauzen M (2018a) It’s a man’s (celluloid) world: portrayals of female characters in the 100 top films of 2017. Center for the Study of Women in Television and Film
Lauzen MM (2018b) Boxed in 2017–18: Women on screen and behind the scenes in television. Technical report, San Diego State University
Levenshtein VI (1966) Binary codes capable of correcting deletions, insertions, and reversals. Sov Phys dokl 10:707–710
Lv J, Wu B, Zhou L, Wang H (2018) Storyrolenet: social network construction of role relationship in video. IEEE Access 6:25958–25969
Mann HB, Whitney DR (1947) On a test of whether one of two random variables is stochastically larger than the other. The Annals of Mathematical Statistics 18(1):50–60
McKay B, McKay K (2019) 100 must see movies: the essential men’s movie library. https://www.artofmanliness.com/articles/100-must-see-movies/. Accessed 2 Jan 2020
Mencarini L (2014) Gender equity. Springer, Dordrecht, pp. 2437–2438
Morlan K (2014) Comic-con vs. the bechdel test. https://web.archive.org/web/20150316161800/http://www.sdcitybeat.com/sandiego/article-13243-comic-con-vs-the-bechdel-test.html. Accessed 25 Jan 2019
MPAA (2018) Theme report 2017. https://www.mpaa.org/wp-content/uploads/2018/04/MPAA-THEME-Report-2017_Final.pdf. Accessed 5 Jan 2019
Nadeau D, Sekine S (2007) A survey of named entity recognition and classification. Lingvist Investig 30(1):3–26
O’Hare J (2017) Oscars 2017: half of the best picture nominees fail this test for gender equality. https://www.globalcitizen.org/en/content/oscars-best-picture-bechdel-test/. Accessed 23 Jan 2019
opensubtitles.org (2019) Subtitles—download movie and TV series subtitles. https://www.opensubtitles.org/en/statistics. Accessed 15 Dec 2018
Park S-B, Oh K-J, Jo G-S (2012) Social network analysis in a movie using character-net. Multimed Tools Appl 59(2):601–627
Polce-Lynch M, Myers BJ, Kliewer W, Kilmartin C (2001) Adolescent self-esteem and gender: exploring relations to sexual harassment, body image, media influence, and emotional expression. J Youth Adolesc 30(2):225–244
Ramakrishna A, Martínez VR, Malandrakis N, Singla K, Narayanan S (2017) Linguistic analysis of differences in portrayal of movie characters. In: Proceedings of the 55th annual meeting of the association for computational linguistics, vol 1: Long papers. pp. 1669–1678
Rose S (2018) One female director for every 22 men: Hollywood’s stark diversity problem | film | the guardian. https://www.theguardian.com/film/2018/jan/04/hollywood-diversity-sees-no-improvement-in-2017-report-finds. Accessed 16 Dec 2018
Rossman G, Esparza N, Bonacich P (2010) I’d like to thank the academy, team spillovers, and network centrality. Am Sociol Rev 75(1):31–51
Rothkopf J (2018) 100 best feminist movies you need to watch. https://www.timeout.com/newyork/movies/best-feminist-movies-of-all-time. Accessed 21 Jan 2020
Sap M, Prasettio MC, Holtzman A, Rashkin H, Choi Y (2017) Connotation frames of power and agency in modern films. In: Proceedings of the 2017 conference on empirical methods in natural language processing. pp. 2329–2334
Saramäki J, Kivelä M, Onnela J-P, Kaski K, Kertesz J (2007) Generalizations of the clustering coefficient to weighted complex networks. Phys Rev E 75(2):027105
Shift7 (2018) Female-led films outperform at box office for 2014–2017. https://shift7.com/media-research. Accessed 23 Jan 2019
Silverstone R (2003) Television and everyday life. Routledge
Smith SL, Choueiti M (2010) Gender disparity on screen and behind the camera in family films; the executive report
Smith S, Pieper K, Choueiti M (2017) Inclusion in the director’s chair? gender, race, & age of film directors across 1,000 films from 2007–2016. Media, Diversity, & Social Change Initiative
Stiffler L, Sampaco S (2018) Amazon x-ray lets viewers take a deeper dive into shows, as 2018’s most popular are revealed—geekwire. https://www.geekwire.com/2018/amazon-x-ray-lets-viewers-take-deeper-dive-shows-2018s-popular-revealed/. Accessed 28 Jan 2020
Tran QD, Jung JE (2015) Cocharnet: extracting social networks using character co-occurrence in movies. J Univ Comput Sci 21(6):796–815
UNIC (2017) Unic anual report 2018. https://www.unic-cinemas.org/fileadmin/user_upload/wordpress-uploads/2017/06/UNIC_AR2018_online.pdf. Accessed 5 Jan 2019
University SDS (2017) Women remain underrepresented in hollywood, study shows. https://phys.org/news/2017-09-women-underrepresented-hollywood.html. Accessed 7 Dec 2018
Wagner C, Garcia D, Jadidi M, Strohmaier M (2015), It’s a man’s wikipedia? Assessing gender inequality in an online encyclopedia. In: The International Conference on Web and Social Media. pp. 454–463
Waletzko A (2017) Why the Bechdel test fails feminism|huffpost. https://www.huffpost.com/entry/why-the-bechdel-test-fails-feminism_b_7139510. Accessed 2 Sept 2019
Walt H, Koeze E, Dottle R, Wezerek G (2017) Creating the next bechdel test | fivethirtyeight. https://projects.fivethirtyeight.com/next-bechdel/. Accessed 16 Jan 2019
Weng C-Y, Chu W-T, Wu J-L (2009) Rolenet: movie analysis from the perspective of social networks. IEEE Trans Multimed 11(2):256–271
Wilson JD, MacGillivray MS (1998) Self-perceived influences of family, friends, and media on adolescent clothing choice. Fam Consum Sci Res J 26(4):425–443
Wood JT (1994) Gendered media: the influence of media on views of gender. Gendered lives: communication, gender and culture. pp. 231–244
Worldbank T (2018) Unrealized potential: the high cost of gender inequality in earnings. https://www.worldbank.org/en/topic/gender/publication/unrealized-potential-the-high-cost-of-gender-inequality-in-earnings. Accessed 9 Dec 2018
Acknowledgements
We would like to thank Carol Teegarden for editing and proofreading this article to completion. Also, we thank Mandy Henner, Sergey Korotchenko, and Ariel Plotkin for their help.
Author information
Authors and Affiliations
Corresponding authors
Ethics declarations
Competing interests
The authors declare no competing interests.
Additional information
Publisher’s note Springer Nature remains neutral with regard to jurisdictional claims in published maps and institutional affiliations.
Supplementary information
Rights and permissions
Open Access This article is licensed under a Creative Commons Attribution 4.0 International License, which permits use, sharing, adaptation, distribution and reproduction in any medium or format, as long as you give appropriate credit to the original author(s) and the source, provide a link to the Creative Commons license, and indicate if changes were made. The images or other third party material in this article are included in the article’s Creative Commons license, unless indicated otherwise in a credit line to the material. If material is not included in the article’s Creative Commons license and your intended use is not permitted by statutory regulation or exceeds the permitted use, you will need to obtain permission directly from the copyright holder. To view a copy of this license, visit http://creativecommons.org/licenses/by/4.0/.
About this article

Cite this article
Kagan, D., Chesney, T. & Fire, M. Using data science to understand the film industry’s gender gap. Palgrave Commun 6, 92 (2020). https://doi.org/10.1057/s41599-020-0436-1
Received:
Accepted:
Published:
DOI: https://doi.org/10.1057/s41599-020-0436-1
