Abstract
Today the industry of meetings, incentives, conferences and exhibitions, commonly known under the name of MICE, contributes to economic diversification and actively stimulates the rational use of cultural-historical and natural recreational resources. As of 2019, the total contribution of the tourism sector to the GDP of the United Arab Emirates (UAE) equalled 11.5 per cent. More than 2.3 million visitors cited business as their main purpose of travel to Dubai in 2019, marking a two per cent increase compared to 2018. Thus, the UAE MICE industry was among the global leaders before the COVID-19 pandemic occurred. As a result of severe quarantine measures, the majority of destinations all over the world introduced COVID-19-related travel restrictions that were valid until May 2020. In the UAE, like in any other country, the coronavirus pandemic affected every industry, and especially the MICE one. Even though the consequences of COVID-19 have been multiply analysed by many UAE researchers, its global and local impact on the MICE industry, as well as the strategies for MICE companies’ survival, are described insufficiently. This study aimed to investigate the COVID-19 impact on both the global and the UAE MICE markets and identify a competitive survival strategy for tourism companies on the example of those operating in the UAE. The research revealed that under the conditions of harsh travel restrictions and closed borders, the UAE MICE industry is faced with a sharp reduction of demand. Emirati Airlines, hotels, and other tourism-related businesses have experienced significant material losses. In particular, the drop in scheduled departure flights comprised 82%. The multiplicative analysis performed in the course of the study identified the 5P marketing strategy and an outsourcing method as an optimal solution for MICE companies’ survival and recovery. The study results can be used by MICE businesses or researchers using specific company and market data for developing strategies aimed at overcoming COVID-related crisis and increasing the competitiveness of MICE companies in particular and the market as a whole.
Introduction
The development of MICE industry (meetings, incentives, conferences and events) contributes to economic diversification, stimulates the rational use of cultural and natural-recreational resources, and enables a balanced growth of the whole tourism sector (Manzoor et al., 2019; Astakhova, 2019). For the United Arab Emirates (UAE), the tourism sector is especially important as a driver of national gross domestic product (GDP). As stated by the Dubai Annual Visitor Report 2019, at the end of 2019, tourism was responsible for contributing an impressive 11.5 per cent in GDP value. Furthermore, according to the World Travel and Tourism Council’s Cities Report, Dubai’s tourism sector was ranked one of ‘Top 10’ strongest economic share generators (Dubai’s Department of Tourism and Commerce Market, 2020).
More than 2.3 million visitors cited business as their main purpose of travel to Dubai in 2019, marking a two per cent increase compared to 2018 (Dubai Department of Tourism and Commerce Market, 2020). According to the Dubai Annual Visitor Report, in 2019, Dubai held 301 meetings, conferences and incentives organised by Dubai Business Events, thereby bidding for 595 events in 2020. In the year 2019, Dubai World Trade Center (DWTC) welcomed its record 3.57 million delegates, which declared the visitation growth of up to four per cent from the previous year. Such an increase was driven by 349 MICE and business events, 97 of which were large scale with over 2000 attendees. Since 2019, international participation in DWTC events grew by 15 per cent (equivalent to 1.2 million visitors), underlining the strong benefits the world businesses see in coming to Dubai with the aim of sharing knowledge, networking and accelerating their development (Dubai Department of Tourism and Commerce Market, 2020). Last year, the business tourism events accounted for 3.3% of GDP, which amounts to USD 3.57 billion (Dubai World Trade Centre, 2019). The business tourism was a key element in stimulating the national economic growth and in the nearest future was supposed to reach intense development, making the UAE among the central players in the global MICE industry (Rogerson, 2017; Dubai Tourism, 2020). However, the introduced quarantine ruined these plans.
The COVID-19 pandemic has led to more than 4.3 million confirmed cases and more than 290.000 deaths worldwide. It raised fears of an impending economic crisis and recession. Social distancing, self-isolation, and travel restrictions have reduced the workforce in all sectors of the economy and have led to the loss of many jobs (Nicola et al., 2020; Tsindeliani, 2019).
Due to the lack of a vaccine and very limited treatment options, non-pharmaceutical interventions occurred to be the primary strategy to contain the pandemic. Unprecedented global travel restrictions and appeals to stay at home have caused the most critical disruptions of the global economy since World War II. Given the international travel bans that affect more than 90% of the global population and widespread restrictions on public gatherings and community mobility, tourism largely ceased in March 2020 (Gössling et al., 2020). Since the quarantine introduction, millions of jobs in the global tourism sector were lost due to flight, event and hotel cancellations (Siddiquei and Khan, 2020).
Given that international arrivals exceeded 1.5 billion for the first time only in 2019, the long-term evolution of tourism is proved to be greatly dependent on a decade of growth since the global financial crisis. Though, this last period of unhindered business tourism development has suddenly come to an end with the COVID-19 (Brouder, 2020).
Accompanied by quarantine in most countries and closed borders worldwide, COVID-19 pandemic heavily hit the MICE industry. The majority of domestic and international airlines were forced to cancel their flights due to severe quarantine measures and a lack of passengers, as people were frightened (Hoque et al., 2020).
The MICE industry was undermined by government efforts to contain and combat the pandemic. Borders were closed, trips banned, social and business events cancelled, and people were ordered to stay in their homes. By taking these actions, governments around the world sought to strike a balance between maintaining their economies and preventing dangerous levels of unemployment and deprivation. They tried to respond to public health imperatives to prevent the health systems’ collapse and mass deaths (Higgins-Desbiolles, 2020).
After months of unprecedented disruptions, the United Nations World Tourism Organization (UNWTO) reported that the tourist sector begins to revive in some areas, especially in the Northern Hemisphere. At the same time, travel restrictions remained valid for most global destinations, and business tourism continued to be among the most affected sector of all (World Tourism Organization, 2020a).
Although Dubai’s tourism sector announced reopening the city for international tourism on July 7, 2020, people worldwide were still afraid of travelling. Consequently, the numbers of international arrivals in Dubai were far from those before March 2020 (Dubai Tourism, 2020).
Today, as the COVID-19 pandemic continues and the second wave is forecasted by epidemiologists, political and business leaders are wondering if the recession in the markets and the economy truly signals a recession; how serious the COVID-19 recession will be; what will be the growth and recovery scenarios, and whether there will be any lasting structural impact from the unfolding crisis. However, all the forecasts and indices will not disclose the virus trajectory, the effectiveness of containment measures, and the reactions of consumers and companies. For now, there is no single figure that can reliably reflect or foresee COVID-19’s economic impact, especially on the MICE market dependent on international travel and public events (Carlsson-Szlezak et al., 2020). Even though the pandemic has been on the run for several months only, the global and market-related losses are huge. Nevertheless, now it is extremely difficult to assess them due to the lack of sufficient statistical data and unwillingness of some companies, industries and countries, especially the developing ones, to disclose the level of economic decline (Stock, 2020).
Despite the existence of numerous studies dedicated to COVID-19 and its estimated effect on economies and industries, poor attention was given to the global and local impact of coronavirus disease on the MICE industry and to strategies for MICE companies’ survival. The MICE industry of the UAE is chosen as a case study due to its leading position at the global MICE market before the pandemic-related crisis occurred.
The aim of the study is to investigate the global and local impact of COVID-19 on the MICE industry and identify a competitive survival strategy for MICE companies taking the UAE business sector as an example.
With the purpose of achieving the goals set, the following tasks were formulated:
-
Assess the effect of coronavirus pandemic on the global tourism market and MICE industry in the UAE;
-
Select indicators of economic efficiency to compute the profitability of MICE companies in the UAE;
-
Suggest a strategy for MICE business survival in the context of outsourcing in a globalised economy heavily influenced by COVID-19 (on the example of the UAE).
Literature review
Business trips and business tours are somewhat similar in terms of event tourism education (Holloway and Humphreys, 2019). The difference lies in the very essence of the event, but the mechanisms are generally the same. The fact that Abu Dhabi and Dubai are among the most important business centres of today increases the role of business tourism and its share in the country’s tour production (Zhamgaryan, 2017). Numerous conferences, business congresses, and diplomatic visits constitute the major drivers of business tourism (Sovet et al., 2016).
Literature on the use of tourism infrastructure and tourism management distinguishes the following principles that most countries rely upon:
-
1.
Tourism and product topologies, territoriality research.
-
2.
The presence of private and public travel companies and agencies.
-
3.
Resources and recreational opportunities, tourist flows and service offers.
-
4.
Independent choice of tourism agencies.
Communication with a client through outsourcing in business tourism creates an opportunity for world leaders in this industry to quickly grow and solve multiple problems, including the global ones caused by COVID-19 pandemic.
To survive, tourism agencies need to make efficient use of all reserves (Kuznetsov and Kizyan, 2017). Ensuring survival through competitiveness is a dynamic process aimed at long-term gain. The main goal of managing corporate competitiveness in the MICE industry is to create sustainable competitive advantages that can recover the position of MICE agencies and enable their financial performance in the post-pandemic environment (Nukusheva et al., 2020).
Existing studies on competitiveness in the tourism industry emphasise the importance of infrastructure and support services for environmental sustainability (Croes, 2010; Jovanović and Ilić, 2016; Kastenholz et al., 2012; Mihalicˇ, 2013; Reitsamer and Brunner‐Sperdin, 2017; Zehrer et al., 2016). Managing tourist behaviour also contributes to sector competitiveness (Reisinger et al., 2019). Previous researchers relied on a survey of tourism experts and key tourism stakeholders (Andrades and Dimanche, 2019). Some scholars made use of a mixed (quantitative-qualitative) method to measure competitiveness of a given industry in Iran (Boroomand et al., 2019). Others have developed their own industry competitiveness indices. For instance, some authors used data from the Travel and Tourism Competitiveness Index produced by the World Economic Forum in a global analysis of industry competitiveness (Gómez-Vega and Picazo-Tadeo, 2019; Nazmfar et al., 2019), while others addressed alternative sources of information (Gu et al., 2019; Lopes et al., 2018).
Using structural equation modelling to the impact of tourism industry recovery and growth on environmental sustainability proves the presence of environmental degradation (Pulido-Fernández et al., 2019). The results of PROMETHEE and GAIA analysis from the competitiveness study of Portuguese tourist destinations revealed local competitors with their strengths and weaknesses. Among effective indicators are a sound tourism infrastructure and the potential of tourism destinations to grow through the adoption of public policies or private initiatives (Lopes et al., 2018).
The competitiveness of the MICE industry is considered with regard to subjective assumptions about competitiveness and significance of single indicators for sustainable development (Safarova, 2015). For example, Porter developed a universal model of micro-level competition. Poon’s framework for tourism competitiveness is built on innovative processes, quality, and privatisation. The WES model is a macroeconomic framework that takes into account tourism policies. In Dwyer’s model, the price component is recognised as a major component. The Crouch-Ritchie model integrates a whole range of tourism competitiveness factors, systematising global forces that pose challenges and open opportunities for tourism (Mazurek, 2014). The comparative study of Slovenia and Serbia tourism sectors using a modified IPA matrix identified the areas for improvement and actions for closing the gap between importance and performance of the MICE industry (these relate to the creation and adoption of innovative products) (Dwyer et al., 2016).
Materials and methods
With the purpose of analysing the impact of COVID-19 on global and the UAE MICE market, quantitative and qualitative analysis methods were used to evaluate the following data (in relative and absolute values):
-
World GDP growth rates for 2019, 2020 and 2021;
-
UAE GDP growth rates for 2019, 2020 and 2021;
-
International tourist arrivals for 2019 and 2020 (globally and by country);
-
Global international tourist arrivals from 2000 to 2020;
-
Global international tourist receipts from 2000 to 2020;
-
Employment loss in the travel, tourism and aviation industries in 2020;
-
Losses in travel, tourism and aviation industries in 2020;
-
Scheduled departure flights in January–December 2019 and January–July 2020 (globally and by country).
The following sources were used to retrieve the above data:
-
Previous studies;
-
Reports of the World Bank;
-
Reports of the World Tourism Organization;
-
Reports of the World Travel and Tourism Council;
-
Reports of the OAG company;
-
Reports of Dubai Corporation of Tourism and Commerce Marketing;
-
Reports of Dubai Department of Tourism and Commerce Marketing;
-
Reports of Dubai World Trade Centre;
-
Statista Global Business Data Platform;
-
Official website of UAE-Consulting company;
-
Reports of the Oxford Analytica consulting firm.
The current analysis framework includes indicators that are interconnected to achieve a more accurate characterisation of the quality of decision-making. The DuPont System of Analysis is designed to compute the Return on Investment. This multiplicative model is frequently used by managers to assess the impact of quantity, price, and nomenclature on the revenue, as well as to analyse the structure of marginal profit, cost, and coefficient ratios (DuPont model, 2015). This study integrates the DuPont analysis model with the gross profit from the sale indicator to measure the profitability of MICE companies. The gross profit from the sale helps to assess the impact of the travel service cost on the company’s profitability, improving the overall result of economic analysis. The modified formula has the following form:
Where PMICE represents the MICE company’s profitability (in %);
NP represents the net profit from the sale, USD;
IS represents the income from the sale, USD;
GP represents the gross profit from the sale, USD;
NI represents the net income from the sale, USD.
The study applies a statistical method to collect data on the MICE industry competitiveness and behaviour of consumers (data to develop a forecast). With this method, managers can more efficiently make decisions on business recovery and competitiveness strategies. The dependence between the number of service offers and factors of the MICE industry is expressed via the production function model. This model is built around the number of people employed and the outsourcing strategy spending.
It should be noted that since no reliable data on the MICE industry recovery are available to date, some figures necessary for calculations were used from the pre-pandemic period. As soon as actual data are available, more accurate calculations can be made.
Results and discussion
COVID-19 impact on global and country tourism market
According to the United Nations World Tourism Organization (World Tourism Organization, 2020b), as of May 2020, 100% of destinations worldwide had travel restrictions associated with COVID-19. The pandemic has significantly impacted every sector of the travel and tourism industry: airlines, transportation, cruise lines, hotels, restaurants, attractions (such as national parks, protected areas and cultural heritage sites), travel agencies, tour operators and online travel organisations. Small and medium-sized enterprises and micro-firms, which include a large informal tourism sector, account for about 80 per cent of the tourism sector, and many of them may not survive the crisis without substantial support. This will lead to a domino effect in the entire tourism supply chain, affecting livelihoods in agriculture, fisheries, creative industries and other services. The loss of jobs in the MICE industry has a disproportionate effect on women, youth and the indigenous population. Women-owned and operated MICE companies are often smaller in size and have fewer financial resources to counter the crisis. Women hold such frontline positions in the tourism industry as housekeeping and front desk staff, which puts a particular risk to their health (Twining Ward and McComb, 2020).
According to the World Bank, the world GDP is expected to decline by 5.21% in 2020 (the decrease in 2019 comprised 2.38%) and grow by 4.16% in 2021. The dynamics of GDP of the United Arab Emirates will comprise −4.5% (compared to 1.7% growth in 2019), followed by the estimated increase by 1.4% in 2021 (World Bank, 2020).
In 2019, the direct, indirect and induced impact of travel and tourism industry accounted for 10.3% of the global GDP (USD 8.9 trillion) and 330 million jobs, or 1 in 10 jobs globally. As a result of the COVID-19 pandemic, in 2020, the global travel and tourism market is predicted to see a loss of 121 million jobs worldwide and USD 3,435 billion in global GDP (World Travel and Tourism Council, 2020).
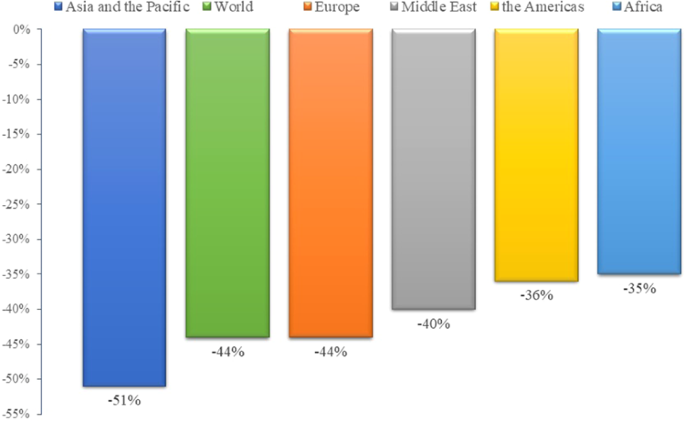
According to the data of the World Tourism Organization (2020a), the United Nations agency taking charge of the promotion of responsible, sustainable and universally accessible tourism, as of June 22, 2020, the global fall in international tourist arrivals comprised 44% compared to 2019 (Fig. 1).
Source: developed by the authors based on data adapted from the World Tourism Organization (2020a).
As shown in Fig. 1, the most significant decrease in terms of international arrivals in January–April of 2020 experienced the Asia and the Pacific region (51%) followed by Europe (44%) and the Middle East (40%). The decline in international arrivals in the Americas and Africa equalled 36 and 35%, respectively (UNWTO, June 22, 2020).
In early May 2020, the UNWTO has outlined three possible scenarios for the MICE industry which indicate a potential decrease in the total number of international tourists from 58 to 78%, depending on when travel restrictions are lifted. Since mid-May, UNWTO has identified an increase in the number of destinations announcing measures to resume tourism. These include the introduction of enhanced safety and hygiene measures and policies aimed at developing domestic tourism (World Tourism Organization, 2020b).
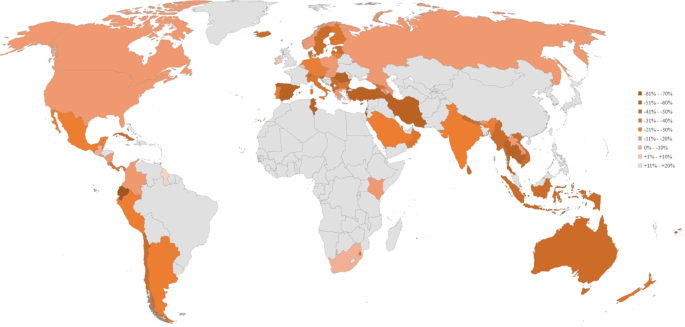
Geographically, the regions with the biggest relative drop in international tourist arrivals during January–April 2020 are Europe, Australia and New Zealand, and Western, Southern and Southeastern Asia (Fig. 2)Footnote 1.
Source: developed by the authors based on data adapted from the World Tourism Organization (2020c).
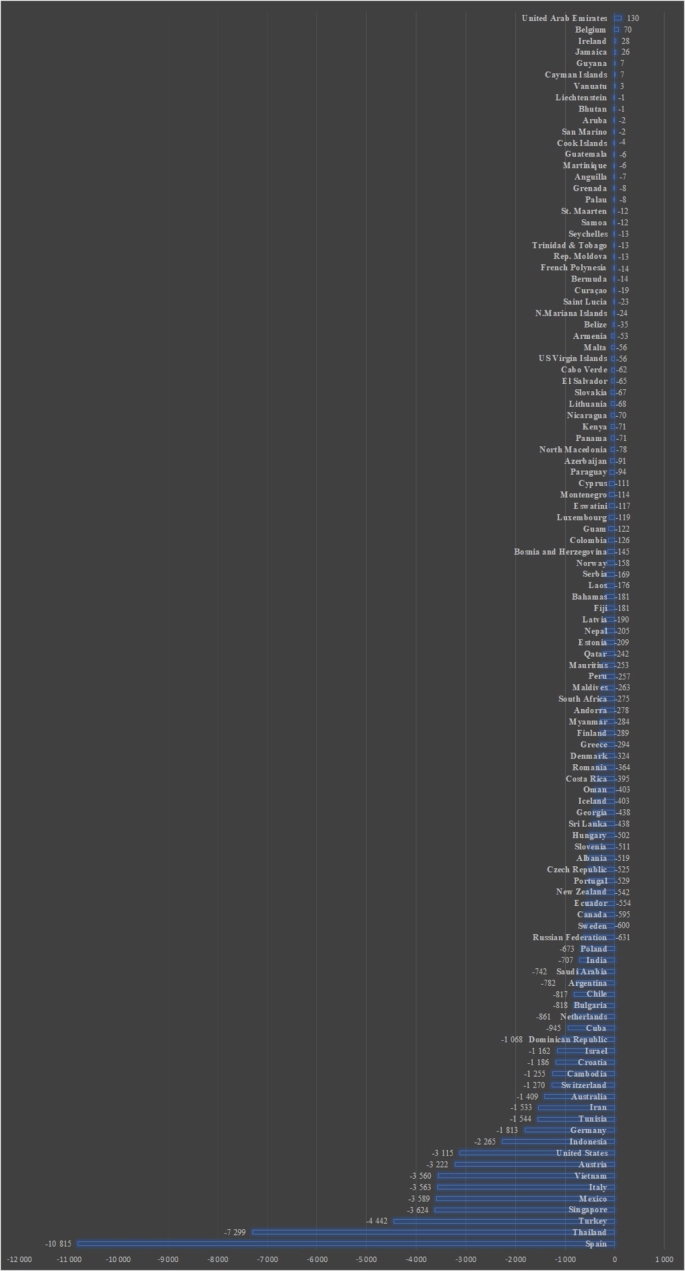
According to Fig. 3, the largest absolute decrease in international tourist arrivals experienced Spain (10.8 million), followed by Thailand (7.3), Turkey (4.4), Singapore, Mexico, Italy, Vietnam (3.6 million each), Austria (3.2) and the United States (3.1)Footnote 2Footnote 3.
Source: developed by the authors based on data adapted from the World Tourism Organization (2020c).
Despite several countries have positive values of international tourist arrivals (the United Arab Emirates, Belgium, Ireland, Jamaica, Guyana, Cayman Islands and Vanuatu), the data available in UNWTO report for them is for February 2020, when COVID-19-related travelling restrictions were not so severe. The same goes to a number of other countries with low decrease results (Aruba, Bhutan and Martinique).
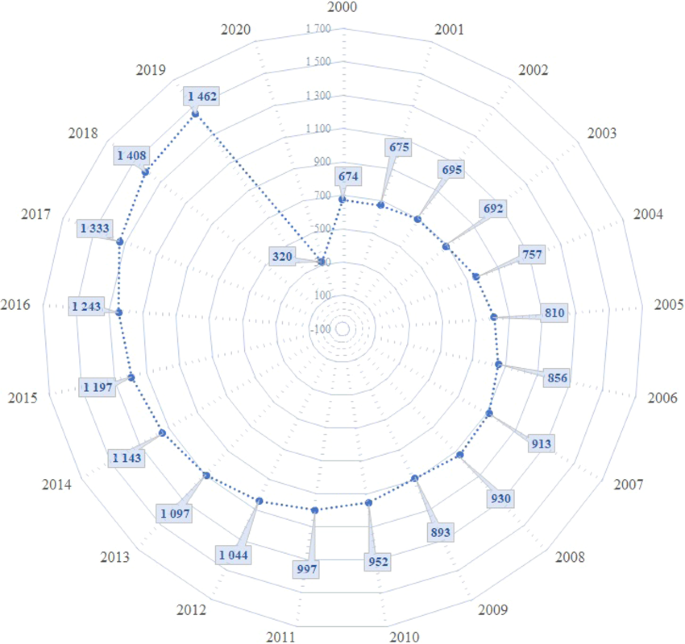
The international tourist arrivals worldwide showed stable growth in 2000–2019, except for some crisis years with a slight drop: 2003 (SARS pandemic, 3 million) and 2009 (global economic crisis, 37 million). According to the worst-case scenario of the UNWTO, the decrease in 2020 can reach 1.140 billion (Fig. 4).
Source: developed by the authors based on data adapted from the World Tourism Organization (2020b).
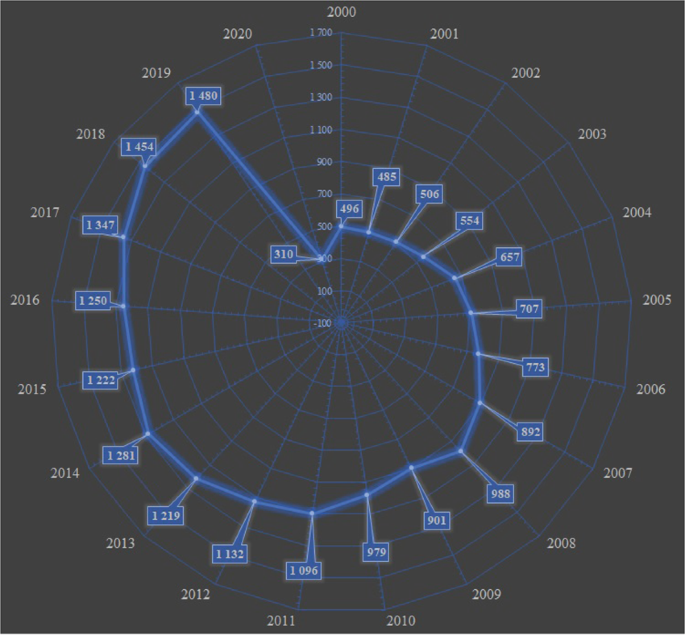
The global international tourism receipts also experienced constant growth in 2000–2019, with the exception of one year, 2009, when the drop was USD 88 billion (Fig. 5). In 2020 the decrease may reach USD 1.170 trillion as per the worst UNWTO scenario.
Source: developed by the authors based on data adapted from the World Tourism Organization (2020b).
According to preliminary data, in the first quarter of 2020, the impact of aviation losses can reduce global GDP from 0.02 to 0.12%. Besides, if events develop according to the worst-case scenario, before the end of 2020, these aviation losses can be as high as 1.41–1.67%, with job losses about 25–30 million (Iacus et al., 2020).
Now, the UAE is at the forefront in terms of reducing demand for MICE services, as well as for global air travel. Emirati Airlines, hotels, and other travel and tourism-related businesses have experienced significant oversupply and must take decisive actions (Oxford Analytica, 2020). The Etihad Airways based in Abu Dhabi and Emirates Airline in Dubai have asked their employees to stay at home due to reduced number of flights thereby not excluding the possibility of layoffs (Siddiquei and Khan, 2020).
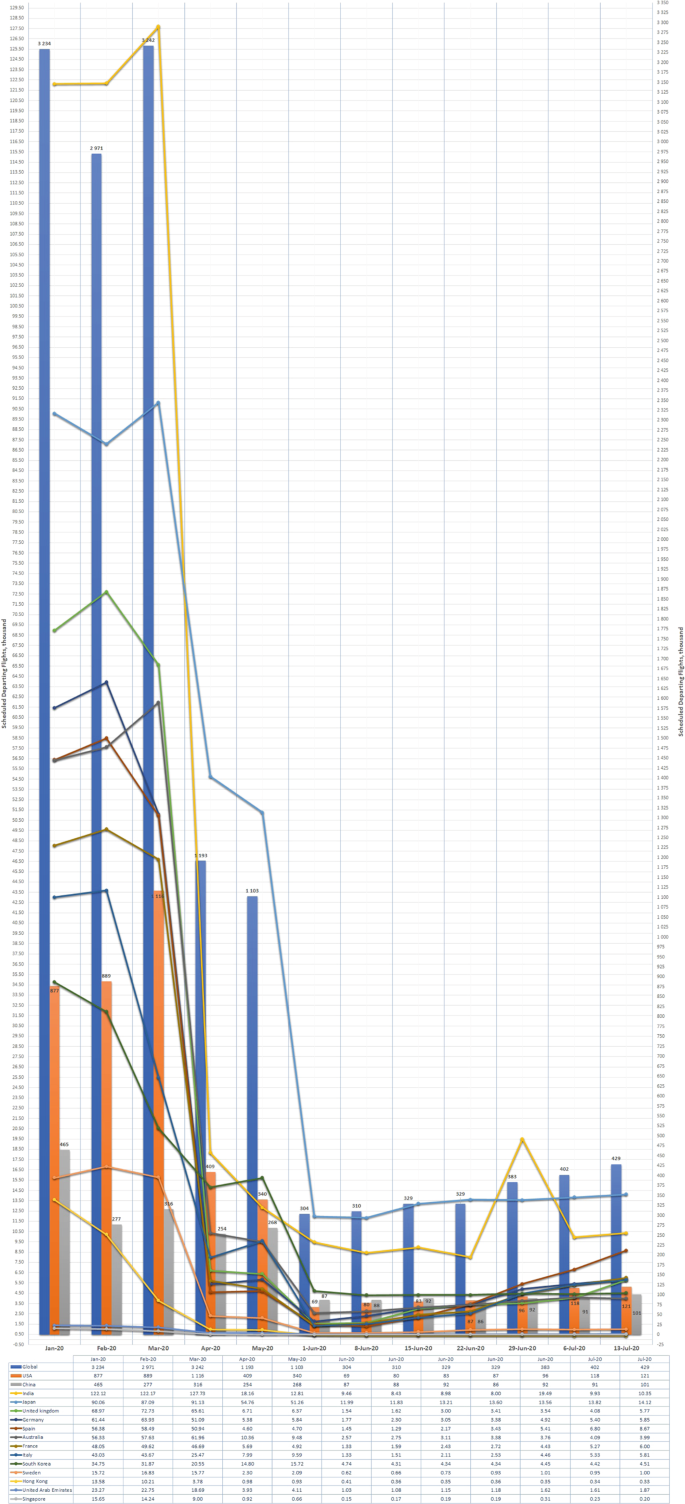
The global reduction of the scheduled departure flights comprised 2.8 million—from 3.234 million in January 2020 to 0.429 million on July 13, 2020. The anti-leaders in terms of the scheduled departure flights occurred to be the USA (−756 thousand flights), China (−363) and India (−112). For the same period, the UAE experienced a drop in 21 thousand flights, which is a comparatively small amount (Fig. 6).
Source: developed by the authors based on data adapted from OAG (2020).
As shown in Fig. 6, starting from June, the situation with flights has begun to improve slightly. As to the UAE, the number of scheduled departure flights grew from 1.03 to 1.87 thousand weekly from June 1, 2020, to July 13, 2020.
In relative numbers, the deepest global fall of scheduled departure flights (compared to the same period of 2019) occurred in May 2020 and was 69% (Table 1). The countries with the biggest relative decrease were Singapore (97%, May), Spain (94%, April), Hong Kong (94%, April), Germany (93%, April), the United Kingdom (94%, June) and France (92%, May). The UAE had the most notable drop of 82% on June 1, 2020.
Today, more than 50 business events are scheduled for the fall of 2020 in Dubai, but they depend on the global and local epidemiological situation (Dubai Tourism, 2020).
Key performance indicators of the MICE industry
The computational results based on pre-pandemic data show that the long-term profitability of the MICE industry can be potentially stable and not influenced by investments in post-pandemic conditions. The rate of return on investment will decrease with a new tourism service. Competitiveness, however, has little relation to profitability ratio and hence is likely to increase.
The present findings are expected to facilitate marketing decision making. However, managers should decide on a strategy for competitiveness that will enable the reduction of MICE services cost, the increase of competitive services, and personnel training. An integrated multiplicative model of profitability that allows the assessment of the given strategy has the following form:
Where, N—cost of services provided, USD;
S—number of those employed in the MICE industry;
P—profit spent on outsourcing strategy development, USD;
i—number of new services.
The results prove the theoretical significance of the selected model (Fisher criterion is equal to 29.01; the coefficient of multiple determination amounts to 0.97; and the relative approximation error is 0.14). The correspondence between results is expressed using the criteria of truth and authenticity.
The elasticity of service provision corresponds to t1 = 0.287 and t2 = 0.128, assuming low efficiency. That is, with a per cent increase of profits or employees, the number of offers for MICE services can potentially grow either by 0.287 or by 0.128%, respectively. Consequently, personnel costs and working capital may have little impact on the competitiveness of the MICE industry in the UAE in post-pandemic conditions. These data were processed to develop three theoretical forecast scenarios for the sales of MICE services in post-pandemic conditions (Table 2).
The above forecasts based on pre-pandemic data suggest that MICE service sales can increase by 61.6% in 2020–2023. That is, the average annual number is predicted to increase by 25%, gaining USD 35 thousand in 2021. Hence, the economic growth model can serve as an effective tool for improving the tourism development strategy of travel agencies.
The calculations confirm that in pre-pandemic conditions (average tax about 39%; the minimum return 6.9%) when tourism companies used to spend 89% of their net earnings, the volume of tourism services could not be maintained and the gross value added was likely to drop by 3%. Therefore, to ensure better performance and a broader range of tourism services, the minimum rate of return in ideal conditions should be at least 12.9% and the grow value-added tax should not exceed 38.9%.
Strategy for MICE survival and competitiveness
A queuing model was proposed to optimise MICE companies in terms of performance in the post-pandemic market. The Kotler’s extended marketing mix model may serve as a framework of choice for hoteliers, providing a competitive advantage over the existing participants in the MICE market. This model allows evaluating MICE services from various segments of the market by the in-depth profitability and demand analyses.
The five Ps of the marketing mix model are:
-
1.
Product—a hotel in which a business tourist stays and rests, where a business event is organised, etc.;
-
2.
Price—pricing policy, discount, price-quality (varies depending on hotels and airlines, plus insurance, travel and event organisation), etc.;
-
3.
Place—distribution channels, internet platforms, etc.;
-
4.
Promotion—meetings, incentives, conventions, exhibitions (product launch), state summits, public relations and advertising, etc.;
-
5.
People—loyal customers and VIP customers, staff, other customers, etc.
It can be argued that meetings and events in hotels that adhere to this marketing model will bring additional income to stakeholders and corporate business travel agencies and hence improve the image of MICE companies. The consequences of this 5P marketing mix model can also be the improvement of the tourism service quality.
Normally, large hotel corporations associate themselves with the image, rather than location. Therefore, when choosing strategies for gaining competitive advantage through outsourcing, the economic and marketing models were used. The underlying sustainable competitive advantages of MICE companies are innovation; service quality control; flexible, adaptive and strong organisational culture; intangible assets (image and business reputation); and consumer behaviour management. Hence, the competitiveness strategy should more focus on these variables. In cross-border tourism, the most promising strategies for competitiveness are those aimed at ensuring consumer loyalty, innovation and adaptation to the external environment like heightened health and safety measures. The MICE industry leaders are increasingly focused on current trends in outsourcing business processes, namely: expanding the boundaries of outsourcing; use of best practices, tools and technologies to ensure better management; the ability to integrate new features with existing systems; ensuring information confidentiality; the transition from individual services to service packages; and global coverage of existing and new markets.
Where there is the opportunity to survive in the pandemic and post-pandemic world and gain competitive advantages by reducing costs while increasing the efficiency of performance, business travel companies turn to outsourcing (It Pulse, 2019). Key Account Managers settle issues with the business travel organisation on the key client’s behalf (Suvorova, 2012). The main factors of competitiveness are the image and reliability of MICE companies. Competitiveness is achieved by improving the quality of services (Tymchyshyn-Chemerys and Pasternak, 2017). The previous studies highlighted the following important variables: total cost of business events; expenditures on restaurants and hotels, transportation, etc.; additional costs associated with increased demand; and value-added income.
The scientific novelty of this study is that it offers an optimal competitiveness strategy for the MICE industry offering to introduce outsourcing practices and the 5P marketing model.
Conclusions
The present research examined the impact of COVID-19 on global and UAE MICE market by way of quantitative and qualitative analysis. The study revealed that in the conditions of severe travel restrictions and closed borders, travel-dependant industries like MICE or passenger air services were significantly hit by the pandemic. In 2020, the COVID-19 quarantine measures are predicted to result in a global loss of 121 million jobs and USD 3,435 billion in GDP.
Now the UAE is at the forefront in terms of reducing demand for MICE services, as well as for global air travel. Emirati Airlines, hotels, and other travel and tourism-related businesses have experienced significant oversupply. Compared to the same period of 2019, the most considerable fall of scheduled departure flights in the UAE occurred on June 1, 2020, and equalled 82%. Despite the fact that the industry has started to recover after weakening anti-epidemic measures, this process can take some time (provided severe anti-pandemic measures will not be restored along with the new wave of COVID-2019).
The choice of survival and competitive strategy for the MICE industry is justified by the study of outsourcing business processes. Outsourcing enables the reduction of operating costs. In these circumstances, a MICE company needs to ‘keep the good work’ by employing competence, establishing a modern communication system, and promoting digitalisation.
The study used multiplicative analysis to evaluate the profitability of the MICE industry and the impact of operating costs on the competitiveness of MICE companies. The 5P marketing model was identified as an optimal choice for surviving and recovering MICE business companies through outsourcing. Since the major resource of organisations under consideration is people and the product, it is advisable to use the competitive marketing strategy when developing a management approach. However, because the product in the MICE industry is a result of multi-stage cooperation, the MICE service provider should simultaneously focus on the external environment.
The study findings can be used by travel agencies, MICE-related companies, or researchers, applying specific company and market data for developing strategies to overcome COVID-related crisis and increase the competitiveness of MICE business.
Due to the lack of reliable post-pandemic data, this research was limited to pre-pandemic information. As soon as actual data are available, more accurate calculations can be made, and theoretical research can be verified. Thus, there are enough opportunities for further research aimed at introducing the results obtained to certain post-pandemic MICE market conditions.
Data availability
Data used are available on request.
Notes
The aforementioned geographic regions correspond to the Standard Country or Area Codes for Statistics Use (1999) of the United Nations (M49 standard).
The darker the colour in Fig. 1 is, the deeper is the decrease in international tourist arrivals.
There is no data on international arrivals for the markets of countries in grey in Fig. 1.
References
Andrades L, Dimanche F (2019) Destination competitiveness in Russia: tourism professionals’ skills and competences. Int J Contemp Hospit Manag 31(2):910–930. https://doi.org/10.1108/IJCHM-11-2017-0769
Astakhova LV (2019) The concept of student cognitive culture: definition and conditions for development. Educ Sci J 21(10):89–115. https://doi.org/10.17853/1994-5639-2019-10-89-115. (In Russian)
Boroomand B, Kazemi A, Ranjbarian B (2019) Designing a model for competitiveness measurement of selected tourism destinations of Iran (the model and rankings). J Quality Assurance Hospit Tourism 20(4):491–506. https://doi.org/10.1080/1528008X.2018.1563015
Brouder P (2020) Reset redux: possible evolutionary pathways towards the transformation of tourism in a COVID-19 world. Tourism Geograph 1–7. https://doi.org/10.1080/14616688.2020.1760928
Carlsson-Szlezak P, Reeves M, Swartz P (2020) What coronavirus could mean for the global economy. Harvard Business Rev 3: 1–10
Croes R (2010) Measuring and explaining competitiveness in the context of small island destinations J Travel Res 50(4):431–442. https://doi.org/10.1177/2F0047287510368139
Dubai Department of Tourism and Commerce Market (2020) Dubai Annual Visitor Report 2019. July, 2020. https://dubaitourism.getbynder.com/m/3e56c8625ed93ce0/original/DTCM-ANNUAL-REPORT-2019-EN.pdf. Last assessed: 17/07/2020
Dubai Tourism (2020) Dubai Corporation of Tourism and Commerce Marketing. http://www.visitdubai.com/en-us/department-of-tourism_new/about-dtcm/tourism-vision-2020
Dubai World Trade Centre (2019) DWTC drives record AED 13.1bn in net economic value and 3.3% impact to city’s GDP in 2018. Press Release. https://www.dwtc.com/en/press/dwtc-events-fuel-dubais-economy-2019
DuPont Model (2015) Calculation formula. 3 Modifications. Finance for Dummies (March 18, 2015). Date of treatment May 24, 2016
Dwyer L, Armenski T, Cvelbar LK, Dragićević V, Mihalic T (2016) Modified Importance–performance analysis for evaluating tourism businesses strategies: comparison of Slovenia and Serbia. Int J Tourism Res 18(4):327–340. https://doi.org/10.1002/jtr.2052
Gómez-Vega M, Picazo-Tadeo AJ (2019) Ranking world tourist destinations with a composite indicator of competitiveness: to weigh or not to weigh? Tourism Manag 72:281–291. https://doi.org/10.1016/j.tourman.2018.11.006
Gössling S, Scott D, Hall CM (2020) Pandemics, tourism and global change: a rapid assessment of COVID-19. J Sustain Tourism. 1–20. https://doi.org/10.1080/09669582.2020.1758708
Gu T, Ren P, Jin M, Wang H (2019) Tourism destination competitiveness evaluation in Sichuan province using TOPSIS model based on information entropy weights. Discrete Continuous Dynam Syst-S 12(4–5):771–782. https://doi.org/10.3934/dcdss.2019051
Higgins-Desbiolles F (2020) Socialising tourism for social and ecological justice after COVID-19. Tourism Geograph 1–14. https://doi.org/10.1080/14616688.2020.1757748
Holloway JC, Humphreys C (2019) The business of tourism. SAGE Publications Limited
Hoque A, Shikha FA, Hasanat MW, Arif I, Hamid ABA (2020) The effect of Coronavirus (COVID-19) in the tourism industry in China. Asian J Multidiscipl Stud 3(1):52–58
Iacus SM, Natale F, Santamaria C, Spyratos S, Vespe M (2020) Estimating and projecting air passenger traffic during the COVID-19 coronavirus outbreak and its socio-economic impact. Safety Sci 104791. https://doi.org/10.1016/j.ssci.2020.104791
It Pulse (2019) What is outsourcing and what is it useful for business http://it-pulse.com.ua/chto-takoe-autsorsing-i-chem-on-polezen-dlya-biznesa.html
Jovanović S, Ilić I (2016) Infrastructure as important determinant of tourism development in the countries of Southeast Europe. Ecoforum 5(1):288–294
Kastenholz E, Eusebio C, Figueiredo E, Lima J (2012) Accessibility as competitive advantage of a tourism destination: the case of Lousã. In K Hyde, Ryan C, Woodside A (eds) Field guide to case study research in tourism, hospitality and leisure (Advances in Culture, Tourism and Hospitality Research) (Vol. 6) Emerald Publishing Ltd, pp. 369–385
Kuznetsov YuV, Kizyan NG (2017) Features of the choice of competitiveness strategy at the enterprises of the tourism industry. Manag Consult 9(105):74–81. https://doi.org/10.22394/1726-1139-2017-9-74-81
Lopes APF, Muñoz MM, Alarcón-Urbistondo P (2018) Regional tourism competitiveness using the PROMETHEE approach. Ann Tourism Res 73:1–13. https://doi.org/10.1016/j.annals.2018.07.003
Manzoor F, Wei L, Asif M (2019) The contribution of sustainable tourism to economic growth and employment in Pakistan. Int J Environ Res Public Health 16(19):3785. https://doi.org/10.3390/ijerph16193785
Mazurek M (2014) Competitiveness in tourism–models of tourism competitiveness and their applicability. Eur J Tourism Hospital Recreat 1:73–94
Mihalicˇ T (2013) Performance of environmental resources of a tourist destination: concept and application. J Travel Res 52(5):614–630. https://doi.org/10.1177/0047287513478505
Nazmfar H, Eshghei A, Alavi S, Pourmoradian S (2019) Analysis of travel and tourism competitiveness index in middle-east countries. Asia Pacific J Tourism Res 24(6):501–513. https://doi.org/10.1080/10941665.2019.1590428
Nicola M, Alsafi Z, Sohrabi C, Kerwan A, Al-Jabir A, Iosifidis C, Agha M, Agha R (2020) The socio-economic implications of the coronavirus pandemic (COVID-19): a review. Int J Surgery 78:185. https://doi.org/10.1016/j.ijsu.2020.04.018
Nukusheva A, Ilyassova G, Kudryavtseva L, Shayakhmetova Z, Jantassova A, Popova L (2020) Transnational corporations in private international law: do Kazakhstan and Russia have the potential to take the lead? Entrepre Sustain Issues 8(1):496–512
OAG. Flight Database & Statistics, Aviation Analytics (2020). Available at: www.oag.com. Last accessed: 16/07/2020
Oxford Analytica (2020) COVID-19 and oil shocks raise Gulf recession risks. Emerald Expert Briefings, (oxan-db)
Pulido-Fernández JI, Cárdenas-García PJ, Espinosa-Pulido JA (2019) Does environmental sustainability contribute to tourism growth? An analysis at the country level. J Cleaner Product 213:309–319. https://doi.org/10.1016/j.jclepro.2018.12.151
Reisinger Y, Michael N, Hayes JP (2019) Destination competitiveness from a tourist perspective: a case of the United Arab Emirates. Int J Tourism Res 21(2):259–279. https://doi.org/10.1002/jtr.2259
Reitsamer B, Brunner‐Sperdin A (2017) Tourist destination perception and well‐being. J Vacation Market 23(1):55–72. https://doi.org/10.1177/1356766715615914
Rogerson CM (2017) Tourism–a new economic driver for South Africa. In: Lemon A, Rogerson CM (eds) Geography and economy in South Africa and its neighbours. Routledge, pp. 95–110
Sable K, Roy A, Deshmukh R (2019) MICE Industry by Event Type (Meeting, Incentives, Conventions, and Exhibitions): Global Opportunity Analysis and Industry Forecast, 2018-2025. MICE Industry Outlook–2025. Allied Market Research. https://www.alliedmarketresearch.com/MICE-industry-market
Safarova NN (2015) Analysis of national competitiveness of tourism and travel: conclusions for the CIS countries. Econ Analy 30(429):53–64
Siddiquei MI, Khan W (2020) Economic implications of coronavirus. J Public Affairs https://doi.org/10.1002/pa.2169
Sovet K, Salima S, Altynay M (2016) Trends in the development of business tourism in the Republic of Kazakhstan. Probl Modern Sci Educ 40(82):1–9
Standard Country or Area Codes for Statistics Use (1999). The United Nations. Series: M, No. 49/Rev.4 (M49 standard). Online version. https://unstats.un.org/unsd/methodology/m49/
Statista (2020) Global № 1 Business Data Platform. https://www.statista.com/statistics/734587/uae-domestic-expenditure-as-contribution-to-gdp/
Stock JH (2020) Reopening the Coronavirus-Closed Economy (Vol. 60). Technical Report. Hutchins Center Working Paper
Suvorova IN (2012) Corporate business tourism outsourcing. Russian Entrepre 12(210):161–166
Tsindeliani I (2019) Public financial law in digital economy. Informatologia 52(3–4):185–193
Twining Ward L, McComb JF (2020) COVID-19 and Tourism in South Asia: opportunities for sustainable regional outcomes. World Bank, Washington, DC
Tymchyshyn-Chemerys JV, Pasternak OI (2017) Directly, the competitiveness of the tourism industry in Ukraine. Int Sci J Int Sci 7:165–171
World Bank (2020) Global Economic Prospects, June 2020. Washington, DC. https://openknowledge.worldbank.org/handle/10986/33748. Last assessed: 10/07/2020
World Tourism Organization (2020a) New Data Shows Impact of COVID-19 on Tourism as UNWTO Calls for Responsible Restart of the Sector, June 22, 2020. https://www.unwto.org/news/new-data-shows-impact-of-covid-19-on-tourism. Last assessed: 10/07/2020
World Tourism Organization (2020b) UNWTO World Tourism Barometer May 2020. Special focus on the Impact of COVID-19 (Summary). Retrieved from: https://webunwto.s3.eu-west-1.amazonaws.com/s3fs-public/2020-05/Barometer%20-%20May%202020%20-%20Short.pdf. Last assessed: 17/07/2020
World Tourism Organization (2020c) International Tourism and covid-19 UNWTO online resource. Retrieved from: https://www.unwto.org/international-tourism-and-covid-19. Last assessed: 15/07/2020
World Travel and Tourism Council (2020) Guidelines for WTTC’s Safe and Seamless Traveler Journey - Testing, Tracing and Health Certificates, June 2020. https://www.prevuemeetings.com/coronavirus/wttc-travel-guidelines/. Last assessed: 15/07/2020
Zehrer A, Smeral E, Hallmann K (2016) Destination competitiveness: a comparison of subjective and objective indicators for winter sports areas J Travel Res 56(1):55–66. https://doi.org/10.1177/2F0047287515625129
Zhamgaryan GA (2017) History of Tourism Development in the Arabian Countries on the Example of Jordan and the UAE. St. Petersburg
Acknowledgements
I would like to thank reviewers for their valuable comments on this article.
Author information
Authors and Affiliations
Corresponding author
Ethics declarations
Competing interests
The author declares no competing interests.
Additional information
Publisher’s note Springer Nature remains neutral with regard to jurisdictional claims in published maps and institutional affiliations.
Rights and permissions
Open Access This article is licensed under a Creative Commons Attribution 4.0 International License, which permits use, sharing, adaptation, distribution and reproduction in any medium or format, as long as you give appropriate credit to the original author(s) and the source, provide a link to the Creative Commons license, and indicate if changes were made. The images or other third party material in this article are included in the article’s Creative Commons license, unless indicated otherwise in a credit line to the material. If material is not included in the article’s Creative Commons license and your intended use is not permitted by statutory regulation or exceeds the permitted use, you will need to obtain permission directly from the copyright holder. To view a copy of this license, visit http://creativecommons.org/licenses/by/4.0/.
About this article
Cite this article
Aburumman, A.A. COVID-19 impact and survival strategy in business tourism market: the example of the UAE MICE industry. Humanit Soc Sci Commun 7, 141 (2020). https://doi.org/10.1057/s41599-020-00630-8
Received:
Accepted:
Published:
DOI: https://doi.org/10.1057/s41599-020-00630-8

