Abstract
The Agenda 2030 with its 17 Sustainable Development Goals (SDGs) provides the framework that all United Nations (UN) member states have pledged to fulfill. The achievement of this agenda crucially depends on whether humankind will be able to maximize synergies and resolve existing trade-offs between the SDGs. We provide the first analysis of future interactions for projected SDG trends until 2030 within and between goals, and we analyze how trade-offs and synergies have evolved in the recent past globally. For certain goals, we find positive developments with notable synergies in our projections, especially for SDGs 1, 3, 7, 8, and 9: Poverty alleviation and strengthening the economy, rooted in innovation, and modern infrastructure, therefore continue to be the basis upon which many of the other SDGs can be achieved. However, especially SDGs 11, 13, 14, 16, and 17 will continue to have notable trade-offs, as well as non-associations with the other goals in the future, which emphasizes the need to foster innovations and policies that can make our cities and communities more sustainable, as well as strengthen institutions and spur climate action. We show examples of a successful transformation of trade-offs into synergies that should be emulated in other areas to create a virtuous cycle of SDG progress. The alarming inability to overcome certain persistent trade-offs we have found, and indeed the deterioration for some SDGs, can seriously threaten the achievement of the Agenda 2030.
Introduction
The Agenda 2030 with its 17 Sustainable Development Goals (SDGs) provides the framework that all 193 United Nations (UN) member states have pledged to achieve (United Nations, 2015). Unlike previous development agendas that put an emphasis on economic growth, the SDGs are a universal framework that contains many potentially diverging policy goals in the economic, social, and environmental sphere, while some goals are thought to be mutually supportive. The achievement of the agenda crucially depends on whether we will be able to maximize such synergies and resolve the existing trade-offs.
To shed light onto this important topic, research is beginning to examine the interlinkages between the 17 goals (Lu et al., 2015; Schmidt et al., 2015; Pradhan, 2019; Breuer et al., 2019). Previous studies prior to the SDGs had already looked at interlinkages, for instance, between climate change adaptation and mitigation response (Smith and Olesen, 2010); poverty alleviation (Mathy and Blanchard, 2016); meeting the Millennium Development Goals (MDGs) (Bue and Klasen, 2013); and balancing economic development, environmental sustainability, and social inclusion for human well-being (Ibisch et al., 2016; Sachs, 2012). With the SDGs, however, a new level of opportunities for classifying interactions has emerged so that these issues can be examined more systematically in the future (Costanza et al., 2016; Rickels et al., 2016; Nilsson et al., 2016). The first complete quantification of synergies and trade-offs within and across the SDGs was provided by Pradhan et al. (2017). It was found that SDG 1 (No poverty) has synergetic relationship with many goals, while SDG 12 (Responsible consumption and production) is associated with trade-offs, especially regarding economic progress. A similar pattern was found in a more recent study by Lusseau and Mancini (2019) who reported that “limiting climate change, reducing inequalities and responsible consumption are key hurdles to achieving 2030 goals across countries [while] […] poverty alleviation and reducing inequalities will have compound positive effects on all SDGs”. Modeling three alternative policy pathways (technology, lifestyle change, and decentralized governance) for achieving SDG targets, these alternative development paths lead to synergies that enhance target achievement, while others lead to trade-offs (Moyer and Bohl, 2019). Additional studies have highlighted selected aspects of SDG interactions, such as between energy (SDG 7) and other SDGs (Nerini et al., 2018), or between selected social and environmental goals (Scherer et al., 2018), or with a case study to facilitate the prioritization of SDG targets for 22 countries in the Arab region (Allen et al., 2019), or at the local level in Sweden for selected SDG interactions (Engström et al., 2019), or relating urban scaling with SDG 11 (Sustainable cities and communities) indicators (Akuraju et al., 2020).
Although such studies of a snapshot in time on interactions are helpful to assess the current state of the challenge, in the end the world community’s ability to achieve Agenda 2030 will crucially depend on whether over time trade-offs across the entire spectrum of the SDGs can be minimized and synergies can be maximized. Therefore, this study examines whether countries are currently good enough at dealing with these interlinkages based on extrapolated developments in the recent past in relation to the level needed for SDG achievement by 2030: How have interactions within and between the 17 SDGs across countries evolved over time? Are we successful in moving from trade-offs to synergies at the rate that is necessary to achieve the goals? We analyze how trade-offs and synergies between the goals have developed between 2010 and 2018. Most importantly, we provide the first analysis of future interactions for projected SDG trends until 2030. The most significant added value to the literature of our study is therefore that it fills a gap by being the first analysis to use SDG trends to calculate projected SDG interactions in the future. Given the increased focus in recent years on the need for synergies between economic, social, and environmental progress (in addition to the studies mentioned earlier in this section, see e.g. Stiglitz et al., 2009, 2018), we hypothesize that synergies between these three spheres of progress will occupy a larger portion in our projections of the interlinkages until 2030 than trade-offs. Table 1 lists all SDGs and their full titles.
Data and method
Data
The SDG Index and Dashboards database provides globally available data at country level on SDG indicators from 2010 to 2018 (Sachs et al., 2018). This is the first study on SDG interactions using the SDG Index and Dashboards report data which has been described as “the most comprehensive picture of national progress on the SDGs and offers a useful synthesis of what has been achieved so far” (Nature Sustainability Editorial, 2018). The database contains data for 193 countries with up to 111 indicators per country on all 17 SDGs (as of 14 May 2019; detailed information, including the full list of indicators and the raw data used here are available from www.sdgindex.org; see also Schmidt-Traub et al., 2017 for the methodology). In order to avoid discussions associated with the aggregation of the goals into a single number (Diaz-Sarachaga et al., 2018), we do not use the aggregated SDG Index score in this paper but only scores for the separate goals.
Method
Interactions can be classified as synergies (i.e. progress in one goal favors progress in another) or trade-offs (i.e. progress in one goal hinders progress in another). We examine synergies and trade-offs to the results of a Spearman correlation analysis across all the SDG indicators, accounting for all countries, and the entire time-frame between 2010 and 2018. We thereby analyze in the main analytical section (section “Interactions between SDGs”) up to 136 SDG pairs per year for 9 consecutive years minus 69 missing cases due to data gaps, resulting in a total of 1155 SDG interactions under study.
In a first analysis (section “Interactions within SDGs”), we examine interactions within each goal since every SDG is made up of a number of targets that are measured by various indicators. In a second analysis (section “Interactions between SDGs”), we then examine the existence of a significant positive and negative correlations in the SDG performance across countries. We conduct a series of cross-sectional analyses for the period 2010–2018 to understand how the SDG interactions have developed from year to year. We use correlation coefficient (rho value) ± 0.5 as the threshold to define synergy and trade-off between an indicator pair. An association is considered to have at least moderate relationship when the rho value is >0.5 or <−0.5 (Smarandache, 2009). The development on SDG interactions identified based on maximum change occurred in the shares of synergies, trade-offs, and no relations for SDG pairs between 2010 and 2018. All variables were re-coded in a consistent way towards SDG progress to avoid false associations, i.e. a positive sign is assigned for indicators with values that would have to increase for attaining the SDGs, and a negative sign in the opposite case. Our analysis is therefore applying a similar method as described by Pradhan et al. (2017) in so far as we are examining SDG interlinkages as synergies (positive correlation) and trade-offs (negative correlation). However, in important contrast to the aforementioned paper, we do not investigate SDG interactions within countries longitudinally, but instead we carry out cross-sectional investigations across countries on how the global community’s ability to manage synergies and trade-offs has evolved over the last 9 years, as well as projected SDG trends until 2030. We therefore examine global cross-sectional country data. An advance of such a global cross-sectional analysis is that it can compare the status of different countries at a given point in time, covering the SDG interactions over the whole range of development spectrum from least developed to developed ones. The longitudinal analysis covers only the interactions occurred within a country for the investigated period. Moreover, we repeat this global cross-sectional analysis for a number of consecutive years. Another novel contribution of this study is therefore to highlight how such global SDG interactions have evolved in the recent years. Finally, by resorting to the SDG Index database for the first time in the research field of SDG interactions, we use a more comprehensive dataset than was used in Pradhan et al. (2017).
In the last analytical section (“Interactions in the projected SDG trends until 2030”), we provide the first examination of how interlinkages between the projected trends in the SDGs will evolve until 2030. Based on SDG country performance from 2010 until 2015, Sachs et al. (2018) have calculated linear trajectories for the SDGs with respect to the level that will be required to achieve each goal by 2030. An important feature here is that the development in each country and goal from 2010 to 2015 up until the year 2030 is not only extrapolated but for the final score also set in relation to the level needed for SDG achievement by then. More precisely, all available data points between the years 2010 and 2015 were gathered by Sachs et al. (2018), and then their development over said period was extrapolated into the future. The linear annual growth rates (i.e. annual percentage improvements) needed to achieve each SDG by 2030 was compared to the actual average annual growth rate in each country and indicator over the period 2010–2015 (with some exceptions). The overall goal trends are an arithmetic average of the rescaled values for all trend indicators under the respective goal. This projection results in a five-point scale variable with the following classification: “decreasing” (country score is moving away from SDG achievement on this indicator), “stagnating” (country score remains stagnant or is improving at a rate below 50% of what is needed for SDG achievement by 2030), “moderately increasing” (country score is increasing at a rate above 50% but below the rate needed for SDG achievement by 2030, “on track” (score is improving at the rate needed for SDG achievement by 2030), “maintaining goal achievement” (country score is level and remains at or above SDG achievement). More details on the calculation method are available in Sachs et al. (2018). We perform the first analysis of future interactions for this new variable by assessing the synergies and trade-offs between future SDG achievement trends until 2030. Additionally, we investigate the projected SDG interactions for different income groups (low/middle/high-income countries as categorized by the World Bank) to identify similarities and differences among the income groups regarding future SDG achievement trends. In order to do so, as the first step we group the five scores into three categories to reflect their progress towards SDG achievement. If the indicator trend is classified as “decreasing”, we assign a value −1. The “stagnating” score trend is given a value 0. Since the rest of the categories (“moderately increasing”, “on track”, and “maintaining SDG achievement”) reflect positive developments towards the SDGs, we assign to them a value of 1. We then analyze interactions by multiplying these assigned values, leading to the following three outcomes: synergies (1), not-classified (0), and trade-offs (−1). Akin to the previous section, this procedure is first conducted within each SDG using its component sub-indicators, followed by an analysis of interactions between the 17 SDGs.
Results
Interactions within SDGs
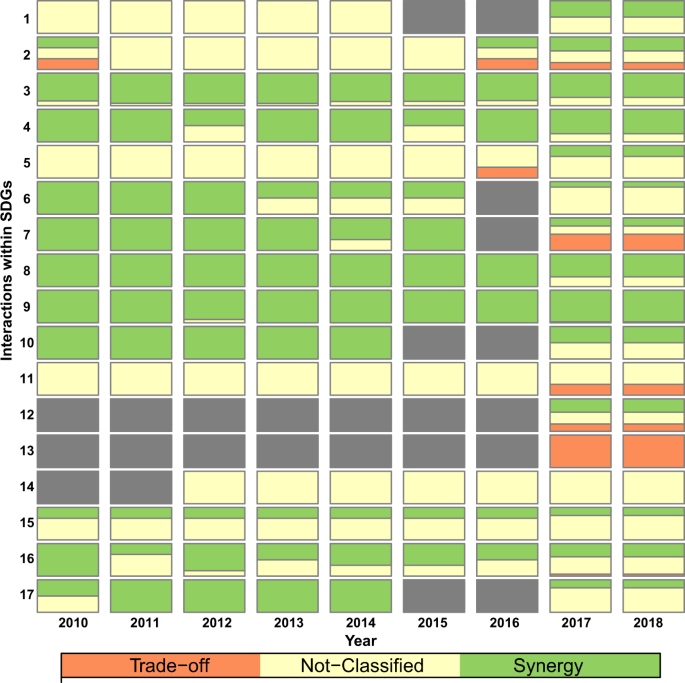
Each SDG in itself is an umbrella term that can be multi-faceted and contain numerous policy goals (United Nations, 2015). For example, SDG 7 (Affordable and clean energy) calls for “access to affordable, reliable, sustainable, and modern energy for all”. This leads to the question of potential trade-offs and synergies also within each SDG, for instance between affordable and sustainable energy, which we address here first of all, and we examine their evolution over time. We observe a mixture of results on interactions within SDGs for the period under study 2010–2018: (i) increase in synergies, (ii) growing trade-offs, and (iii) diluting associations within an SDG (Fig. 1).
The majority of goals show synergies between their component sub-indicators that are relatively stable over time. Interestingly, regarding SDG 1 (No poverty), SDG 2 (Zero hunger), and SDG 5 (Gender equality) they have emerged only recently. Before 2016, only weak associations can be observed within these goals. Interactions within SDG 5 have even flipped for a share of trade-offs to synergies between 2016 and 2017. In SDG 2, a mixed share of synergies and trade-offs are observed after 2016, with an increased share of synergies and decreased share of trade-offs. This is a positive sign for a successful implementation of the 2030 Agenda.
Trade-offs are prevalent in particular for SDG 13 (Climate action) and SDG 7 (Affordable and clean energy), illustrating the difficulty in aligning even the components within a single goal. In the case of SDG 7 these trade-offs have only emerged in 2017 while before the components were in a synergetic relationship with each other. Similarly, for SDG 11 (Sustainable cities and communities) mostly weak associations are observed before 2017 that have given way to trade-offs in the recent past. These results illustrate that for certain goals new challenges have arisen regarding successful SDG implementation.
Finally, interactions within many SDGs show that the associations among the indicators have been diluted across time, e.g., within SDG 3 (Good health and well-being), SDG 4 (Quality education), SDG 6 (Clean water and sanitation), SDG 8 (Decent work and economic growth), SDG 10 (Reduced inequalities), SDG 16 (Peace, justice and strong institutions), and SDG 17 (Partnerships for the goals). In these cases, shares of synergies have mainly been reduced by increases in shares of not-classified associations in these goals. Such diluting associations show the difficulty of maintaining intra-goal synergies, and might also be due to disproportional progress towards the goals and their targets among the countries.
Interactions between SDGs
Changes in synergies between SDGs
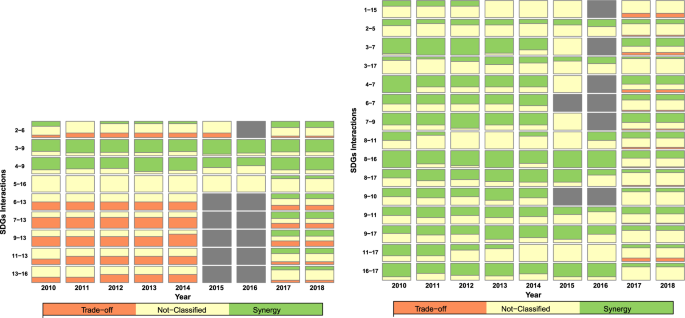
We turn to interactions between the SDGs and examine 136 SDG pairs over 9 consecutive years, which can be classified into changes in (section “Changes in synergies between SDGs”) synergies, (section “Changes in trade-offs between SDGs”) trade-offs, and (section “Changes in strength of associations between SDGs”) strength of associations. Figure 2 displays the significant increases in the share of synergies (left) and the significant decreases in the share of synergies (right). Between 2010 and 2015, we observe an increase in a share of synergies for nine SDG pairs. This finding is driven by two mechanisms: (i) a decrease of trade-offs and (ii) a strengthening of associations. For example, the indicators for SDG 2 and SDG 6 shows an increase in synergies mainly due to the breaking away of trade-offs. Both SDGs were also part of the MDGs and many countries have made progress on these goals during the MDG period, which might contribute to this increase in synergies. Another such positive example can be seen in the interactions between SDG 13 and SDGs 6, 7, 9, 11, and 16. A large share of trade-offs was converted into synergies in the recent years because of efforts to reduce emissions per capita and reconcile climate action with economic and social outcomes. However, many significant trade-offs remain, as well as in fact a long way to go to meet the well below 2 °C global warming target. Meanwhile, a strengthening of positive associations can be observed, for example, between SDGs 5 and 16.
Changes in synergetic association among the SDGs with an increased share of synergies (left) and a decreased share (right). The color bars represent the shares of trade-offs (orange), synergies (green), and not-classifieds (yellow) observed within a goal. The gray bar depicts insufficient data for the analysis
During the same period, we observe a higher number of 15 SDG pairs with a decrease in a share of synergies compared to the nine SDG pairs with an increase in synergies. In most cases, synergies have decreased due to diluting associations between SDG pairs. For example, SDG pair 3–7, 4–7, and 8–16 has shown almost 100% synergies in 2010, which has been reduced to <50% by 2018. This might be alarming in two senses: (i) positive associations might be vanishing and negative ones might be building up and (ii) countries might be having different paces in attaining the SDGs that can increase inequalities between the countries. Increases in trade-offs with a decrease in synergies can already be observed for several SDG pairs, i.e., 1–16, 3–7, 4–7, and 11–17.
Changes in trade-offs between SDGs
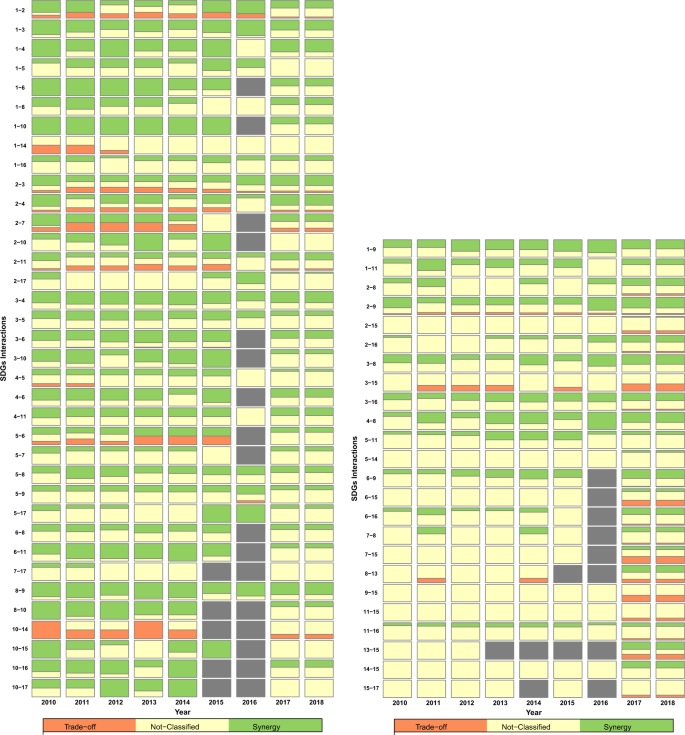
Following on a decrease in share of synergies, we observed an increase in the share of trade-offs (Fig. 3). In line with the previous sub-section, the number of SDG pairs where trade-offs are increasing (15) is higher than those which are decreasing (9). In most of cases, the mechanism underneath the deterioration is that weak associations among the goals have evolved to trade-offs, e.g. SDG pairs 1–7, 1–15, 8–15, 15–16. These trade-offs are particularly alarming and could hinder the achievement of SDGs. Therefore, a deep investigation for the caused for this is needed in future in-depth research. A good news is reducing trade-offs between some SDGs in this decade, mainly between SDG 13 and SDGs 1, 2, 3, 4, and 5. In this case, trade-offs have been converted to either synergies or weak associations.
Changes in conflicting associations among the SDGs with an increased share of trade-off (left) and a decreased share (right). The color bars represent the shares of trade-offs (orange), synergies (green), and not-classifieds (yellow) observed within a goal. The gray bar depicts insufficient data for the analysis
Changes in strength of associations between SDGs
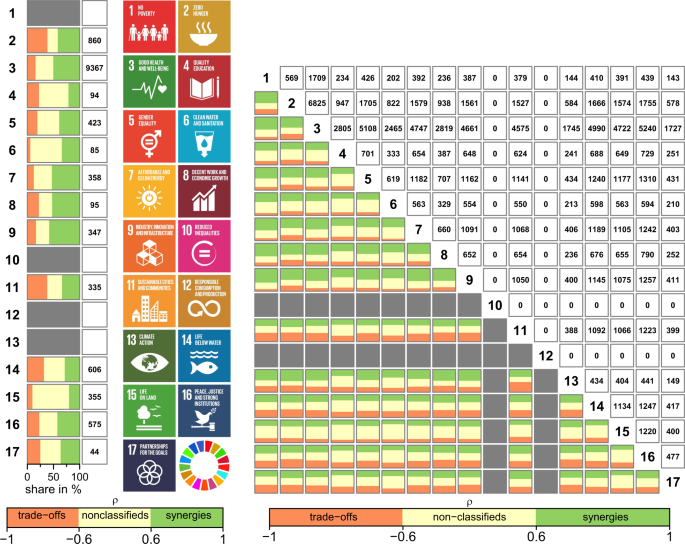
Between 2010 and 2018, we also observed an increase in weak association among 36 SDG pairs (Fig. 4). Most cases are of weakening synergies among the SDG pairs. For example, SDG pairs 1–2, 1–3, 1–4, 1–6, and 1–10 have mostly synergistic relations (a share of more than 66%) in the beginning of the decade, however, the share has decreased up to 40% in these goal pairs, sometimes with an appearance of trade-offs. Nevertheless, weakening of trade-offs has also been observed for some SDG pairs, e.g., 1–14, 2–3, 2–7, 4–5, 2–11, 5–6, and 10–14.
Changes in strength of associations among the SDGs with an diluted association (left) and a strengthened one (right). The color bars represent the shares of trade-offs (orange), synergies (green), and not-classifieds (yellow) observed within a goal. The gray bar depicts insufficient data for the analysis
By contrast, for some SDG interactions the associations, strengthened relations can be observed over time. These are due to an increase in synergies, trade-offs or both. For example, SDG pairs 4–8, 6–9, 6–16, and 7–8 shows strengthening synergistic associations, while associations between SDG 15 and SDGs 2, 3, 9, 11, and 17 evolve toward an increase in trade-offs. For the pairs, SDGs 2–8, 2–16, 6–15, 7–15 and 13–15, both share of synergies and trade-offs increase between 2010 and 2018.
Interactions in the projected SDG trends until 2030
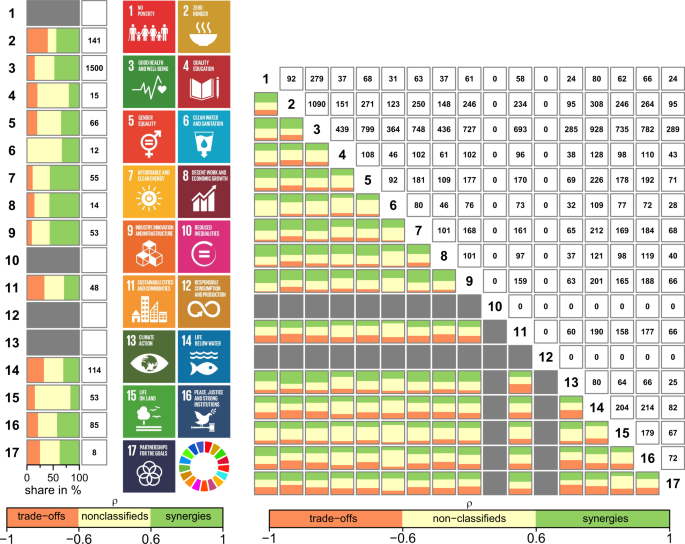
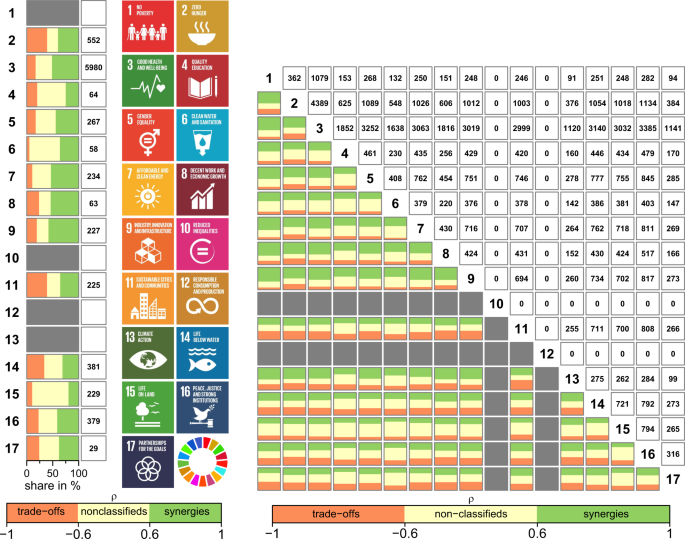
Looking ahead to the year 2030, the question arises how the performance on the SDGs will evolve over time and in particular the interactions between them. Figure 5 displays the results from the first interaction analysis of future SDG trends based on a projected trend variable that extrapolates the development in each country and goal from 2010 to 2015 up until the year 2030 and crucially relates it to the level needed for SDG achievement by then (as opposed to a mere extrapolation).
Interactions between sub-indicators within (left) and between (right) projected SDG trends until 2030. The color bars represent the shares of trade-offs (orange), synergies (green), and not-classifieds (yellow) observed within a goal. The gray bar depicts insufficient data for the analysis. The numbers in the boxes represent the number of data pairs used for each analysis. Icon images courtesy of United Nations
In line with our analysis in the section “Interactions within SDGs”, we begin by examining the sub-indicators within each SDG (Fig. 5, left), since they are often multi-faceted goals in themselves. With regard to the projected developments until 2030, the largest trade-offs that will need to be solved within the SDGs concern SDGs 2 (Zero hunger), 11 (Sustainable cities and communities), and 14 (Life below water). By contrast, the most synergetic elements are to be found within SDGs 3 (Good health), 7 (Affordable and clean energy), 8 (Decent work and economic growth), 9 (Industry, innovation, and infrastructure), and 16 (Peace, justice, and strong institutions). No results can be obtained here for goals that have insufficient trend data (SDG 10 and 12), or contain only one trend indicator (SDG 1 and 13), respectively.
Figure 5 (right) shows the interactions between projected SDG trends until 2030. It turns out that SDG 1 (No poverty) will have the most synergetic relationships with other SDGs on our way to 2030. We also expect SDGs 3 (Good health), 7 (Affordable and clean energy), 8 (Decent work and economic growth), and 9 (Industry, innovation and infrastructure) to have significant synergies with the other goals. The strongest mutually reinforcing relationships in our projections are between the following SDG pairs: 1–3, 1–7, 1–8, 1–9, and 8–9. Poverty alleviation and strengthening the economy, rooted in innovation and modern infrastructure, therefore continue to be the basis upon which many of the other SDGs can be achieved. However, trade-offs are still strongest for SDG 11 (Sustainable cities and communities) followed by SDGs 14 (Life below water), 16 (Peace, justice, and strong institutions) and 17 (Partnerships for the goals), and 13 (Climate action). In particular, the SDG pairs 9–11 and 11–13 constitute large trade-offs. This finding emphasizes the need to invest in research to foster innovations that can make our cities and communities more sustainable, as well as climate-friendly.
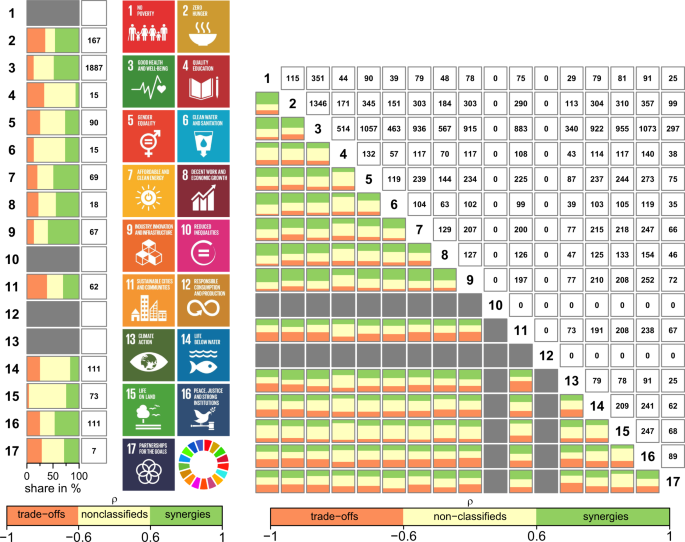
We extend the analysis of interactions between the projected SDG trends by examining high-income countries (HICs) (Fig. 6), middle-income countries (MICs) (Fig. 7), and low-income countries (LICs) (Fig. 8) separately. When examining the sub-indicators within each SDG (left-hand side of Figs 6–8), it becomes evident that the overall picture is very similar across all income groups: Countries will face similar challenges with regard to intra-goal consistency regardless of their current stage of development. The only notable differences concern SDGs 6 (Clean water and sanitation) and 15 (Life on land). For SDG 6, no synergies can be observed for HICs but their share rises for MICs and especially LICs. This finding lends support to the notion that as countries develop, the pressure to provide accessible and yet sustainable water systems will intensify in the future. By contrast, HICs show synergies regarding SDG 15 that are weaker for MICs and almost non-existent for LICs. Biodiversity protection is therefore beginning to pay off in developed regions, while the conditions for Life on land are projected to become more difficult especially in MICs and LICs. This finding sheds a light of urgency onto current public discussions around protecting green spaces, such as the Amazon forest versus economic interests.
Interactions between sub-indicators within (left) and between (right) projected SDG trends until 2030 for high-income countries. The color bars represent the shares of trade-offs (orange), synergies (green), and not-classifieds (yellow) observed within a goal. The gray bar depicts insufficient data for the analysis. The numbers in the boxes represent the number of data pairs used for each analysis. Icon images courtesy of United Nations
Interactions between sub-indicators within (left) and between (right) projected SDG trends until 2030 for middle-income countries. The color bars represent the shares of trade-offs (orange), synergies (green), and not-classifieds (yellow) observed within a goal. The gray bar depicts insufficient data for the analysis. The numbers in the boxes represent the number of data pairs used for each analysis. Icon images courtesy of United Nations
Interactions between sub-indicators within (left) and between (right) projected SDG trends until 2030 for middle-income countries. The color bars represent the shares of trade-offs (orange), synergies (green), and not-classifieds (yellow) observed within a goal. The gray bar depicts insufficient data for the analysis. The numbers in the boxes represent the number of data pairs used for each analysis. Icon images courtesy of United Nations
Turning to interactions between projected SDG trends until 2030 by income group (right-hand side of Figs 6–8), we see again a similar picture overall for all stages of development. It becomes evident, however, that for certain goals the share of projected trade-offs is lower compared to MICs and especially LICs. This is especially true for SDG 6 (Clean water and sanitation) and SDG 13 (Climate action). In other words: The pressure on pursuing climate action as well as clean water and sanitation that is not detrimental for achieving the other goals is likely to rise especially for LICs in the coming years. Unless HICs provide the technical and financial assistance necessary to let LICs benefit from state-of-the-art solutions in this regard, the development gap will rise even more at the expense of the planet and all its inhabitants—rich and poor.
Discussion: Towards a virtuous cycle of SDG progress
This study asked the timely questions: How have interactions within and between the 17 SDGs across countries evolved over time? Are we successful in moving from trade-offs to synergies? Most importantly, we provided the first analysis of interlinkages for projected SDG achievement trends until 2030.
For some goals we found positive developments with diminishing trade-offs and increasing synergies with other SDGs. This was particularly strong, for example, for SDG interactions between SDG 13 (Climate action) and SDG 9 (Industry, innovation and infrastructure), as well as SDG 13 and SDG 11 (Sustainable cities and communities). Such findings provide some support to the notion that climate-friendly infrastructure is beginning to spread, which not only improves the quality of life in cities and communities but mitigates the dangers of global warming, although our data do not provide evidence of a causal link. Likewise, synergies have begun to emerge in the recent past between SDG 5 (Gender equality) and SDG 16 (Peace and justice, strong institutions) indicating to some extent that as countries are getting better at providing strong institutions, this development may be beneficial to equality between men and women, or vice versa. In any event, such efforts will have to be significantly intensified over the next decade in order to reach the SDGs, and in these particular examples also the Paris Climate Accord and long overdue gender equality, respectively. Nonetheless, these best practices of turning trade-offs into synergies (see Fig. 2 left, Fig. 3 right, Fig. 4 right) may inform a learning process rooted in more in-depth research to expand the lessons onto other goals with more persistent trade-offs.
For numerous SDG interactions, though, the synergies are diminishing and trade-offs as well as non-associations are increasing. This worrying finding was particularly strong for the interactions, for instance, between SDG 7 (Affordable and clean energy) and SDG 1 (No poverty), as well as SDG 7 and SDG 3 (Good health and well-being). This means that as countries manage to lift millions out of poverty and provide much-needed health care, the demands on affordable and clean energy currently rises at a rate that jeopardizes progress regarding the Agenda 2030. Further investments in smart solutions and research on energy supply that can meet these new demands without putting too much pressure on planetary boundaries will be needed in the future.
Comparing our cross-sectional analysis with longitudinal analysis performed by Pradhan et al. (2017), we obtained similarities and differences. Our findings are similar in the sense that we also found, overall, a larger share of synergies than trade-offs within and across the goals. Both studies also highlight that eliminating poverty (SDG1) and improving health and well-being (SDG3) will have large synergies with other goals. However, one of the key differences is that we observed a larger share of not-classified associations in our cross-sectional analysis in comparison to the results of the longitudinal analysis by Pradhan et al. A reason for this is that our cross-sectional analysis covers a large spectrum of data from the whole range between developed and developing countries. By contrast, the aforementioned longitudinal analysis only has a comparatively narrow range of countries for the investigated period.
We provided the first analysis of future interactions between projected SDG trends until 2030, and found that SDG 1 (No poverty) will have the most synergetic relationships with other SDGs. In clear terms, this means that eliminating extreme poverty in developing countries and reducing relative poverty in more advanced nations will be a policy strategy that, given limited resources and the need for prioritization, will yield the most significant benefits beyond just this one policy goal of No poverty. Focusing on SDG 1 would therefore be the most promising strategy to ultimately start-off a virtuous cycle of SDG progress. For example, a family that no longer suffers from extreme poverty (SDG1) will be able to lead healthier lives for themselves and others, halting the spread of infectious diseases (SDG 3), contributing to a stronger economy (SDG 8), raising the means of implementation through tax payments (SDG 17) which will in turn enable public investments in infrastructure (SDG 9), which will provide education and other important services (SDG 4). The key challenge for policymakers here will then be to emulate such synergetic relationships with respect to other goals.
Despite those strong synergies, however, we were able to show that all SDG interactions between projected SDG trends until 2030 still contain a significant portion of trade-offs. This outlook into the future gives further reason for concern, and indeed casts a shadow on even most of the positive findings from our analysis of the past and present, for example regarding SDG 13 (Climate action). While we had hypothesized that synergies will occupy a larger portion in our projections of the interlinkages than trade-offs, the results indicated a nuanced picture with notable synergies for SDGs 1, 3, 7, 8 and 9, while especially SDGs 11, 13, 14, 16, and 17 are likely to have notable trade-offs with the other goals going forward.
Further distinguishing by income group has shown that, overall, countries will face similar challenges in terms of projected trade-offs and synergies across all stages of development. There were notable differences, however, especially to the detriment of LICs in the projected trade-offs for SDGs 6 (Clean water and sanitation) and 13 (Climate action) being larger than in HICs. This finding provides both an imperative and incentive for the latter to step up their technical and financial efforts to let LICs benefit from the latest advances which are already being implemented in HICs, e.g. in terms of the growing accessibility and affordability of solar panels in order to reduce emissions. It is very much in the interest of the rich countries themselves given the potentially harmful effects of a lack of climate protection by the growing populations in MICs and LICs on the HICs.
Our analysis is limited by the availability of data, which remains a challenge in SDG monitoring. A number of data gaps persist that prevent us from analyzing several SDG interactions, and the number of available SDG indicators fluctuates. Further efforts must be made by data providers to close these gaps in the future. This is especially important given the fact that 2015 is the baseline year in which the SDGs were signed into action, and most synergies/trade-offs will materialize with a time lag. We also emphasize that the method used in our paper, Spearman’s correlation, is useful to establish empirically whether improvements in one SDG go together with improvements (synergy) or deteriorations (trade-off) in another SDG. The method does not, however, allow us to determine causation. Where the terms of synergy and trade-off are used in our study, it happens in an understanding that causation is potentially from a to b, b to a, or both ways. This approach is in line with other studies on SDG interactions as quoted in our paper. In order to establish causation in the large number of interactions examined here, comprehensive additional analyses over time are required. They go beyond the scope of this paper but should be performed in future research (in a series of papers given the complexity of the task), and we hope to have sparked research along those lines with our initial inquiry.
In future research, we additionally recommend that the complexity of the SDG system be represented not only by a series of pairwise interactions but as a network, where both direct and indirect interactions produce synergies and trade-offs. The analysis according to income groups provides promising avenues for future research, and should in fact be complemented in the future by analyses that distinguish not just by income group but also by region or political system, for instance. Nonetheless, we hope that our initial findings present a useful inspiration for examining in more detail the promising patterns we have identified.
Our results may have important implications for global institutions, first and foremost the UN High-level Political Forum on Sustainable Development (HLPF), where countries meet annually to review progress on the SDGs. While the country-led Voluntary National Reviews (VNRs) are now an established tool to showcase what each country is doing in terms of progressing towards Agenda 2030 using a basket of indicators, a perspective on the interlinkages between the goals is still missing despite being crucial to the fulfillment of the goals as our study indicates. The review process of the HLPF should therefore require countries to report on what is the status of SDG interlinkages in their country (in terms of existing and projected synergies and trade-offs), as well as to outline a policy strategy to deal with these interlinkages. Country processes of SDG implementation, as well as coordination mechanisms by international organizations on Agenda 2030 should make more use of the findings on SDG interlinkages. For example, by using the evidence as a tool to inform budget allocation with a view to maximizing effect of the money spent. Likewise, research on the SDGs should by default take into account the fact that there are important interlinkages between the goals, and incorporate such effects into analytical design as well as the formulation of implications.
All in all, our findings offer a starting point for how researchers and policymakers can resolve the challenge of interactions between the SDGs, in particular regarding the persistent issue of trade-offs. We have identified best practices where it has been possible over the last 9 years to turn trade-offs into synergies. Further research should build on these successful examples and explore in depth the drivers and mechanism that enabled them. At the same time, we have found evidence of a widespread and alarming inability to overcome trade-offs and indeed a deterioration in this regard for certain SDGs. Further research into how these trends can be reversed is urgently needed as otherwise they will seriously threaten the achievement of the UN Agenda 2030.
Data availability
The datasets analyzed during the current study are available from www.sdgindex.org.
References
Akuraju V, Pradhan P, Haase D, Kropp J. P, Rybski D (2020) Relating SDG11 indicators and urban scaling—An exploratory study. Sustain Cities and Soc 52:101853
Allen C, Metternicht G, Wiedmann T (2019) Prioritising SDG targets: assessing baselines, gaps and interlinkages Sustain Sci 14:421. https://doi.org/10.1007/s11625-018-0596-8
Bue MCL, Klasen S (2013) Identifying synergies and complementarities between MDGs: results from cluster analysis Soc Indic Res 113(2):647–670. https://doi.org/10.1007/s11205-013-0294-y
Breuer A, Janetschek H, Malerba D (2019) Translating sustainable development goal (SDG) interdependencies into policy advice Sustainability 11(7):2092. https://doi.org/10.3390/su11072092
Costanza R, Fioramonti L, Kubiszewski I (2016) The UN sustainable development goals and the dynamics of well-being Front Ecol Environ 14(2):59–59. https://doi.org/10.1002/fee.1231
Diaz-Sarachaga JM, Jato-Espino D, Castro-Fresno D (2018) Is the Sustainable Development Goals (SDG) index an adequate framework to measure the progress of the 2030 Agenda? Sustain Dev 26:663–671
Engström et al. (2019) Cross-scale water and land impacts of local climate and energy policy—a local Swedish analysis of selected SDG interactions. Sustainability 11:1847
Ibisch PL, Hoffmann MT, Kreft S, Pe’er G, Kati V, Biber-Freudenberger L, DellaSala DA, Vale MM, Hobson PR, Selva N (2016) A global map of roadless areas and their conservation status. Science 354(6318):1423–1427. https://doi.org/10.1126/science.aaf7166
Lu Y, Nakicenovic N, Visbeck M, Stevance A-S (2015) Policy: five priorities for the UN sustainable development goals—comment. Nature 520(7548):432–433. https://doi.org/10.1038/520432a
Lusseau D, Mancini F (2019) Income-based variation in Sustainable Development Goals interaction networks. Nat Sustain 2:242–247
Mathy S, Blanchard O (2016) Proposal for a poverty-adaptation-mitigation window within the green climate fund. Clim Policy 16(6):752–767. https://doi.org/10.1080/14693062.2015.1050348
Moyer JD, Bohl DK (2019) Alternative pathways to human development: assessing trade-offs and synergies in achieving the Sustainable Development Goals. Futures 105:199–210
Nature Sustainability Editorial (2018). https://www.nature.com/articles/s41893-018-0131-z
Nerini F et al. (2018) Mapping synergies and trade-offs between energy and the sustainable development goals. Nat Energy 3:10–15
Nilsson M, Griggs D, Visbeck M (2016) Policy: map the interactions between sustainable development goals. Nature 534:320–322. https://doi.org/10.1038/534320a
Pradhan P (2019) Antagonists to meeting the 2030 Agenda. Nat Sustain 2:171–172
Pradhan P, Costa L, Rybski D, Lucht W, Kropp JP (2017) A systematic study of sustainable development goal (SDG) interactions. Earth’s Future 5:1169–1179. https://doi.org/10.1002/2017EF000632
Rickels W, Dovern J, Hoffmann J, Quaas MF, Schmidt JO, Visbeck M (2016) Indicators for monitoring sustainable development goals: an application to oceanic development in the European union. Earth’s Future 4(5):252–267. https://doi.org/10.1002/2016EF000353
Sachs JD (2012) From millennium development goals to sustainable development goals. Lancet 379(9832):2206–2211. https://doi.org/10.1016/S0140-6736(12)60685-0
Sachs J, Schmidt-Traub G, Kroll C, Lafortune G, Fuller G (2018) Implementing the goals. SDG index report 2018. Bertelsmann Stiftung and Sustainable Development Solutions Network, New York
Scherer et al. (2018) Trade-offs between social and environmental Sustainable Development Goals. Environ Sci Policy 90:65–72. https://doi.org/10.1016/j.envsci.2018.10.002
Schmidt H, Gostin L, Emanuel E (2015) Public health, universal health coverage, and sustainable development goals: can they coexist? Lancet 386(9996):928–930. https://doi.org/10.1016/S0140-6736(15)60244-6
Schmidt-Traub G, Kroll C, Teksoz K, Durand-Delacre D, Sachs J (2017) National baselines for the Sustainable Development Goals assessed in the SDG index and dashboards. Nat Geosci 10(8):547–555
Smarandache F (2009) Alternatives To Pearson’s and Spearman’s correlation coefficients florentin. Bull Stat Econ 3(S09):47–53
Smith P, Olesen JE (2010) Synergies between the mitigation of, and adaptation to, climate change in agriculture. J Agric Sci 148(05):543–552. https://doi.org/10.1017/S0021859610000341
Stiglitz J, Sen Amartya K & Fitoussi Jean-Paul (2009) The measurement of economic performance and social progress revisited: reflections and overview. Sciences Po publications, Paris, pp 2009–2033
Stiglitz J, Fitoussi J-P, Durand M (2018) For good measure. Advancing research on well-being metrics beyond GDP. OECD Publishing, Paris
United Nations (2015) Transforming our world: the 2030 agenda for sustainable development. http://www.un.org/ga/search/view_doc.asp?symbol=A/RES/70/1&Lang=E
Acknowledgements
CK and PP designed study; CK, AW, and PP collected and analyzed data; CK and PP wrote manuscript. The authors gratefully acknowledge financial support from the Potsdam Institute for Climate Impact Research and Bertelsmann Stiftung. AW acknowledges funding from the German Federal Ministry of Education and Research (BMBF) for the SUSFOOD project (grant agreement No. 01DP17035). PP acknowledges funding from the German Federal Ministry for the Environment, Nature Conservation, Building, and Nuclear Safety for the I-CCC project (Contract No. 81227263) and the European Union’s Horizon 2020 research and innovation program under for the European calculator project (grant agreement No. 730459).
Author information
Authors and Affiliations
Corresponding author
Ethics declarations
Competing interests
The authors declare no competing interests.
Additional information
Publisher’s note Springer Nature remains neutral with regard to jurisdictional claims in published maps and institutional affiliations.
Rights and permissions
Open Access This article is licensed under a Creative Commons Attribution 4.0 International License, which permits use, sharing, adaptation, distribution and reproduction in any medium or format, as long as you give appropriate credit to the original author(s) and the source, provide a link to the Creative Commons license, and indicate if changes were made. The images or other third party material in this article are included in the article’s Creative Commons license, unless indicated otherwise in a credit line to the material. If material is not included in the article’s Creative Commons license and your intended use is not permitted by statutory regulation or exceeds the permitted use, you will need to obtain permission directly from the copyright holder. To view a copy of this license, visit http://creativecommons.org/licenses/by/4.0/.
About this article
Cite this article
Kroll, C., Warchold, A. & Pradhan, P. Sustainable Development Goals (SDGs): Are we successful in turning trade-offs into synergies?. Palgrave Commun 5, 140 (2019). https://doi.org/10.1057/s41599-019-0335-5
Received:
Accepted:
Published:
DOI: https://doi.org/10.1057/s41599-019-0335-5
This article is cited by
-
Synthesis and Application of an Eco-Friendly Cellulose Diacrylate-Carbon Nanocomposite: A Highly Effective Inhibitor for Clay Swelling in Water-Based Drilling Fluids
Arabian Journal for Science and Engineering (2024)
-
China’s safe and just space during 40 years of rapid urbanization and changing policies
Landscape Ecology (2024)
-
An empirical model for branding oriented by the environmental sustainability of the Amazon Rainforest: a hybrid structural equation modeling with fsQCA approach
Discover Analytics (2024)
-
Fostering plant growth performance under drought stress using rhizospheric microbes, their gene editing, and biochar
Environmental Geochemistry and Health (2024)
-
The impacts of decarbonization pathways on Sustainable Development Goals in the European Union
Communications Earth & Environment (2024)

