
Abstract
Impaired wound healing is one of the most critical complications associated with diabetes mellitus. Infections and foot ulcers are major causes of morbidity for diabetic patients. The current treatment of diabetic foot ulcers, commonly used antibiotics, is associated with the development of bacterial resistance. Hence, novel and more effective natural therapeutic antibacterial agents are urgently needed and should be developed against the pathogenic bacteria inhabiting diabetic wounds. Therefore, the current study aimed to investigate the impact of fig latex on pathogenic bacteria and its ability to promote the healing process of diabetic wounds. The pathogenic bacteria were isolated from patients with diabetic foot ulcers admitted to Assiut University Hospital. Fig latex was collected from trees in the Assiut region, and its chemical composition was analyzed using GC‒MS. The antibacterial efficacy of fig latex was assessed on the isolated bacteria. An in vivo study to investigate the effect of fig latex on diabetic wound healing was performed using three mouse groups: nondiabetic control mice, diabetic mice and diabetic mice treated with fig latex. The influence of fig latex on the expression levels of β-defensin-1, PECAM-1, CCL2 and ZO-1 and collagen formation was investigated. The GC‒MS analysis demonstrated the presence of triterpenoids, comprising more than 90% of the total latex content. Furthermore, using a streptozotocin-induced diabetic mouse model, topical treatment of diabetic wound tissues with fig latex was shown to accelerate and improve wound closure by increasing the expression levels of β-defensin-1, collagen, and PECAM-1 compared to untreated diabetic wounds. Additionally, fig latex decreased the expression levels of ZO-1 and CCL2.
Introduction
A major health concern in the world today is diabetes mellitus (DM), which develops when the body is unable to produce or utilize insulin1. Globally, more than one in 10 adults are now living with diabetes. Moreover, there is a growing list of countries where one-in-five or even more of the adult population has diabetes2. According to the International diabetic federation (IDF) atlas the number of adults with diabetes is predicted to rise to 55 million by 20453. The different complications of the uncontrolled DM include retinopathy, cardiovascular diseases, neuropathy, nephropathy, and diabetic wound (DW)1,4. Patients with type 2 diabetes are more likely to suffer from these wounds, which are positively correlated with disease duration and the burden of complications5. Patients with uncontrolled diabetes have a high risk for diabetic foot ulcers (DFUs)6. Globally, it is estimated that 6.3% of diabetic patients have foot disease7, with North America generally having a higher regional incidence, which has been reported to reach 13% in some population studies8,9. It is anticipated that between 19 and 34% of people with diabetes will have a DFUs at some point in their lives6,10. Additionally, patients with DFUs are 2.5 times more likely to die than diabetic patients without foot disease; therefore, DFUs lead to significant mortality for affected patients11. DFUs affect 42.2% of diabetics and impose an economic burden on the health sector, that bears a cost of 3 billion dollars for the treatment every year12. Diabetic foot disease is one of the most challenging complications of diabetes to treat, and it has become a major cause of nontraumatic amputation13. In every 30 s, one person with diabetes is known to undergo lower extremity amputation somewhere in the world14. During diabetes, delayed wound healing is a result of different factors, including bacterial infections15. Indeed, 80% of patients with DFUs infected with pathogenic biofilm-forming bacteria need lower-limb amputation16. Hospitalization, amputation, and length of care have all been identified as major contributors to high health-care costs in the United States and elsewhere17,18. Treatments that promote speedy and complete healing of DFUs minimize the need for hospitalization, decrease the probability of amputation, and limit health-care costs19. DFUs complicated by diabetic foot infections (DFIs) are extremely probable20. The amputation rate in DFU patients is 38.4%21. Infection is a common (> 50%) side effect of DFUs22,23,24. New evidence emphasizes the significance of biofilm infection in the progression of nonhealing DFUs25. DFIs are polymicrobial in nature, and the growth mode of these microbes is complicated by the biofilm formation mechanism26,27. The inflammatory phase, which begins on the first day of wound injury and lasts for 10 days for wound repair, is a crucial stage in which colonizing pathogenic bacteria are encountered during tissue repair28. Most bacteria are genetically resistant to many antibacterial drugs. Because of the high morbidity rate, a large number of patients in hospitals are exposed to new infections due to the spread of pathogenic bacteria and drug resistance29,30. Therefore, multidrug-resistant bacteria contribute to delaying the steps of the healing process and result in the formation of chronic wounds28. Gangrene is one of the major and most severe consequences of bacterial infection associated with diabetes and is due to hyperglycemia leading to the failure of the immune response to control the spread of invading pathogens31,32. Polymicrobial biofilm aggregates have emerged as a major danger in the broader discipline of wound infection, as it is in this form that microbes acquire more resistance to host defenses and antibiotics, in addition to acquiring pathogenicity33,34. Pathogenic and commensal bacteria coaggregate synergistically in a pathogenic biofilm to establish a persistent infection35. Early identification and treatment of pathogenic microorganisms remain critical therapeutic goals that must be achieved36. Pathogenic bacteria such as Staphylococcus sp., Pseudomonas sp. and Bacillus species have been found to play a major role in attachment to catheters due to their ability to form biofilms37. Biofilms act as a mechanical barrier to antimicrobials and immune system cells and contribute to multidrug resistance38. Although Staphylococcus haemolyticus is considered a normal microbiota of the skin and an opportunistic pathogen associated with hospital-acquired infections, infections caused by it are increasing. Regardless of its low virulence profile, S. haemolyticus poses a serious risk to patients with DFUs due to its multidrug resistance39. Another concern with Staphylococcus infections is that some bacteria can produce biofilms to evade host immune systems and protect themselves against therapies, which play a crucial role in the virulence and pathogenicity of Staphylococcus spp. Nonhealing DFUs are distinguished by impaired wound healing associated with recurrent Staphylococcus aureus infection and unresolved inflammation40. A previous study tested S. haemolyticus strains isolated from bloodstream infections and discovered that 34% of them could form biofilms in vitro41. Moreover, multidrug-resistant Pseudomonas aeruginosa infection has become a challenge in clinical practice42,43,44. In the treatment of DFUs, commonly used antibiotics are linked to negative side effects, such as irritation, hyperpigmentation, histocompatibility, tissue rejection and the emergence of bacterial resistance45,46. Thus, empiric treatment for infected DFUs may fail if there is microbial resistance47. Moreover, the choice of the appropriate antibiotics for the infection is difficult; furthermore, coselection may involve resistance genes48. Globally, antibiotic resistance is a significant threat. According to the World Health Organization (WHO), “The world urgently needs to change the way it prescribes and uses antibiotics.”49. Therefore, this problem can be solved by developing new medications with minimal or no side effects and without developing new resistant microbes. Consequently, the usage of natural compounds in pharmaceuticals has greatly expanded. According to one of the World Health Organization (WHO) performed investigations, approximately 80% of the global population received medications containing chemicals produced from natural compounds50,51,52,53 for a wide range of infections. Many phytochemicals are antibacterial and play an integral role in healing therapies54. The biomolecular compounds generated and extracted from plants are a valuable source of antibacterial and anti-biofilm-forming pathogenic bacteria55. Plants have been used for therapeutic purposes because they are associated with fewer toxic effects and are more economical than manufactured therapies56,57.
The fluid in some laticiferous plants called latex contains bioactive compounds with valuable antibacterial and antioxidant effects. Latex is a biological fluid secreted by a wide range of plants and is composed of several types of metabolites, such as polyisoprene and sugars. The protein compounds of latex (peptidases, lipases, chitinases, steroids and numerous secondary metabolites) are commonly found in various latex fluids. In addition to the industrial importance of plant latex as a rubber source, as from the para rubber tree (Hevea brasiliensis), latex is a component of plant defense against microbes58. The stored latex in specialized cells called laticifers is secreted in response to any plant physical damage or wounding58.
In contrast to most latex-bearing plants, which store small, limited amounts of latex, the fruit of the fig tree (Ficus carica) exudes a high amount of latex. From ancient times to the present, fig latex has been used in India for people who suffer cracks in the mouth or on the lips or tongue because it is an excellent tonic. This effect may be due to fig latex enzymes such as ficin, proteases, lipodiastase, and amylase59. Plant latex is frequently applied topically to a variety of wounds and plays a key role in wound care60,61,62. Many endogenous proteases are involved in the various stages of wound healing during the physiological healing process; similarly, latex proteases used to treat wounds will act on various stages of wound healing63. For instance, procoagulant and thrombin-like proteases function to restore hemostasis during the early stages of wound healing. In the later stages of wound healing for debridement, plasmin-like and other ECM-degrading proteases assist, and some mitogenic proteases aid in cell proliferation and angiogenesis. Plant latex collagenolytic and other ECM-degrading proteases could play a role in the remodeling of collagen and other extracellular matrix (ECM) components62.
In addition to the increase in health complications while using chemically synthetic drugs, the large-scale use of antibiotics leads to different strains of multidrug-resistant bacteria. The latex of figs has been applied on a large scale in the treatment of warts, skin ulcers and sores and can be taken as a purgative and vermifuge59. Fig latex is useful for milk coagulation and can be used as a lipid-lowering drug due to the presence of triterpenoids64. Fig latex is considered a restorative natural material that helps in quick recovery after prolonged illness65. Due to its antimicrobial activities, low toxicity, and availability, fig latex represents a remedy for several health complications66. Nevertheless, no published work has demonstrated the antibacterial activities of fig latex against the pathogenic bacteria inhabiting diabetic wounds. Thus, the current study is a pioneer study evaluating the potential impact of fig latex on pathogenic bacteria isolated from human DFUs in vitro. Furthermore, the study aimed to clarify the efficacy of fig latex in accelerating the healing process of diabetic wound skin tissues in a streptozotocin (STZ)-induced diabetic mouse model in vivo by monitoring the expression of some proteins related to the healing process, such as β-defensin (antibacterial protein) and zonula occluden-1 (ZO-1), using ELISA. Additionally, the expression levels of CCL2 and PECAM-1 were detected using immunohistochemistry (IHC).
Results
Gas chromatography‑mass spectrometry (GC–MS) analysis of fig latex
The GC‒MS analysis of fresh fig crude latex showed the presence of twenty-four bioactive compounds with concentrations more than 0.1% of the total latex contents. The most abundant compound with the highest percentage was taraxasterol acetate (more than 50% of the total latex content). Moreover, the olean-12-en-3-ol, acetate, (3.beta.)- was detected and represented 32% of the total latex content. Finally, 9,19-cyclolanost-24-en-3-ol, (3.beta.)- (3.999%) and Lanosta-8,24-dien-3-ol, acetate, (3.beta.)- (3.346%) were detected. All four major chemical constituents represented 90% of the latex. Other active compounds, along with their concentration (peak area %) and retention time (RT), are presented with the chromatogram in Fig. 1, and the chemical components obtained from the GC‒MS analysis are presented in detail in Table 1.

Gas chromatography and mass spectrometry chromatogram of fig latex analysis. The analysis demonstrated several peaks with different retention times to 47 min of twenty-four active constituents. A, B, C and D are zoomed regions of the chromatogram, RT, retention time.
Fig latex exerts antibacterial activity using the well diffusion method
After the bacteria were obtained from DFUs using a swab method, the bacterial community was screened. We isolated many pure strains using the streak plate method, spreading bacteria in different culture media, such as MSA for gram-positive bacteria and MacConkey agar for gram-negative bacteria. The antibacterial activity of fresh fig latex was tested against five DFU biofilm-forming bacterial isolates, Staphylococcus haemolyticus AUMC B-331, two Gram-negative Pseudomonas sp., Bacillus sp., and Paenibacillus sp., to determine the efficacy of the latex as an antibacterial drug. The diameter of the inhibition zone is shown in Fig. 2. The largest clear zones formed by fresh fig latex were 32, 30, and 28 mm, against St. haemolyticus AUMC B-331, Bacillus sp., and Paenibacillus sp., respectively, whereas the smallest clear zone observed was 18 mm against Pseudomonas sp. MS2, and there was no significant effect with no clear zone or growth inhibition against Pseudomonas sp. MS4. Stored latex showed less activity than fresh crude latex, as presented in Table 2.

Inhibition zone showing the antibacterial activity of fresh fig latex on bacteria isolated from diabetic wounds. Causing a clear zone with diameter against the pathogenic bacteria (A) Paenibacillus sp., (B) Bacillus sp., (C) Pseudomonas sp. MS2, (D) Pseudomonas sp. MS4 and (E) Staphylococcus haemolyticus AUMC b-331.
Determination of the minimum inhibitory concentration (MIC) and minimum bactericidal concentration (MBC)
The MIC value was found to be 250 mg/mL, demonstrating a promising effect of fresh fig latex as a natural antibacterial agent. According to broth macrodilution results, the MIC was 250 mg/ml for St. haemolyticus AUMC B-331, Bacillus sp., Pseudomonas sp. MS2, and Paenibacillus sp., and the MBC was 500 mg/mL; the MIC of fig latex for Pseudomonas sp. MS4 was not reported (Fig. 3).

Minimum inhibition concentration (MIC) of fig latex for gram-positive and gram-negative bacteria. MIC reduction is presented as the decrease in the OD600 of the bacterial suspension treated with latex at various concentrations (0.97, 1.95, 3.9, 7.81, 15.62, 31.25, 62.5, 125, 250 and 500 μg/ml) against St. haemolyticus, Ps. MS2, Ps. MS4, Bacillus sp. and Paenibacillus sp. showing the MIC at 250 mg/ml with a red circle.
Fig latex reduces bacterial biofilm formation
The results of the plate shown in Fig. 4A were quantified using a microplate reader at OD 600 nm, and it was revealed that there were five isolates forming the biofilm: Staphylococcus haemolyticus AUMC B-331, Pseudomonas sp. MS2, Pseudomonas sp. MS4, Bacillus sp., and Paenibacillus sp. Low, moderate, and high bacterial biofilm-forming ability was interpreted when OD600 nm was < 1, 1–2.9 and > 2.9, respectively. Accordingly, Pseudomonas sp. MS4 showed high biofilm-forming ability, while Pseudomonas sp. MS2 and St. haemolyticus showed moderate ability. On the other hand, Bacillus sp. and Paenibacillus sp. had low biofilm-forming ability. In Fig. 4B, the ability of fig latex to reduce the bacterial biofilm formed by these isolates is illustrated. Notably, it was found that fresh fig latex at the MIC had the ability to significantly reduce the biofilm formed by four isolates out of the five tested, Staphylococcus haemolyticus AUMC B-331, Pseudomonas sp. MS2, Bacillus sp., and Paenibacillus sp. However, it had no significant activity against Pseudomonas MS4 sp. The percent biofilm inhibition after treatment with fig latex is shown in Fig. 4C. Additionally, after treatment with fig latex, the biofilm formed by Staphylococcus haemolyticus AUMC B-331 was decreased by 73%, that formed by Pseudomonas sp. MS2 was decreased by 37%, that formed by Paenibacillus sp. was decreased by 39% and that formed by Bacillus sp. was decreased by 67%. Additionally, fig latex inhibited the biofilm formed by Pseudomonas sp. MS4 by only 11%, showing that there was no significant effect of latex on Pseudomonas sp. MS4.

The impact of fig latex on bacterial biofilm using a microtiter plate biofilm assay against five pathogenic bacterial isolates from diabetic foot ulcers. (A) Microtiter plate showing the differences in the color intensity; (B) Quantitative determination of the optical density of the biofilm from the isolated bacteria as control (open bars) and after treatment with latex (closed bars); (C) Percentage of the antibiofilm activity of fig latex against the bacterial isolates (St. haemolyticus, Ps. MS2, Ps. MS4, Bacillus sp. and Paenibacillus sp.).
Survival curve of DFU pathogenic bacteria in the presence of fig latex
The survival curve test of isolated bacteria demonstrated a slightly similar increase in growth over 24 h. The growth curves were decreased in the case of the treatment of the bacterial culture with the MIC of fresh fig latex after nearly 8 h, with a significant growth inhibition starting at 16 h of culture with fig latex, as demonstrated in Fig. 5A–C, E. In contrast, the growth curve of Pseudomonas sp. MS4 did not show any significant decrease after the treatment of the culture with fig latex, suggesting that it is a strain resistant to fig latex (Fig. 5D).

Survival curve of DFU pathogenic bacteria in the presence of fresh fig crude latex. The curves represent the bacterial isolates supplemented with the MIC of fresh fig latex in TSB media (dashed line) and show a significant decrease in OD600 for (A) Paenibacillus sp., (B) Bacillus sp., (C) Pseudomonas sp. MS2, and (E) Staphylococcus haemolyticus AUMC B-331 but not for (D) Pseudomonas sp. MS4. The curves represent the bacterial isolates in TSB media without latex (solid line) and show an increase in OD at 600 nm. The results are the mean from triplicate independent measurements.
Fig latex enhances the healing process of diabetic wounds
The in vivo experiment on the mouse model, shown in Fig. 6A, monitored the morphological changes occurring in the three animal groups at each time point from Day 0 to Day 15 post-wounding. It was noted that in the diabetic animals, the healing process of wounds was delayed, and abscesses were found in the diabetic wounds with no healing compared to the healing process of wounds in the control group. Most importantly, topical application of fig latex on the diabetic wounds twice daily improved and accelerated the wound closure near that found in the control group. Figure 6B shows the wound size starting from 8 mm in the three animal groups at Day 0 post-wounding. The diabetic group showed a significant increase in the wound diameter (4 mm) (impaired healing) compared to the wound diameter (0 mm) in the control group at Day 15 post-wounding. Interestingly, when the wounds were topically treated with fresh fig latex, the wound diameters (0 mm) were similar to those found in the control group. The percentage of wound closure was calculated from the accumulated data (Fig. 6C). The diabetic animals exhibited a significant decrease in the percentage of wound closure compared to the control nondiabetic group. Amazingly, when the diabetic wounds were topically treated with fresh fig latex, the percentage of wound closure was significantly enhanced a level similar to that found in the control group.

Effect of fig latex on wound healing and wound closure in diabetic mice. (A) Photographs showing the effect of fig latex on accelerating the healing process in diabetic wounds at each time point from Day 0 (the day of wound creation) until Day 15 (final point). (B) The accumulated data from three individual mice in each group at each time point post-wounding represent the change in diameter (mm). (C) The accumulated results from three animals in each group for each time point post-wounding were calculated by the previously mentioned equation in the Methods section, and the results show the percentage of wound closure. The data are expressed as the mean ± SEM. *P < 0.05, Diab. versus cont., +P < 0.05, diabetic mice treated with Latex versus cont., #P < 0.05, diabetic treated with Latex versus diabetic group.
Fig latex restores collagen formation in the wounded skin tissues of diabetic mice
Figure 7A–E shows representative pictures of wounded skin tissues stained with Sirius red to monitor collagen deposition. In Row A, at Day 3, the three animal groups showed similar collagen deposition. However, from Row B to E, it was found that from Day 6, the expression of collagen began to obviously increase in the control group over time until reaching the maximal expression at Day 15 post-wounding. However, the diabetic animals showed an obvious decrease in the expression of collagen compared to the control animals. Most importantly, the treatment of diabetic mice with fig latex restored collagen expression to levels similar to those found in the control group. Using ImageJ software, the collagen expression in three animals per group was quantified, and accumulated data are presented in Fig. 7F. From Day 6 to Day 15 post-wounding, both control and fig latex-treated diabetic animals demonstrated similar expression of collagen in wounded skin tissues. Nevertheless, the diabetic animals exhibited a significant decrease in the expression of collagen.

Collagen deposition in the wounded skin tissues stained with Sirius red. Collagen formation (red color) was detected in the wounded skin tissues of the three animal groups using Sirius red staining. One representative experiment is shown at 3 (A), 6 (B), 9 (C), 12 (D) and 15 days (E) post-wounding. (F) The percentages of collagen formation were quantified in the three animal groups, and the accumulated data from three animals from each group are expressed as the mean percentage of collagen formation ± SEM in control mice (open bars), diabetic mice (closed black bars) and diabetic mice treated with fig latex (hatched bars). *P < 0.05, diabetic versus control; and +P < 0.05, diabetic-treated with fig latex versus diabetic animals.
Fig latex enhances vascularization in wounded diabetic skin tissues
Figure 8A–E displays representative pictures of the immunohistochemical (IHC) expression of platelet endothelial cell adhesion molecule (PECAM-1) as a marker of vascularization in wounded skin tissues. The diabetic animal group showed a decrease in the expression of PECAM-1 from Day 3 to 15 post-wounding, with a mild positive reaction compared to those found in the control animals, which exhibited a strong positive reaction of PECAM-1 expression. Amazingly, the wounded tissues of diabetic skin mice treated with fig latex exhibited a moderate reaction compared to the control group. Using ImageJ software, accumulated data for PECAM-1 expression were quantified and are presented in Fig. 8F. The diabetic mice showed a significant decrease in the expression levels of PECAM-1 from Day 3 to Day 15 post-wounding. In contrast to the diabetic group, both control and fig latex-treated mice exhibited a significant increase in the expression of PECAM-1 from Day 3 to Day 15 post-wounding.

Effects of fig latex on the expression levels of PECAM-1 in wounded diabetic skin tissues. The expression levels of PECAM-1 were detected in the wounded skin tissues of the three animal groups using anti-PECAM-1 and IHC assays. One representative experiment is shown at 3 (A), 6 (B), 9 (C), 12 (D) and 15 days (E) post-wounding. (F) The PECAM-1+ cells were quantified in the three animal groups, and the accumulated results from three animals from each group are expressed as the mean percentage of PECAM-1+ cells ± SEM in control mice (open bars), diabetic mice (closed black bars) and diabetic mice treated with fig latex (hatched bars). *P < 0.05, diabetic versus control; and +P < 0.05, diabetic-treated with fig latex versus diabetic animals.
Fig latex decreases the expression level of inflammatory CCL2 in wounded diabetic skin tissues
Figure 9A–E shows one representative image of the expression of CCL2 (an inflammatory chemokine). Predominantly, it was noticed that there was increased CCL2 expression in diabetic wounds from Day 3 to 15 after wounding compared to the CCL2 expression in the wounds of the control group, suggesting the presence of the severe complications and protein expression dysregulation associated with diabetes. Topical treatment of diabetic mice with fig latex decreased CCL2 expression to levels similar to those found in the control group. The accumulated data from three animals per group (Fig. 9F) were quantified using ImageJ software. The data demonstrated a gradual significant elevation in CCL2 expression from Days 3 to 15 post-wounding. Nevertheless, the expression levels of CCL2 were significantly decreased in the wounded tissues of the control and fig latex-treated groups with a notable mild reaction.

Topical application of fig latex restored the expression levels of CCL2 in wounded diabetic skin tissues. (A, B, C, D and E) show one representative experiment of CCL2 expression in the control mice, diabetic mice and diabetic mice treated with latex at Days 3, 6, 9, 12 and 15 post-wounding. (F) The CCL2+ cells were quantified in the three animal groups, and the accumulated results from three animals from each group are expressed as the mean percentage of CCL2+ cells ± SEM in control mice (open bars), diabetic mice (closed black bars) and diabetic mice treated with fig latex (hatched bars). *P < 0.05, diabetic versus control; and +P < 0.05, diabetic-treated with fig latex versus diabetic animals.
Fig latex accelerates the healing process of diabetic wounds via the restoration of the expression levels of β-defensin-1 and ZO-1
It was concluded that fig latex inhibits pathogenic growth in vitro; hence, the expression levels of an antibacterial protein (β-defensin) and a tight junction protein (ZO-1) were monitored using ELISA and are shown in Fig. 10A, B, respectively. Our results showed decreased levels of β-defensin-1 and elevated levels of ZO-1 in diabetic mice compared to control animals. Interestingly, fig latex-treated diabetic mice exhibited significantly restored levels of β-defensin-1 and ZO-1 compared to vehicle-treated diabetic animals.
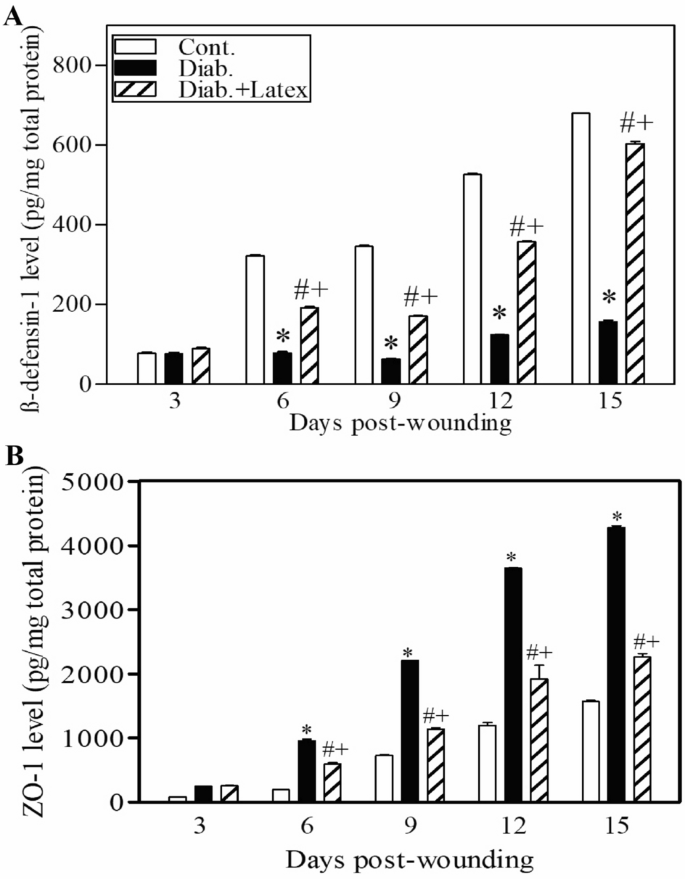
Topical application of fig latex altered the expression of β-defensin-1 and ZO-1. The levels of β-defensin-1 (A) and ZO-1 (B) in the wounded skin tissues of control mice (open bars), untreated diabetic mice (closed black bars), and diabetic mice treated with fig latex (hatched bars) were measured using ELISA. The collected data from three mice in each group are expressed as the mean ± SEM (n = 3). *P < 0.05 for diab. versus cont.; +P < 0.05 for diab. treated with fig latex versus cont.; and #P < 0.05 diab. treated with fig latex versus diab. (ANOVA with Tukey’s post-test).
Discussion
Several lines of evidence were used to demonstrate that fig latex exhibited major compounds with powerful biological activities, especially for inhibiting the biofilm formed by the pathogenic bacteria inhabiting diabetic wounds, and their pivotal role for accelerating the healing process. The GC‒MS analysis of fig latex revealed that crude fresh latex contains several phytochemical components, such as terpenes, coumarins, flavonoids and alkaloids67. Taraxasterol acetate, which is known as pentacyclic triterpenoid68, was only identified in 2006 by Teixeira et al. screening in fig leaves in Portugal67. This important compound was detected for the first time and made up more than 50% of the total latex content in fig latex collected in Egypt and has never been recorded before in any previous analysis of fig latex; this may be due to the difference in the geographic distribution. Another important compound is the triterpenoid olean-12-en-3-ol, acetate, also named β-amyrin acetate69, which was quantified in the fig latex analysis and represented 32% of the total latex content. Interestingly, some fig latex components identified in GC‒MS analyses have been found to have antimicrobial activities, such as α-gurjunene70, nonadecane71, germacrenes, pentadecane72,73, cis-13-eicosenoic acid, tetracosahexaene74, 2,5-di-tert-butyl-p-quinone75, cis-vaccenic acid76, and lanosta-8,24-dien-3ol, acetate (3.beta. also displayed antifungal and antibacterial activity77. Other components, such as humulene78, elemene79, 1-[5-(2-methylphenoxy)pentyl]piperidine, α-amyrin acetate80, and β-amyrin acetate81, have shown anti-inflammatory activities, and high-concentration taraxasterol acetate has been shown to have significant antibacterial, anti-inflammatory and anticancer activities82. Some of these compounds were identified in our GC‒MS analysis and were detected in several previous GC‒MS analyses of fig latex as previously described83,84; these compounds are considered antibacterial phytochemicals. Hence, in the current study, the antibacterial effect of fig latex was due to the fact that more than 83% of the total latex content was taraxasterol acetate and β-amyrin acetate. Most importantly, our data revealed the antibacterial activity of fresh fig latex against pathogenic bacteria. Similarly, Aref et al.84 proposed that this may be caused by the fact that these two major compounds exhibited similar antibacterial activity against both gram-positive bacteria, especially Staphylococcus sp., and gram-negative bacteria85,86,87. Moreover, fig latex was shown to be a therapeutic agent for the complications associated with diabetes, such as an impaired healing process due to the inhibition of insulin sensitivity leading to hyperglycemia88, as indicated by the results of the decrease in glucose levels in the mouse model we used after topical treatment with fig latex. In the results of the in vitro study of the antibacterial activity, fresh fig latex showed significant activity against the tested biofilm-forming pathogenic bacteria isolated from diabetic wounds, with MICs of 250–500 mg/ml. This result was also observed in several previous studies, one of them against oral bacteria89,90, with MICs ranging from 500 to 750 mg/ml. In addition, the study performed by Aref et al.91 investigated the antibacterial effect of fig latex on Escherichia coli, Proteus mirabilis, and Staphylococcus aureus with an MIC of 5 mg/ml. Similar to the results in the study performed in 2014 by Rashid et al., the antibacterial activity of fig latex against Staphylococcus aureus, Streptococcus pyogenes, Escherichia coli, Salmonella typhi, Pseudomonas aeruginosa, and Klebsiella pneumoniae was better than that of gentamycin92. Additionally, fresh latex was more effective than stored latex, which confirms the results of previous studies93. Our results demonstrated a lack of antibacterial activity of fig latex against the bacterial strain Pseudomonas sp. Ms4 (Resistant). The biofilm assay showed that fig latex decreased the biofilm formed by the tested strains isolated from diabetic wounds, especially Staphylococcus sp., and it was shown in preclinical trials that fig latex was highly successful for clearing biofilm-forming Staphylococcus species94. Antibiotics lose their ability to fight bacteria that are protected inside biofilms. In wound treatment, one of the remedies is to boost the antibiotic concentration by a thousand-fold. Another option is to target the biofilm directly, allowing the antibiotic to restore its effectiveness, but all antibiotics used have an adverse effect on health, so the use of fig latex is highly recommended, as it is a natural product that fights pathogenic bacteria. Furthermore, fig latex has the ability to accelerate the wound healing process in the case of diabetic wounds, which may be due its antibacterial activity against the pathogenic bacteria (as shown in the current study) that impaired the healing process95. Our data revealed that topical application of fig latex on diabetic wounds accelerated the healing process. Indeed, many factors stall the healing process during diabetes, such as specific metabolic deficiencies, impaired physiological responses and the shrinking of blood vessels96. Unexpectedly, topical application of fig latex mediated restoration and increased collagen deposition (as shown by Sirius red staining). Additionally, the expression of PECAM-1 levels was determined in diabetic wounds as a response to the presence of whole bacteria97, as shown in Fig. 8. The moderate positive reaction of PECAM-1 was evidenced as a consequence of fig latex activity on the diabetic wounds. The impact of fig latex on wound healing may be due to its ability to decrease the risk of bacteria inhabiting diabetic wounds and increase PECAM-1 expression98 because it was previously illustrated that PECAM-1 is necessary for flow-induced vascular remodeling99. Interestingly, the treatment of diabetic wounds with fig latex gradually decreased the levels of CCL2 expression and hence inhibited the inflammation of the wounded tissues. In this context, it has been shown that bacterial infection of wounded tissues in diabetic animals leads to a strong increase in the expression of CCL2100. These important findings proved the multifunctional ability of fig latex as a good candidate for an anti-inflammatory and antibacterial agent that could accelerate the healing process by downregulating the expression of CCL2. On the other hand, Li et al., 2010 argued that anti-CCL2 antagonists can be used to prevent bacterial infection at the local level101. A consequence of β-defensin-1 is constitutive expression in most tissues; it has been suggested as the most significant antibacterial autoimmune defense in living tissues102. Here, ELISA analysis demonstrated that the treatment of wounded diabetic skin tissues with fig latex increased the expression levels of β-defensin-1. The antibacterial, anti-inflammatory, and wound-healing abilities of β-defensin-1 promote its use as a prospective strategy to overcome the impaired diabetic wound healing process103. As detected in our study, the expression levels of ZO-1 were significantly decreased after the treatment of wounded diabetic skin tissues with fig latex compared to untreated diabetic mice, confirming the upregulation of ZO-1 expression within diabetic epidermal cells, which, in turn, delayed the healing process104. In this context, it has been illustrated that the presence of pathogenic bacteria in wounds influences tight junction proteins (TJs), including the ZO-1 protein105.
Conclusions
The impairment of diabetic wound healing was attributed to pathogenic bacteria invading the diabetic wounds and the effects of these bacteria on prolonging the healing phases. Furthermore, disrupted CCL2 and PECAM-1 angiogenic signaling led to impaired and delayed wound healing. Our results illustrate that fig latex accelerated the healing process of diabetic wounds via its direct effect on the survival of pathogenic bacteria and the formed biofilm. Moreover, fig latex improved the healing process by restoring the expression levels of β-defensin-1 and PECAM-1 and collagen formation. Additionally, the treatment of diabetic mice with fig latex regulated the expression levels of ZO-1 and CCL2, suggesting the efficacy of fig latex as a natural candidate for the management of diabetic wounds.
Material and methods
Plant latex extraction and storage conditions
The latex of figs was collected from June to August 2019 and 2020 from unripe inedible fig fruit from plants located at the site “N 26°55′51″ E 31°29′17- El Badari-Assiut-Egypt”.
The latex was collected in 1.5 ml Eppendorf tubes and was stored in an icebox during the collection time. No official or specific permits were required for the previously described location or for plant latex collection. The plant used in the present study is not protected or endangered. A milky white liquid (latex) bleeds out of the green unripe fruit when they are being cut. The latex was collected at its peak of activity in the early morning (6–8 am). The latex was obtained by placing a sterile 1.5 ml Eppendorf tube under the cut site of the fruit, collecting approximately 10 ml (1 ml in each Eppendorf tube) and storing the latex by putting these tubes in an icebox to be used on the same day of collection. Latex not used after 12 h of its collection from the tree was discarded because of coagulation106. Fig latex was sterilized by filtration using a filter with a pore size of 0.45 μm, collected in a labeled sterile screw-top tube and stored at − 20 °C until use. The plant experiments were performed in accordance with relevant guidelines and regulations.
Gas chromatography‒mass spectrometry analysis
The analysis of Ficus carica latex hexane extract was performed on a gas chromatograph‒mass spectrometer (Agilent Technologies, GC Model 7890A coupled with inert MSD Model 5975B, USA) equipped with a J&W capillary DB-5MS column (30 m in length; 0.25 mm i.e.; 0.25 mm film thickness) and an ionization voltage of 70 eV. The carrier gas was He with a flow rate of 0.5 mL/min to 10.9 min and then ramping to 1 mL/min for 40 min by increasing the rate to 1 mL/min. The oven temperature program was as follows: 40 °C for 2 min, followed by ramping of 10 °C/min to 150 °C for 3 min, and then 220 °C by a flow rate of 10 °C/min for 6 min. Finally, 280 °C was achieved with ramping of 15 °C/min for 20 min. The chromatograph was equipped with a split/splitless injector used in the split mode. The split ratio was 1:100. The control of the GC‒MS system and the data peak processing were carried out using MS Hunter software. The identification of components was assigned by matching their mass spectra with Wiley and NIST library data. Sample analyses were carried out at the Analytical Chemistry Unit (ACAL), accredited by the American Association for Laboratory Accreditation (A2LA), Assiut University, Egypt.
Patients, bacterial strains and culture conditions
The study was approved by the ethical committee of the Faculty of Medicine, Assiut University, Egypt (IRB no: 17101272). Informed and written consent was given by all participants prior to enrollment. All methods were performed in accordance with the guidelines of the Declaration of Helsinki. The guidelines used for the microbial studies were those of the Clinical and Laboratory Standard Institute (CLSI). Different species of bacteria, including Gram-positive and Gram-negative bacteria, were isolated using the swab method107 from diabetic foot ulcers of diabetic patients attending the Diabetes, Endocrine Centre and Vascular Surgery outpatient clinics in Assiut University Hospitals. All isolates were processed, isolated and identified by standard methods108,109, including Gram staining, culture, biochemical reactions, VITEK and 16S rRNA sequencing. The isolates used were Staphylococcus haemolyticus AUMC b-331, two Pseudomonas species, Bacillus sp., and Paenibacillus species. Bacteria were cultured in nutrient broth (N.B.) (5 g/L peptone, 3 g/L beef extract and 3 g/L NaCl) for 24 h at 37 °C. The optical density (OD) of the cultures was quantified at 600 nm. The cultures were diluted with 0.9% NaCl (normal saline) to bring the OD value to 0.260, which is equivalent to a turbidity of 0.5 McFarland units [106 CFU/mL]110. N.B. was utilized to maintain and grow the bacteria for most of the in vitro bacteriological studies. However, to perform the biofilm assay, tryptic soy broth (TSB) medium consisting of 17 g of tryptone, 3 g of soy, 5 g of NaCl, 2.5 g of dipotassium phosphate (K2HPO4), and 2.5 g of glucose was dissolved in one liter, autoclaved after gentle heating, and used for Staphylococcus sp., and Lauri broth (LB) medium was used for Pseudomonas species, Bacillus sp., and Paenibacillus sp. The absorbance for measuring planktonic and biofilm growth was evaluated using a Multiscan Spectrum (THERMO ELECTRON CORPORATION, FINLAND) ELISA reader94,111. Muller-Hinton agar medium was used for the detection of antimicrobial activity.
Antibacterial activity of fig latex using a well diffusion assay
The conventional well diffusion method used as a screening method to determine the antibacterial efficacy of natural products reported early by112,113 and according to NCCLS114 was employed for the initial assessment of the antibacterial potential of the fig latex extract. The inoculum of each 18–20 h precultured pathogenic bacterial isolate to be tested containing 106 CFU ml-1 was spread using a sterile swab moistened with the bacterial suspension on Muller-Hinton agar plates. Subsequently, wells of 8 mm diameter were placed into agar medium, filled with 100 μl of fresh latex, and kept at room temperature for 2 h to allow diffusion115. Then, the plates at 36° ± 1 °C for 24 h were incubated under aerobic conditions in an upright position. Standard antibiotic discs of oxacillin (5 μg/disc), tetracycline (30 μg/disc), methicillin (MET, 5 mcg), and cefotaxime (CTX, 30 mcg) were used. All tested antibiotic discs were served as positive reference standards to determine the sensitivity of the bacterial stains tested. The clear zone surrounding the well (microbial growth inhibition zone) was measured as the diameter in millimeters (mm), and three replicates were performed against each of the pathogenic bacteria tested.
Determination of MIC by the broth macrodilution method and the MBC
Serial twofold dilutions (500, 250, 125, 62.5, 31.25, 15.62, 7.81, 3.9, 1.95, 0.97 mg/mL) were prepared in N.B. in sterile tubes, and their OD values were measured at 600 nm110. Then, these tubes were inoculated with 100 μL of bacterial suspension and incubated at 37 °C for 24 h. Using a spectrophotometer with a wavelength of 600 nm, the OD values of each test tube inoculum were measured. These values were subtracted from those obtained prior to incubation. This subtraction is important to exclude the interference in absorbance due to the color of the latex. Inoculated test tubes with zero or near-zero OD values represented the MIC of latex116.
Determination of the MBC
We determined the MBC value; tubes with MIC values were subcultured on freshly prepared sterilized nutrient agar (N.A.) plates. Then, the plates were incubated at 37 °C for 24 h, and the growth of bacteria was observed. A decrease in colony count by 99.9% from the original bacterial inoculum was taken as the MBC value117.
Anti-biofilm assay
We designed a microtiter plate to test eleven isolates from diabetic feet to determine which of them could form biofilms and to determine the ability of latex to inhibit biofilm formation. The quantitative biofilm formation and planktonic growth were measured by the method described by Kolter et al.118 and demonstrated by Elamary et al.119. The recovered DFU pathogenic bacterial isolates were tested for their biofilm activity in a 96-well microtiter plate according to119,120 as follows: Briefly, isolates were grown on tryptic soy agar (TSA) for 48–72 h as indicated under static conditions at 37 °C to obtain rigid biofilm structures121. The samples were suspended and diluted in TSB, adjusted to an OD620 of 0.06 ≈ 0.5 McFarland standard, which contains approximately 1 to 1.5 × 10⁸ CFU/mL. Then, 130 μl from each isolate culture was plated into a 96-well microtiter plate (U bottom), and 30 μl of fresh latex was added at different concentrations, followed by incubation for 24 h at 37 °C under aerobic and static conditions119. Planktonic growth was detected by measuring the absorbance of each well at 600 nm using a microplate reader. Then, the plate was washed three times using 200 μl of sterile PBS to remove the grown culture and the nonadherent cells (washing step). Then, to detect the anti-biofilm activity of fig latex, the wells were air dried; consequently, the adherent biofilm was stained using 200 μl of 0.1% freshly prepared crystal violet for 10 min. The excess stain was removed by rinsing three times with 200 μl of PBS or sterilized distilled water. Furthermore, 100 μl of 70% ethanol was added and incubated for 30 min to stain the crystal violet (solubilization step). Finally, the absorbance of each well was measured at 600 nm using a microplate reader119.
Survival curve of the DFU pathogenic bacterial isolates in the presence of fresh fig latex
The increase in total cell mass and cell number was quantified by estimating the turbidity of a bacterial suspension using a spectrophotometer. Therefore, the suspension at the beginning and completion of the experiment was measured. Isolates were grown overnight on TSA plates, two tubes for each isolate suspended in TSB to an OD600 of 0.01. The first tube of each isolate was considered the positive control, and the other tube was incubated with the MBC value of fig latex. All tubes for each isolate were incubated at 37 °C. An aliquot of approximately 1 ml was tested from the culture medium over time (0, 4, 8, 12, 16, 20, and 24 h) to monitor the value of the optical density of all bacterial treatments at OD600 using the “MIOSTECH, INC. (USA), UV-120 SPECTROPHOTOMETER”. Readings were taken three times. The results were confirmed by taking 50 μl of each treatment at an OD600 of 0.0 (complete killing) onto fresh TSA and incubating at 37 °C for 24 h (three plates were used for each isolate).
In vivo wound closure studies and ethical issues
In total, 60 healthy BALB/c strain male mice (25–30 g) 4 to 5 months old were procured from the VACSERA animal farm, Helwan—Cairo, Egypt. The animals were housed in standard animal environmental conditions (25–28 °C, 65–70% relative humidity and a 12-h/12-h light/dark cycle) for one week for adaptation. During the experiment, the mice were fed a standard pellet diet and given water ad libitum. The Animal Ethics Committee (AEC) of the Faculty of Medicine, Assiut University, approved the protocol used in this study according to the National Institutes of Health (NIH) guidelines. The study was also reported in accordance with ARRIVE guidelines. We made all efforts to minimize animal distress and reduce the number of animals used in this study. Streptozotocin (STZ) was purchased from Sigma Chemical Co. (St. Louis, MO, USA). STZ was freshly prepared for immediate use (within 5 min) by dissolving in cold 0.01 M citrate buffer (pH 4.50). All mice were fasted for 20 h prior to diabetes induction. The mice (n = 40) were rendered diabetic via daily intraperitoneal (i.p.) injection of STZ (60 mg/kg body weight in 0.01 M citrate buffer, pH 4.5) for 5 consecutive days, and mice in the control group (n = 20) were injected with vehicle alone (0.01 M citrate buffer, pH 4.5). Blood glucose levels were monitored by a glucose meter (BIONEME GM300, TAIWAN) three days after the induction of diabetes. Blood was taken from the tail vein, and glucose levels were determined. Mice with blood glucose levels > 250 mg/dL were considered diabetic mice122. The animals were housed for 2 weeks prior to wounding and fig latex treatment to generate a chronic diabetic animal model (glucose level exceeding 250 mg/dl).
Experimentally inflicted wounds and macroscopic examination
Two weeks following diabetes induction, the mice were wounded as previously described123,124. Briefly, the mice were anesthetized with a single i.p. injection of ketamine (80 mg/kg body weight) and xylazine (10 mg/kg body weight)125,126. The back of each mouse was shaved and cleaned with 70% ethanol127,128. Two wounds (8 mm in diameter) were made on the back of each mouse by excising the skin and underlying panniculus carnosus129. Mice were randomly divided into three groups: Group 1, nondiabetic control mice; Group 2, diabetic mice; and Group 3, diabetic mice treated with fig latex. The wounded skin area of mice in the control and diabetic groups was topically treated with 50 μl PBS (vehicle)/wounded area/day for 15 days128. However, the wounded area in mice of Group 3 was topically treated with fresh fig latex (50 μl every 12 h/wounded area/day for 15 days). The diameters of wounds were estimated and recorded at the indicated time points as previously described130. The optimal dose of fig latex was determined in our laboratory based on the LD50 value and several previously established parameters128. Skin biopsy specimens were obtained from animals in each group 3, 6, 9, 12, and 15 days after wounding for ELISA and IHC analyses131. The diameter of each wound site was measured at the indicated time points to calculate the percentage area of wounds that had closed and healed125. Changes in the wound area are expressed as a percentage of the initial wound area. The percentages were calculated using the diameter of steel making the wound (8 mm) as the initial diameter size (D0), and the diameter was calculated at every time point under investigation (D1): % of wound closure = [(D1 − D0)/D1] × 100.
ELISA analysis
A 2.0-mm punch biopsy taken from the wound area was collected and frozen in liquid nitrogen. The samples were homogenized in lysis buffer containing protease inhibitors (Roche Diagnostics, Indianapolis, IN), disrupted using Fast Prep (Q-Biogene, Solon, OH), and centrifuged at 5000× g for 10 min. The concentration of protein in each lysate was assessed using a bicinchoninic acid (BCA) protein assay kit (Pierce, Rockford, IL), and the supernatants were tested for β-defensin and ZO-1 levels using an ELISA kit (R&D Systems, Lille Cedex, France) according to the manufacturer’s instructions and as previously described132. The results were expressed as picograms of target molecule per milligram of total protein for each sample.
Immunohistochemistry analysis
Samples were isolated from animals 3, 6, 9, 12 and 15 days post-wounding for histopathological examination. The skin specimens were immediately fixed in formal alcohol until processed133,134. Each specimen was then dehydrated and embedded, and thin sections (3 μm) were prepared. For immunohistochemistry, tissue sections were processed and stained with the following primary antibodies (anti-PECAM-1 and anti-CCL2) (Santa Cruz Biotechnology).
Statistical analysis
Statistical analysis was performed based on normally distributed data, which are expressed as the means ± standard errors of the means (SEM), using GraphPad Prism software version 5. The significant differences among the three groups were analyzed using one-way ANOVA followed by Tukey’s posttest.
Data availability
All generated data are included in the published manuscript. For any other information, contact the corresponding author (Gamal Badr: badr73@yahoo.com and gamal.badr@aun.edu.eg).
References
Sanapalli, B. K. et al. Human beta defensins may be a multifactorial modulator in the management of diabetic wound. Wound Repair Regen. 28, 416–421 (2020).
Sun, H. et al. IDF Diabetes Atlas: global, regional and country-level diabetes prevalence estimates for 2021 and projections for 2045. Diabetes Res. Clin. Pract. 183, 109119 (2022).
Federation, I. IDF Diabetes Atlas, tenth. International Diabetes (2021).
Mahesh, T. et al. Blended ensemble learning prediction model for strengthening diagnosis and treatment of chronic diabetes disease. Comput. Intell. Neurosci. https://doi.org/10.1155/2022/4451792 (2022).
Abularrage, C. J. et al. Evaluation of the microcirculation in vascular disease. J. Vasc. Surg. 42, 574–581 (2005).
Armstrong, D. G., Boulton, A. J. & Bus, S. A. Diabetic foot ulcers and their recurrence. N. Engl. J. Med. 376, 2367–2375 (2017).
Zhang, P. et al. Global epidemiology of diabetic foot ulceration: a systematic review and meta-analysis. Ann. Med. 49, 106–116 (2017).
Margolis, D. J. et al. Incidence of diabetic foot ulcer and lower extremity amputation among Medicare beneficiaries, 2006 to 2008. Data Points Publication Series [Internet] (2011).
Boyko, E. J., Ahroni, J. H., Cohen, V., Nelson, K. M. & Heagerty, P. J. Prediction of diabetic foot ulcer occurrence using commonly available clinical information: the Seattle Diabetic Foot Study. Diabetes Care 29, 1202–1207 (2006).
Singh, N., Armstrong, D. G. & Lipsky, B. A. Preventing foot ulcers in patients with diabetes. JAMA 293, 217–228 (2005).
Walsh, J., Hoffstad, O., Sullivan, M. & Margolis, D. Association of diabetic foot ulcer and death in a population-based cohort from the United Kingdom. Diabet. Med. 33, 1493–1498 (2016).
Awasthi, A. et al. Recent progress in development of dressings used for diabetic wounds with special emphasis on scaffolds. BioMed Res. Int. https://doi.org/10.1155/2022/1659338 (2022).
Wang, H., Xu, Z., Zhao, M., Liu, G. & Wu, J. Advances of hydrogel dressings in diabetic wounds. Biomater. Sci. 9, 1530–1546 (2021).
Atlas, I. D. Brussels, Belgium: international diabetes federation; 2013. Int. Diabetes Federation (IDF) 147 (2017).
Edwards, R. & Harding, K. G. Bacteria and wound healing. Curr. Opin. Infect. Dis. 17, 91–96 (2004).
Adler, A. I., Boyko, E. J., Ahroni, J. H. & Smith, D. G. Lower-extremity amputation in diabetes. The independent effects of peripheral vascular disease, sensory neuropathy, and foot ulcers. Diabetes Care 22, 1029–1035 (1999).
Girod, I. et al. An economic evaluation of the cost of diabetic foot ulcers: results of a retrospective study on 239 patients. Diabetes Metab. 29, 269–277 (2003).
Holzer, S. E. S. et al. Costs and duration of care for lower extremity ulcers in patients with diabetes. Clin. Ther. 20, 169–181 (1998).
Albert, S. Cost-effective management of recalcitrant diabetic foot ulcers. Clin. Podiatr. Med. Surg. 19, 483–491 (2002).
Prompers, L. et al. Resource utilisation and costs associated with the treatment of diabetic foot ulcers. Prospective data from the Eurodiale Study. Diabetologia 51, 1826–1834 (2008).
Kim, S.-Y. et al. Predictors for amputation in patients with diabetic foot wound. Vasc. Spec. Int. 34, 109 (2018).
Falanga, V. Wound healing and its impairment in the diabetic foot. Lancet 366, 1736–1743 (2005).
Bjarnsholt, T. et al. Why chronic wounds will not heal: a novel hypothesis. Wound Repair Regen. 16, 2–10 (2008).
Dinh, T. L. & Veves, A. A review of the mechanisms implicated in the pathogenesis of the diabetic foot. Int. J. Lower Extrem. Wounds 4, 154–159 (2005).
Richard, J. L., Lavigne, J. P. & Sotto, A. Diabetes and foot infection: more than double trouble. Diabetes Metab. Res. Rev. 28, 46–53 (2012).
Kalan, L. et al. Redefining the chronic-wound microbiome: fungal communities are prevalent, dynamic, and associated with delayed healing. MBio 7, e01058-e11016 (2016).
Kalan, L. R. et al. Strain-and species-level variation in the microbiome of diabetic wounds is associated with clinical outcomes and therapeutic efficacy. Cell Host Microbe 25, 641–655 (2019).
Singh, K., Agrawal, N. K., Gupta, S. K., Sinha, P. & Singh, K. Increased expression of TLR9 associated with pro-inflammatory S100A8 and IL-8 in diabetic wounds could lead to unresolved inflammation in type 2 diabetes mellitus (T2DM) cases with impaired wound healing. J. Diabetes Complicat. 30, 99–108 (2016).
Afroz, M. et al. Ethnobotany and antimicrobial peptides from plants of the solanaceae family: an update and future prospects. Front. Pharmacol. 11, 565 (2020).
Danish, P., Ali, Q., Hafeez, M. & Malik, A. Antifungal and antibacterial activity of aloe vera plant extract. Biol. Clin. Sci. Res. J. https://doi.org/10.54112/bcsrj.v2020i1.4 (2020).
Bishnoi, A., Raj, D. & Mahajan, R. Atypical manifestations of cutaneous staphylococcal infection in infants–Generalized bullous impetigo and asymmetrical peripheral gangrene. Indian J. Paediatr. Dermatol. 22, 339 (2021).
Berbudi, A., Rahmadika, N., Tjahjadi, A. I. & Ruslami, R. Type 2 diabetes and its impact on the immune system. Curr. Diabetes Rev. 16, 442 (2020).
Roilides, E., Simitsopoulou, M., Katragkou, A. & Walsh, T. J. How biofilms evade host defenses. Microbiol. Spectr. 3(3), 3 (2015).
Roy, S. et al. Mixed-species biofilm compromises wound healing by disrupting epidermal barrier function. J. Pathol. 233, 331–343 (2014).
Dowd, S. E. et al. Polymicrobial nature of chronic diabetic foot ulcer biofilm infections determined using bacterial tag encoded FLX amplicon pyrosequencing (bTEFAP). PLoS ONE 3, e3326 (2008).
Alam, M. R., Hershberger, E. & Zervos, M. J. The role of fluoroquinolones in the treatment of skin and soft tissue infection. Curr. Infect. Disease Rep. 4, 426–432 (2002).
Jamal, M. et al. Bacterial biofilm and associated infections. J. Chin. Med. Assoc. 81, 7–11 (2018).
Ramaprabha, P., Ramani, C. & Kesavan, R. Study on microbiome of chronic non healing diabetic ulcers with special reference to biofilm and multidrug resistant strains. J. Clin. Diagn. Res. 15, 1–6 (2021).
Manoharan, M., Sistla, S. & Ray, P. Prevalence and molecular determinants of antimicrobial resistance in clinical isolates of Staphylococcus haemolyticus from India. Microb. Drug Resist. 27, 501–508 (2021).
Pastar, I. et al. Intracellular Staphylococcus aureus triggers pyroptosis and contributes to inhibition of healing due to perforin-2 suppression. J. Clin. Investig. 131 (2021).
Barros, E. M., Lemos, M., Souto-Padrón, T. & Giambiagi-deMarval, M. Phenotypic and genotypic characterization of biofilm formation in Staphylococcus haemolyticus. Curr. Microbiol. 70, 829–834 (2015).
Qi, L. et al. Synergistic antibacterial and anti-biofilm activities of resveratrol and polymyxin B against multidrug-resistant Pseudomonas aeruginosa. J. Antibiot. 75, 567–575. https://doi.org/10.1038/s41429-022-00555-1 (2022).
Aldana, P. C. & Khachemoune, A. Diabetic foot ulcers: appraising standard of care and reviewing new trends in management. Am. J. Clin. Dermatol. 21, 255–264 (2020).
Samadian, H. et al. Electrospun cellulose acetate/gelatin nanofibrous wound dressing containing berberine for diabetic foot ulcer healing: in vitro and in vivo studies. Sci. Rep. 10, 1–12 (2020).
Miyan, Z., Fawwad, A., Sabir, R. & Basit, A. Microbiological pattern of diabetic foot infections at a tertiary care center in a developing country. Age Years 53, 10–20 (2017).
Wysocki, A. B. & Dorsett-Martin, W. A. Enhance your knowledge of skin grafts. OR Nurs. 2, 30–38 (2008).
Najari, H. R., Karimian, T., Parsa, H., QasemiBarqi, R. & Allami, A. Bacteriology of moderate-to-severe diabetic foot infections in two tertiary hospitals of Iran. Foot 40, 54–58 (2019).
Acar, J. & Moulin, G. Antimicrobial resistance: a complex issue. Rev. Sci. Tech. 31, 23–31 (2012).
Pasarkar, N., Waghmare, S. & Kamble, H. Antibiotic resistance: a review.
Parveen, A. et al. Hypo-magnesium and hyperlipidemia responsible for hypertensive status of pregnant women in Pakistani population. J. Pharm. Res. Int. https://doi.org/10.9734/jpri/2020/v32i3230934 (2020).
Hafeez, M. N. et al. Mutant Gossypium universal stress protein-2 (GUSP-2) gene confers resistance to various abiotic stresses in E. coli BL-21 and CIM-496-Gossypium hirsutum. Sci. Rep. 11, 1–19 (2021).
Algradi, A. M., Liu, Y., Yang, B.-Y. & Kuang, H.-X. Review on the genus Brugmansia: traditional usage, phytochemistry, pharmacology, and toxicity. J. Ethnopharmacol. 279, 113910 (2021).
Soni, N., Mehta, S., Satpathy, G. & Gupta, R. K. Estimation of nutritional, phytochemical, antioxidant and antibacterial activity of dried fig (Ficus carica). J. Pharmacogn. Phytochem. 3 (2014).
Venmathi Maran, B. A. et al. Hepatoprotective potential of malaysian medicinal plants: a review on phytochemicals, oxidative stress, and antioxidant mechanisms. Molecules 27, 1533 (2022).
Winning, H. Z., Ali, Q., Rashid, M. S. & Malik, A. Antibacterial, antifungal and anticancer activities of multi-stress affected zingiber officinale plant extracts. Plant Cell Biotechnol. Mol. Biol. 21, 106–117 (2020).
Khalid, S., Ali, Q., Hafeez, M. & Malik, A. Perception regarding self-medication of antibiotics in general public sector university of southern Punjab: a comparison between medical and non-medical students. Biol. Clin. Sci. Res. J. https://doi.org/10.54112/bcsrj.v2021i1.51 (2021).
Houda Lazreg, A. et al. In vitro antimicrobial activity of four ficus carica latex fractions against resistant human pathogens [antimicrobial activity of ficus carica latex]. (2010).
Ramos, M. V., Demarco, D., da Costa Souza, I. C. & de Freitas, C. D. T. Laticifers, latex, and their role in plant defense. Trends Plant Sci. 24, 553–567 (2019).
Zhang, J., Onakpoya, I. J., Posadzki, P. & Eddouks, M. (Hindawi, 2015).
Ayyanar, M. & Ignacimuthu, S. Some less known ethnomedicinal plants of Tirunelveli hills, Tamil Nadu. J. Econ. Taxon. Bot. 33, 73–76 (2009).
Suriya, C., Kasatpibal, N., Kunaviktikul, W. & Kayee, T. Diagnostic indicators for peptic ulcer perforation at a tertiary care hospital in Thailand. Clin. Exp. Gastroenterol. 4, 283 (2011).
Urs, A. P., Manjuprasanna, V., Rudresha, G., Yariswamy, M. & Vishwanath, B. in Proteases in Physiology and Pathology 297–323 (Springer, 2017).
Altundag, E. & Ozturk, M. Ethnomedicinal studies on the plant resources of east Anatolia, Turkey. Procedia Soc. Behav. Sci. 19, 756–777 (2011).
Badgujar, S. B., Patel, V. V., Bandivdekar, A. H. & Mahajan, R. T. Traditional uses, phytochemistry and pharmacology of Ficus carica: a review. Pharm. Biol. 52, 1487–1503 (2014).
Hussain, S. Z., Naseer, B., Qadri, T., Fatima, T. & Bhat, T. A. in Fruits Grown in Highland Regions of the Himalayas 77–90 (Springer, 2021).
Gani, G. et al. Phytochemistry and pharmacological activities of fig (Ficus carica): a review. Int J. Res. Pharm. Pharm. Sci. 3, 80–82 (2018).
Teixeira, D. M., Patão, R. F., Coelho, A. V. & da Costa, C. T. Comparison between sample disruption methods and solid–liquid extraction (SLE) to extract phenolic compounds from Ficus carica leaves. J. Chromatogr. A 1103, 22–28 (2006).
Reynolds, W. F. et al. Total assignment of the 13C spectrum of taraxasteryl acetate by 13C–13C connectivity experiments and determination of the stereochemistry of taraxasterol by X-ray diffraction. Can. J. Chem. 63, 1048–1054 (1985).
Ferdosi, M. F., Khan, I. H., Javaid, A. & Fardosi, M. F. GC-MS examination of methanolic extract of Cirsium arvense flower. Pak. J. Weed Sci. Res. 27, 173–180 (2021).
Salleh, W. M. N. H. W., Khamis, S., Rahman, M. N. A. & Nafiah, M. A. Chemical composition and biological activities of Dipterocarpus cornutus Dyer essential oil. Z. Naturforschung C 75, 171–175 (2020).
Kuppuswamy, K., Jonnalagadda, B. & Arockiasamy, S. Gc-ms analysis of chloroform extract of Croton bonplandianum. Int. J. Pharma Bio Sci. 4, 613–617 (2013).
Begum, I. F., Mohankumar, R., Jeevan, M. & Ramani, K. GC–MS analysis of bio-active molecules derived from Paracoccus pantotrophus FMR19 and the antimicrobial activity against bacterial pathogens and MDROs. Indian J. Microbiol. 56, 426–432 (2016).
Girija, S., Duraipandiyan, V., Kuppusamy, P. S., Gajendran, H. & Rajagopal, R. Chromatographic characterization and GC-MS evaluation of the bioactive constituents with antimicrobial potential from the pigmented ink of Loligo duvauceli. Int. Sch. Res. Not. https://doi.org/10.1155/2014/820745 (2014).
Peng, W. et al. Characteristics of antibacterial molecular activities in poplar wood extractives. Saudi J. Biol. Sci. 24, 399–404 (2017).
Jannu, V. G., Sanjenbam, P. & Kannabiran, K. Preclinical evaluation and molecular docking of 2, 5-di-tert-butyl-1, 4-benzoquinone (DTBBQ) from Streptomyces sp. VITVSK1 as a potent antibacterial agent. Int. J. Bioinform. Res. Appl. 11, 142–152 (2015).
Semwal, P., Painuli, S., Badoni, H. & Bacheti, R. K. Screening of phytoconstituents and antibacterial activity of leaves and bark of Quercus leucotrichophora A. Camus from Uttarakhand Himalaya. Clin. Phytosci. 4, 1–6 (2018).
Shingate, B. B. et al. Synthesis and antimicrobial activity of novel oxysterols from lanosterol. Tetrahedron 69, 11155–11163 (2013).
Passos, G. F. et al. Anti-inflammatory and anti-allergic properties of the essential oil and active compounds from Cordia verbenacea. J. Ethnopharmacol. 110, 323–333 (2007).
Zhai, B. et al. Drug delivery systems for elemene, its main active ingredient β-elemene, and its derivatives in cancer therapy. Int. J. Nanomed. 13, 6279 (2018).
Okoye, N. N. et al. Beta-amyrin and alpha-amyrin acetate isolated from the stem bark of Alstonia boonei display profound anti-inflammatory activity. Pharm. Biol. 52, 1478–1486 (2014).
Fabiyi, O. A., Atolani, O., Adeyemi, O. S. & Olatunji, G. A. Antioxidant and cytotoxicity of β-amyrin acetate fraction from Bridelia ferruginea leaves. Asian Pac. J. Trop. Biomed. 2, S981–S984 (2012).
Sharma, K. & Zafar, R. Occurrence of taraxerol and taraxasterol in medicinal plants. Pharmacogn. Rev. 9, 19–23. https://doi.org/10.4103/0973-7847.156317 (2015).
Menichini, G. et al. Fig latex (Ficus carica L. cultivar Dottato) in combination with UV irradiation decreases the viability of A375 melanoma cells in vitro. Anti-Cancer Agents Med. Chem. (Former. Curr. Med. Chem. Anti-Cancer Agents) 12, 959–965 (2012).
Lazreg-Aref, H., Mars, M., Fekih, A., Aouni, M. & Said, K. Chemical composition and antibacterial activity of a hexane extract of Tunisian caprifig latex from the unripe fruit of Ficus carica. Pharm. Biol. 50, 407–412 (2012).
Moustafa, M. F., Alamri, S. A., Taha, T. H. & Alrumman, S. A. In vitro antifungal activity of Argemone ochroleuca Sweet latex against some pathogenic fungi. Afr. J. Biotechnol. 12, 1132–1137 (2013).
Catteau, L., Zhu, L., Van Bambeke, F. & Quetin-Leclercq, J. Natural and hemi-synthetic pentacyclic triterpenes as antimicrobials and resistance modifying agents against Staphylococcus aureus: a review. Phytochem. Rev. 17, 1129–1163 (2018).
Wang, Z. et al. Phytochemistry, pharmacology, quality control and future research of Forsythia suspensa (Thunb.) Vahl: a review. J. Ethnopharmacol. 210, 318–339 (2018).
Putta, S. et al. Therapeutic potentials of triterpenes in diabetes and its associated complications. Curr. Top. Med. Chem. 16, 2532–2542 (2016).
Mawa, S., Husain, K. & Jantan, I. Ficus carica L. (Moraceae): phytochemistry, traditional uses and biological activities. Evid. Based Complement. Altern. Med. https://doi.org/10.1155/2013/974256 (2013).
Chawla, A., Kaur, R. & Sharma, A. K. Ficus carica Linn.: a review on its pharmacognostic, phytochemical and pharmacological aspects. Int. J. Pharm. Phytopharmacol. Res. 1, 215–232 (2012).
Aref, H. L. et al. In vitro antimicrobial activity of four Ficus carica latex fractions against resistant human pathogens (antimicrobial activity of Ficus carica latex). Pak. J. Pharm. Sci. 23, 53–58 (2010).
Rashid, K. I., Mahdi, N. M., Alwan, M. A. & Khalid, L. B. Antimicrobial activity of fig (Ficus carica Linn.) leaf extract as compared with latex extract against selected bacteria and fungi. J. Babylon Univ./Pure Appl. Sci. 5, 1620–1626 (2014).
Doro, B., Garsa, S. M. B., Abusua, F. I. M., Elmarbet, N. & Shaban, M. B. In vitro antibacterial activity of Ficus carica L. (Moraceae) from Libya. J. Complement. Altern. Med. Res. 5, 1–8 (2018).
Baidamshina, D. R. et al. Targeting microbial biofilms using Ficin, a nonspecific plant protease. Sci. Rep. 7, 1–12 (2017).
Greenhalgh, D. G. in Total Burn Care (Third Edition) (ed David N. Herndon) 578–595 (W.B. Saunders, 2007).
Brem, H. & Tomic-Canic, M. Cellular and molecular basis of wound healing in diabetes. J. Clin. Investig. 117, 1219–1222 (2007).
Farrugia, C. et al. Mechanisms of vascular damage by systemic dissemination of the oral pathogen Porphyromonas gingivalis. FEBS J. 288, 1479–1495 (2021).
Lovelace, M. D. et al. Absence of platelet endothelial cell adhesion molecule 1, PECAM-1/CD31, in vivo increases resistance to Salmonella enterica serovar Typhimurium in mice. Infect. Immunity 81, 1952–1963 (2013).
Chen, Z. & Tzima, E. PECAM-1 is necessary for flow-induced vascular remodeling. Arterioscler. Thromb. Vasc. Biol. 29, 1067–1073 (2009).
Krause, K. et al. Association of CCL2 with systemic inflammation in Schnitzler syndrome. Br. J. Dermatol. 180, 859–868 (2019).
Li, B. et al. Evaluation of local MCP-1 and IL-12 nanocoatings for infection prevention in open fractures. J. Orthop. Res. 28, 48–54 (2010).
Bilska, B. et al. Expression of antimicrobial peptide genes oscillates along day/night rhythm protecting mice skin from bacteria. Exp. Dermatol. 30, 1418–1427 (2021).
Sulijaya, B., Masulili, S. L. C. & Auerkari, E. I. Human beta-defensin-1 and periodontal disease: the past, present, and future. J. Indones. Dent. Assoc. 4, 61–68 (2021).
Okano, J. et al. Hyperglycemia induces skin barrier dysfunctions with impairment of epidermal integrity in non-wounded skin of type 1 diabetic mice. PLoS ONE 11, e0166215 (2016).
Laukoetter, M. G., Bruewer, M. & Nusrat, A. Regulation of the intestinal epithelial barrier by the apical junctional complex. Curr. Opin. Gastroenterol. 22, 85–89 (2006).
Sharma, C. P., Sheela, M. & Chandrasekhar, V. Fig tree sap: antithrombogenicity on nylon surfaces. Bull. Mater. Sci. 7, 75–77 (1985).
Wangoye, K., Mwesigye, J., Tungotyo, M. & Twinomujuni Samba, S. Chronic wound isolates and their minimum inhibitory concentrations against third generation cephalosporins at a tertiary hospital in Uganda. Sci. Rep. 12, 1–10 (2022).
Mendes, J. J. et al. Clinical and bacteriological survey of diabetic foot infections in Lisbon. Diabetes Res. Clin. Pract. 95, 153–161. https://doi.org/10.1016/j.diabres.2011.10.001 (2012).
Salah, M., Badr, G., Hetta, H., Khalifa, W. A. & Shoreit, A. A. Isolation and identification of pathogenic biofilm-forming bacteria invading diabetic wounds. Assiut Univ. J. Multidiscipl. Sci. Res. 51, 163–178 (2022).
Saleem, U. et al. In-vitro antimicrobial susceptibility testing of leaves methanol extract and latex of euphorbia helioscopia using agar well diffusion and broth dilution methods. J. Anim. Plant Sci. 25, 261–267 (2015).
Prasad, Y. S. et al. An injectable self-healing anesthetic glycolipid-based oleogel with antibiofilm and diabetic wound skin repair properties. Sci. Rep. 10, 1–12 (2020).
Magaldi, S. et al. Well diffusion for antifungal susceptibility testing. Int. J. Infect. Dis. 8, 39–45 (2004).
Valgas, C., Souza, S. M., Smânia, E. F. & Smânia, A. Jr. Screening methods to determine antibacterial activity of natural products. Braz. J. Microbiol. 38, 369–380 (2007).
Abu-Shanab, B., Adwan, G. M., Abu-Safiya, D., Jarrar, N. & Adwan, K. Antibacterial activities of some plant extracts utilized in popular medicine in Palestine. Turk. J. Biol. 28, 99–102 (2005).
Dahiya, P. & Purkayastha, S. Phytochemical screening and antimicrobial activity of some medicinal plants against multi-drug resistant bacteria from clinical isolates. Indian J. Pharm. Sci. 74, 443 (2012).
Devienne, K. F. & Raddi, M. S. G. Screening for antimicrobial activity of natural products using a microplate photometer. Braz. J. Microbiol. 33, 166–168 (2002).
Wendelin, I., Gasser, R. & Reisinger, E. A macrodilution well method for minimum inhibitory concentration and minimum bactericidal concentration determination of antimicrobials against Borrelia burgdorferi in vitro. J. Spirochetal Tick Borne Dis. 4, 7–10 (1997).
O’Toole, G. A. et al. [6] Genetic approaches to study of biofilms. Methods Enzymol. 310, 91–109 (1999).
Elamary, R. B., Albarakaty, F. M. & Salem, W. M. Efficacy of Acacia nilotica aqueous extract in treating biofilm-forming and multidrug resistant uropathogens isolated from patients with UTI syndrome. Sci. Rep. 10, 1–14 (2020).
Seper, A. et al. Extracellular nucleases and extracellular DNA play important roles in Vibrio cholerae biofilm formation. Mol. Microbiol. 82, 1015–1037 (2011).
Baidamshina, D. R. et al. Targeting microbial biofilms using Ficin, a nonspecific plant protease. Sci. Rep. 7, 46068 (2017).
Wu, K. K. & Huan, Y. Streptozotocin-induced diabetic models in mice and rats. Curr. Protocols Pharmacol. Unit 5 (2008).
Rezvanian, M., Ng, S.-F., Alavi, T. & Ahmad, W. In-vivo evaluation of Alginate-Pectin hydrogel film loaded with Simvastatin for diabetic wound healing in Streptozotocin-induced diabetic rats. Int. J. Biol. Macromol. 171, 308–319 (2021).
Badr, G. et al. Bee venom accelerates wound healing in diabetic mice by suppressing activating transcription factor-3 (ATF-3) and inducible nitric oxide synthase (iNOS)-mediated oxidative stress and recruiting bone marrow-derived endothelial progenitor cells. J. Cell. Physiol. 231, 2159–2171 (2016).
Badr, G. Camel whey protein enhances diabetic wound healing in a streptozotocin-induced diabetic mouse model: the critical role of β-Defensin-1,-2 and-3. Lipids Health Dis. 12, 1–11 (2013).
Janssen, C. F., Maiello, P., Wright, M. J. Jr., Kracinovsky, K. B. & Newsome, J. T. Comparison of atipamezole with yohimbine for antagonism of xylazine in mice anesthetized with ketamine and xylazine. J. Am. Assoc. Lab. Anim. Sci. 56, 142–147 (2017).
Ritsu, M. et al. Critical role of tumor necrosis factor-α in the early process of wound healing in skin. J. Dermatol. Dermatol. Surg. 21, 14–19 (2017).
Hozzein, W. N. et al. Topical application of propolis enhances cutaneous wound healing by promoting TGF-beta/Smad-mediated collagen production in a streptozotocin-induced type I diabetic mouse model. Cell. Physiol. Biochem. 37, 940–954 (2015).
Badr, G. et al. Treatment of diabetic mice with undenatured whey protein accelerates the wound healing process by enhancing the expression of MIP-1α, MIP-2, KC, CX3CL1 and TGF-β in wounded tissue. BMC Immunol. 13, 1–9 (2012).
Hozzein, W. N. et al. Bee venom improves diabetic wound healing by protecting functional macrophages from apoptosis and enhancing Nrf2, Ang-1 and Tie-2 signaling. Mol. Immunol. 103, 322–335 (2018).
Ishida, Y., Gao, J.-L. & Murphy, P. M. Chemokine receptor CX3CR1 mediates skin wound healing by promoting macrophage and fibroblast accumulation and function. J. Immunol. 180, 569–579 (2008).
Badr, G. & Mohany, M. Maternal perinatal undernutrition attenuates T-cell function in adult male rat offspring. Cell. Physiol. Biochem. 27, 381–390 (2011).
Eltoum, I., Fredenburgh, J. & Grizzle, W. E. Advanced concepts in fixation: 1. Effects of fixation on immunohistochemistry, reversibility of fixation and recovery of proteins, nucleic acids, and other molecules from fixed and processed tissues. 2. Developmental methods of fixation. J. Histotechnol. 24, 201–210 (2001).
Ramadan, N. K., Badr, G., Abdel-Tawab, H. S., Ahmed, S. F. & Mahmoud, M. H. Camel whey protein enhances lymphocyte survival by modulating the expression of survivin, bim/bax, and cytochrome C and restores heat stress-mediated pathological alteration in lymphoid organs. Iran. J. Basic Med. Sci. 21, 896 (2018).
Acknowledgements
The author hereby acknowledges the Laboratory of Immunology, Faculty of Science, Assiut University for providing the facilities, antibodies, chemicals and support required to perform the practical work.
Funding
Open access funding provided by The Science, Technology & Innovation Funding Authority (STDF) in cooperation with The Egyptian Knowledge Bank (EKB).
Author information
Authors and Affiliations
Contributions
M.S., G.B., H.F.H., W.A.K., A.A.S. put the experimental design. M.S., W.A.K., H.F.H. performed the in vitro experiments on the pathogenic bacteria. W.A.K. investigated the diabetic foot ulcer patients, collected the clinical samples and isolated the pathogenic bacteria. M.S., G.B. performed all the experiments in the animal model, analyzed the data and drafted the manuscript; M.S., G.B., H.F.H., W.A.K., A.A.S. review and editing the manuscript. All authors have read and agreed to the published version of the manuscript.
Corresponding author
Ethics declarations
Competing interests
The authors declare no competing interests.
Additional information
Publisher's note
Springer Nature remains neutral with regard to jurisdictional claims in published maps and institutional affiliations.
Rights and permissions
Open Access This article is licensed under a Creative Commons Attribution 4.0 International License, which permits use, sharing, adaptation, distribution and reproduction in any medium or format, as long as you give appropriate credit to the original author(s) and the source, provide a link to the Creative Commons licence, and indicate if changes were made. The images or other third party material in this article are included in the article's Creative Commons licence, unless indicated otherwise in a credit line to the material. If material is not included in the article's Creative Commons licence and your intended use is not permitted by statutory regulation or exceeds the permitted use, you will need to obtain permission directly from the copyright holder. To view a copy of this licence, visit http://creativecommons.org/licenses/by/4.0/.
About this article

Cite this article
Salah, M., Badr, G., Hetta, H.F. et al. Fig latex inhibits the growth of pathogenic bacteria invading human diabetic wounds and accelerates wound closure in diabetic mice. Sci Rep 12, 21852 (2022). https://doi.org/10.1038/s41598-022-26338-0
Received:
Accepted:
Published:
DOI: https://doi.org/10.1038/s41598-022-26338-0
This article is cited by
Comments
By submitting a comment you agree to abide by our Terms and Community Guidelines. If you find something abusive or that does not comply with our terms or guidelines please flag it as inappropriate.
