
Abstract
Stable or growing populations may go extinct when their sizes cannot withstand large swings in temporal variation and stochastic forces. Hence, the minimum abundance threshold defining when populations can persist without human intervention forms a key conservation parameter. We identify this threshold for many populations of Caprinae, typically threatened species lacking demographic data. Doing so helps triage conservation and management actions for threatened or harvested populations. Methodologically, we used population projection matrices and simulations, with starting abundance, recruitment, and adult female survival predicting future abundance, growth rate (λ), and population trend. We incorporated mean demographic rates representative of Caprinae populations and corresponding variances from desert bighorn sheep (Ovis canadensis nelsoni), as a proxy for Caprinae sharing similar life histories. We found a population’s minimum abundance resulting in ≤ 0.01 chance of quasi-extinction (QE; population ≤ 5 adult females) in 10 years and ≤ 0.10 QE in 30 years as 50 adult females, or 70 were translocation (removals) pursued. Discovering the threshold required 3 demographic parameters. We show, however, that monitoring populations’ relationships to this threshold requires only abundance and recruitment data. This applied approach avoids the logistical and cost hurdles in measuring female survival, making assays of population persistence more practical.
Introduction
Worldwide, Caprinae populations receive much attention given their coveted trophy hunts and iconic symbolism for wild and remote places, yet many Caprinae populations are at risk of extinction1. For biologists to protect and restore Caprinae populations threatened with extinction, and manage populations not threatened, they often apply logistically difficult and sometimes controversial techniques such as harvest, predator control, and translocation. Appropriate execution of these techniques requires foundational information describing a Caprinae population’s chance of extinction, demographic weaknesses, and minimum abundance requirements.
Populations with demographic rates producing stable to growing populations may decline to extinction when their sizes cannot withstand large demographic swings from temporal variation and stochastic forces2. Therefore, understanding the minimum population size at which a population can persist without (or minimal) human intervention forms a key conservation parameter. For Caprinae, the minimum abundance target for adult females enables biologists to triage conservation actions across populations3. Conservation resources can focus on rebuilding threatened populations below the threshold, and non-threatened populations may be hunted or serve as sources for translocation. Relatedly, this metric assists threat evaluations, as populations above the minimum threshold are more resilient to local extinction events4.
We identify this minimum abundance threshold describing population persistence for Caprinae. Methodologically, we perform a population viability assessment (PVA; e.g.5,6), by developing a population projection matrix model to simulate population responses (population size and growth (λ) through time). We use matrix population models, as they form a conventional tool for predicting the growth of animal populations based on demographic parameters such as births, deaths, and age-structure7,8. The matrix approach is also commonly applied for identifying and assessing conservation strategies for endangered species9,10.
Although the 32 extant, autochthonous species of Caprinae have diverse behaviors, body sizes and inhabit different ecosystems, all females birth one offspring per year, by their second to third year (until death; twinning common in some species)1. We built our population viability model for Caprinae off these defining characteristics.
The urgency of conservation actions for most Caprinae populations far outpaces the rate of data collection1. Hence, the majority of Caprinae lack demographic information required to estimate population viability (e.g. mean and variability estimates of adult female survivorship and recruitment). We overcome the data deficiencies by simulating results using multiple combinations of starting abundances (varying from 10 to 250 adult females), mean recruitment (spanning 0–0.90) and adult female survivorship (0.50–0.98). Our simulations incorporated biological (temporal and environmental) variation and stochasticity, thereby quantifying uncertainties in future predictions. Estimating parameter variability relies on long-term datasets11, also nonexistent for most Caprinae1. Therefore, we quantified variation in recruitment and survivorship using data from prior field surveys and peer-reviewed literature on desert bighorn sheep (Ovis Canadensis nelsoni), as a proxy for other Caprinae.
The parameter values and combinations we employ correspond to empirical values reported from many different Caprinae populations. Indeed, estimating the minimum viable population (MVP) by evaluating a spectrum of biologically plausible values covers the differences in Caprinae social systems and environments influencing a given populations survival and recruitment values. We never assume that values for all Caprinae are similar, nor do we consider data from desert bighorn sheep representative for all Caprinae. We included model code and all simulation output, so any user can select demographic values of choice and examine the resulting changes in population persistence, or tailor an investigation to a specific population of interest.
Despite the copious literature defining minimum population sizes and building demographic simulations for a variety of species, prior studies rarely consider the practicality that managers require to inform on-the-ground work12. Such answers hinge on using data that managers can logistically acquire, affordably. Herein we implement this applied and practical approach.
We quantify and report the relationships between recruitment and adult female survival with population growth (λ), and therefore, the combinations of recruitment and survivorship required to attain a given λ, as recruitment and survival have most influence on Caprinae abundance13,14. Recruitment represents the number of offspring produced by reproductive females, each year, entering the yearling age class. Acquiring data describing recruitment is inexpensive and logistically simple. In contrast, survival data are usually derived from catching, marking (i.e., telemetry collars) and following adult females. The work is logistically challenging and expensive, making data describing survivorship scarce. It is also unlikely that biologists will acquire survivorship data for many Caprinae anytime soon. Therefore, while our simulations incorporate survivorship data, monitoring for the threshold abundance does not. Instead, we simplify results so biologists interested in determining when a population is secure from localized extinction can rely solely on accurate measures of abundance, abundance trend and recruitment.
Our results identify which demographic parameter generates the greatest impacts for increasing growth rate (λ) to recover an ailing population. We also show effects of translocation (adult female removals) on population abundance and trend of the source population, to identify populations sizes at which translocation is not detrimental. Lastly, we assess if survival or recruitment are useful for evaluating the efficacy of management actions, as the variability inherent to these parameters challenges such assessments.
For Caprinae managers, our results likely represent the sole information describing population projections and minimum abundance thresholds for the endangered Caprinae populations under their charge. For other wildlife and conservation practitioners, we exemplify a procedure for modeling population trajectories and identifying demographic thresholds for species with limited data.
Results
Demographic parameters
Wildlife agencies often produce lamb:adult female ratios (i.e. recruitment) from surveys. To quantify variability in recruitment, we analyzed recruitment data of desert bighorn sheep from three state agencies (USA): the Arizona Game and Fish Department (AZGFD), the California Department of Fish and Wildlife (CAFW), and the New Mexico Department of Game and Fish (NMDGF). The yearlings of Caprinae, of either sex, can be challenging to identify as their size and horn characteristics often mimic adult females. Agencies handle this situation differently. The CAFW and NMDGF report the number of yearling females identified but omit yearling males and unclassified yearlings. The AZGFD reports the number of male, female and unclassified yearlings. The NMDGF includes yearling females in the denominator of the lamb:ewe ratio but CAFW and AZGFD do not. Across the three states, the lamb:ewe ratios that omit yearlings from the denominator (L:E) and those that include yearlings in the denominator (L:EY) are generally similar (Table 1).
When yearlings counts are removed from the denominator of the L:E ratio, an unknown, incomplete and inconsistent fraction of yearlings are actually removed from each survey. For example, 46% of surveys for calculating L:E ratios from NMDGF (35 site/years) and 75% from CAFW (107 site/years) have ≤ 1 female yearling reported. In Arizona, 48% of surveys have ≤ 1 female yearling counted, 47% have ≤ 1 male yearling counted, 85% have ≤ 1 unclassified yearling counted, and 21% have ≤ 1 yearling counted in all three yearling categories (max of 3 total yearlings; 615 site/years). Across the 3 states, 38% of surveys recording ≥ 50 ewes do not report any female yearlings, and 70% report ≤ 5 female yearlings. The simplest (by avoiding misclassification issues) and most comprehensive (contains all yearling animals observed) correction is including yearlings in the recruitment ratio (lamb:(ewe + yearling); L:EY).
We estimated mean recruitment (L:EY) as 0.294 with a biological variance of 0.028 (n = 757; CV = 0.57). The mean and variance using the traditional L:E ratio (i.e., assumed exclusion of all yearlings from the denominator) was 0.33 and 0.033, respectively. Our subsequent analyses always used the biological variance with yearlings included in the ratio denominator.
The mean recruitment we employ aligns with values reported from other populations of Caprinae, and the variability in recruitment matches the reduced versions of variability we tested. For instance, populations of Dall’s sheep (O. dalli dalli) have lamb:(ewe + yearling) ratios ~ 0.30 with CVs exceeding 0.415. Mountain goats (Oreamnos americanus) have mean kid:(yearling + nanny) ratios of 0.33 and CV = 0.21 (calculated from Table 1 found in16). Punjab urial (Ovis vignei punjabiensis) can have mean lamb:ewe ratios of 0.44 with CV = 0.1817, and Astor markhor (Capra falconeri falconeri) have mean kid:(yearling + nanny) ratios of 0.32 and CV = 0.30 (number of females ≥ 20; N = 818). The variability in our recruitment data is likely higher than reported elsewhere for many other Caprinae populations, because our method accounts for inter-annual variability in the calculation (not calculating the mean variance).
We estimated the mean survival for adult female desert bighorn sheep as 0.82, with biological variance = 0.0127 (CV = 0.14; 31 site/years). This mean and variance in survivorship also corresponds with other Caprinae populations, such as Soay sheep (Ovis aries; mean = 0.87; CV = 0.15 [winter period]), mouflon (Ovis gmelini; mean = 0.84; CV = 0.13), and Dall’s sheep (mean = 0.88; CV = 0.11)13,19,20,21.
Simulations and minimum abundance of adult females
We quantified the probabilities of λ < 1 and quasi-extinction at year 10 and 30 (QE(10); QE(30)), with different combinations of mean adult female survival, mean recruitment, and starting abundance of adult females, with the variance values fixed (Fig. 1). To achieve a stable population (λ ~ 1.0), the lowest recruitment can become is 0.20, provided an adult female survival of 0.98 (deterministic λ = 1.01; Table 2; Fig. 1). Alternatively, recruitment could be as high as 0.45 with a corresponding survivorship of 0.75 (deterministic λ = 1.01; Table 2; Fig. 1).
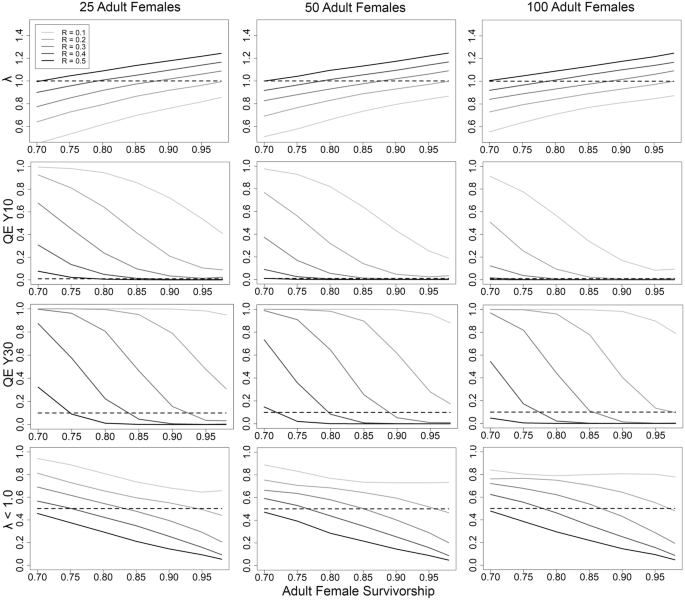
Relationships between recruitment (R), survival of adult females, starting adult female abundance, and population growth (λ; top row), the probability of quasi-extinction (QE; adult female abundance ≤ 5) at years 10 and 30 (middle rows) and the proportion of simulations resulting in mean λ < 1.0, based on 10,000 stochastic simulations of population trajectories. Dashed lines for QE(10) and QE(30) indicate the persistence threshold: 0.01 and 0.10 respectively.
The variability surrounding λ is high, with confidence levels often spanning ± 30% (Table 2). The likelihood of QE helps represent this variability. Acquiring QE(10) ≤ 0.01 with survivorship ≥ 0.85, requires a population of 25 adult females with recruitment ≥ 0.4, a population with 50 adult females with recruitment ≥ 0.3, and 100 adult females with recruitment approximately ≥ 0.2 (Fig. 1). A QE(30) ≤ 0.10 occurs with survivorship ≥ 0.80 and recruitment ≥ 0.4 with 50 adult females, and survivorship ≥ 0.85 and recruitment ≥ 0.3 with 100 adult females (Fig. 1).
We also examined variability by quantifying the proportion of scenario iterations resulting in λ < 1 (Fig. 1, Table 2). Starting abundance has relatively small effects on this probability (Fig. 1). Attaining a ≤ 25% chance of population decline (stochastic λ) requires combinations of recruitment and survivorship such as survivorship ≥ 0.95 and recruitment 0.30, survivorship ≥ 0.90 and recruitment 0.40, or survivorship ≥ 0.85 and recruitment 0.50 (Fig. 1). Attaining a ≤ 10% chance of population decline requires survivorship ≥ 0.95 and recruitment ≥ 0.50 (Fig. 1).
We determined the minimum abundance of adult females required for ensuring population persistence, when the population has demographic rates consistent with a stable to slightly growing population (stochastic λ ~ 1; Supplementary Data S1). Results focused on QE, because starting abundance strongly affects this probability. With 25 adult females, populations have QE(10) ranging 0.03–0.09 and QE(30) 0.16–0.31 (Table 2). A population of 50 adult females must have intermediate levels of recruitment (0.25–0.40) and survivorship (0.80–0.95) for QE(10) ≤ 0.01 and QE(30) ≤ 0.10 (Table 2). With a starting abundance of 100 adult females, a population has QE(10) < 0.01 and QE(30) ≤ 0.10 for all simulations. For all starting abundances, the risk of QE increases with high recruitment and low survival (and vice-versa; Table 2). Based on these results, a population of 50 adult females forms a reasonable target to ensure population persistence.
QE increases when populations exhibit modest decline, as when survivorship is 0.85 and recruitment 0.30, generating λ ~ 0.97. With λ in slight decline, the QE(10) risk for a population of 50 adult females remains nearly identical to simulations with λ ~ 1.0, yet QE(30) rises ~ 5 times (Tables 2, 3; Figs. 1, 2). A population of 100 adult females with λ ~ 0.97 has QE(30) 10 times larger than when λ ~ 1.00 (Tables 2, 3; Figs. 1, 2). With λ ~ 0.97, populations having a starting abundance of 60 or 70 adult females decline to 50 by year 8 and 16 respectively. Therefore, a population of 50 adult females remains a minimum threshold target, provided that frequent and accurate monitoring of abundance catches any decline.
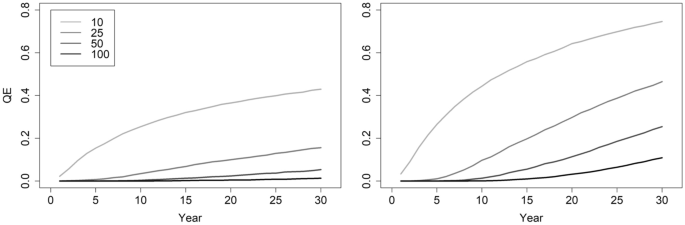
Plots portraying the probability of quasi-extinction (QE; mean abundance ≤ 5 adult females) of adult females based on 10,000 stochastic simulations of population trajectories. The left panel locks recruitment to 0.30 and survivorship at 0.90 (stochastic λ ~ 1.0) and the right panel has recruitment and survivorship at 0.30 and 0.85 respectively (stochastic λ ~ 0.97). Inset values indicate the starting abundances of adult females.
Biological variation influences the potential trajectories of population growth or decline. Higher variability means more alternative paths, so reductions in variability typically provide greater assurances in a population’s projection. We found that arbitrarily reducing biological variation by half for recruitment or adult female survival barely changed the resulting variability surrounding λ (Table 4). Nor does this reduction in variability substantially influence a population’s trajectory (Fig. 3). Keeping biological variance for one parameter and eliminating variance for the other, or halving biological variation for both parameters, reduces variability surrounding a stable λ to 20%, with little effect on population trajectories (Table 4; Fig. 3). Reducing variability by 90% or eliminating it for both parameters generated confidence intervals spanning ~ 10% around a stable λ (Table 4; Fig. 3). Without biological variance, a population of 50 adult females could decline to 40 or increase to 90 adult females by year 10 (Fig. 3). Increases in biological variation raise QE, but effects do not manifest at year 10 (QE(10) always 0), and QE(30) changes are minimal (Table 4).
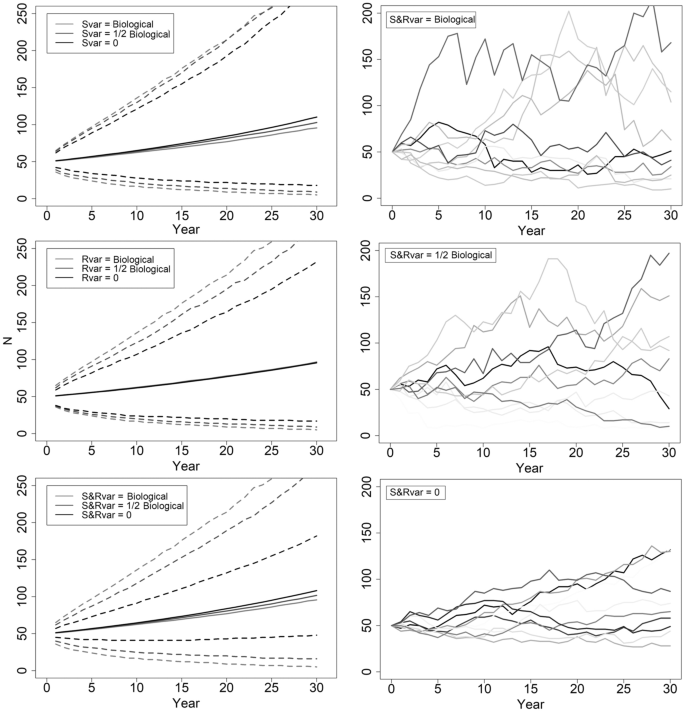
The effects of variability in adult female survivorship and recruitment parameters on the abundance estimates for adult females. Mean abundances are solid lines with dashed lines representing 90% confidence intervals. Upper left: Recruitment variance held at the biological value (0.028), and survivorship variance takes the biological value (0.0127), halved or eliminated. Middle left: Survivorship variance held at biological value, and recruitment variance takes the biological value, halved or eliminated. Bottom left: Variability of survivorship and recruitment vary from both biological, to half biological and variability in both removed. Right 3 panels: 10 randomized abundance simulations with the variability in survivorship (Svar) and recruitment (Rvar) biological, both half biological, and both removed (0). All scenarios have mean recruitment of 0.30 and mean survivorship of 0.90 (stochastic λ = 1.02).
Examination of demographic parameters
We determined the effects of temporal and geographical (across population) variability. Given 9–10 consecutive surveys, mean recruitment and biological variance were 0.30 and 0.028 (n = 11; CV = 0.56), matching results from all these recruitment data. Within a 5 year consecutive period, recruitment = 0.31 with variance = 0.021 (n = 24; CV = 0.48). For 3 year consecutive periods, the mean recruitment ratio = 0.29 with variance = 0.018 (n = 73; CV = 0.46). Reducing data duration lowered the recruitment variance. Mean values remained consistent.
We examined geographical variation in recruitment data (L:EY) with populations ≥ 20 adult females and ≥ 10 years (n = 32), generating a mean L:EY of 0.29. The mean and standard deviation of the variance on these data (i.e., average and standard deviation of the individual variance values) was 0.024 and 0.015, respectively. Hence, there is considerable variability in the variance of L:EY across populations.
Most survivorship data we use originated from desert bighorn sheep within the Peninsular Ranges of California spanning 4–5 years22, with CV = 0.14. CVs of survivorships from these populations span 0.10 through 0.19, and CVs for the first 3 years of data average 14% lower than the CV from all years (SD = 0.27). Variation in survivorship also appears geographical and temporal.
The magnitude of change in λ when recruitment shifts from 0.20 to 0.40 and survivorship remains fixed at 0.90 is 0.17. The magnitude of change in λ when survivorship moves from 0.75 to 0.95 and recruitment remains fixed at 0.30 is 0.17. Similar, additive changes in adult female survivorship and recruitment generated comparable results in λ.
Adult female translocation
Given a hypothetical removal of 5 adult females during each of 5 successive years (years 1–5), a population of 50 adult females declined to a mean low of 30 (90% CI 6–62) in year 5, and returned to 50 by year 27 (90% CI 0–173). The QE(10) is 0.05 and QE(30) 0.18, and the lower confidence interval for abundance hits 0 by year 18 (Fig. 4). Populations < 50 did not return to the initial abundance value within 30 years. A population must have a minimum starting abundance of 70 adult females to avoid the 90% lower confidence interval reaching 0. This population attained a low of 52 (90% CI 17–100) in year 5, and returned to 70 by year 17 (90% CI = 8–192; Fig. 4), with QE(10) 0.01 and QE(30) 0.07.
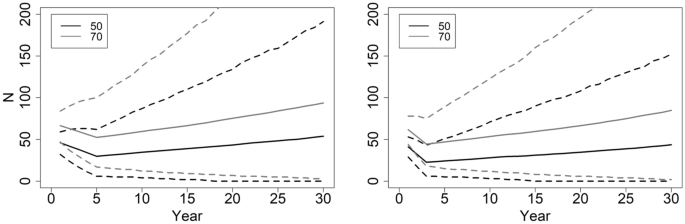
Abundance trajectories of adult females, with removals of 5 adult females during each of the first 5 consecutive years (left), and the removal of 10 adult females during each of the first 3 consecutive years (right). Mean abundances are solid lines with dashed lines representing 90% confidence intervals. Given these 5 or 10 removals, starting abundance must be ≥ 70 adult females for the population to return to a mean of 70 within 30 years without the lower confidence interval reaching 0. Inset values indicate the starting abundances of adult females.
A population of 50 adult females with 10 removals per year for 3 consecutive years, declined to 23 by year 4 (90% CI 6–47), and returned to 44 by year 30 (90% CI 0–152; Fig. 4). A population requires a starting abundance of 60 adult females to return to 60 by year 28, although the lower confidence interval reached 0 by year 24. Again, a population required a starting abundance of 70 adult females for the lower confidence interval to never attain 0. This hypothetical population reached a low of 46 (90% CI 17–82) in year 4, returned to 70 (90% CI 5–210) by year 22 (Fig. 4), with QE(10) 0.01 and QE(30) 0.08.
Discussion
Given Caprinae life history and plausible combinations of mean recruitment and adult female survivorship, we evaluated population persistence and estimated population MVP. The values describing adult female survivorship and recruitment, plus the variability we employed match values found in other populations of Caprinae. We do not pool data across different Caprinae populations or species. Our approach and results directly inform the conservation and management of many Caprinae, especially those for which the acquisition of demographic data remains beyond reach.
Our work embodies the characteristics of a high-quality PVA: clear objectives, appropriate demographic data, model structure matching species life histories, stochasticity, examination of extinction probability, appropriate time interval, use of mean values and associated variability6. As with most ecological models, the quest for more data remains problematic, not debilitating, and is addressed by creatively and aptly using existing information to generate meaningful results3.
Wildlife agencies generate lamb:adult female ratios from Caprinae surveys, recognizing that yearlings can be mistaken for adult females, causing miscounts. Excluding yearlings from the ratio’s denominator assumes that no miscounts are occurring, yet an unknown and inconsistent number of yearlings remain in the adult female category across survey events. For these reasons, surveyors of other species, like Dall’s sheep and caribou, pool counts of yearlings and adult females, generating lamb:“adult female-like” ratios instead15,23,24,25.
Managers of Caprinae populations can follow these precedents and produce lamb:(adult female + yearling) ratios. Consistency would help standardize methods for building comparisons and meta-analyses across populations of Caprinae, while reducing variability across surveys due to differing techniques.
Typically, metrics like elasticity (proportional) and sensitivity (additive) describe the influences of demographic parameters on population growth13,14,22,26. For Caprinae, when adult female survivorship is 0.90 and recruitment 0.30, the elasticity in survivorship and recruitment are 0.61 (90% CIs 0.40–0.75) and 0.24 (90% CIs 0.13–0.40) respectively (elasticity in young adult survivorship is 0.16 (90% CIs 0.12–0.21). For ungulates in general, the elasticity values for survival tend to be higher than those for recruitment27. Our results match this pattern, as the elasticity results indicate that a change in adult survival has a 2.5 times greater effect on λ than an equivalent change in recruitment. Relatedly, other theoretical work reports that demographic parameters with more temporal variability have lower elasticities, indicating less impact on population fitness (e.g.28,29).
Our work centers on applications. Since most management actions affect these demographic parameters simultaneously, at issue is the practicality (e.g. feasibility and affordability) of management to increase these parameters, and understanding how such changes could impact λ. For example, imagine a population with mean recruitment of 0.30 and adult survival 0.85, with a biologist interested in increasing recruitment or adult female survival to acquire λ ≥ 1. The answer is to increase either value by 0.02 (Fig. 1, Supplementary Data S1). Similarly, one can set a λ target and determine the amount of recruitment and adult female survival necessary for acquiring it (Fig. 1, Supplementary Data S1).
Minimum abundance target
A minimum population of 50 adult females meets the persistence criteria, given intermediate levels of recruitment and survival producing λ ~ 1 (Table 2). The risk of population collapse wanes as populations increase above the minimum threshold (Table 2; Fig. 1). For example, a population of ~ 100 adult females always meets persistence criteria (Table 2). Populations of adult females should be somewhat larger than 50 when modest declines (λ ~ 0.97) are suspected, providing a cushion to address the causes of decline, and mitigate further reductions.
Translocation of 5 adult females during each of 5 years, or 10 in each of 3 years, requires a starting abundance of 70 adult females for the population to maintain the persistence criteria, never reach a lower confidence interval of 0, and for the population to return to the starting population size within 30 years. If managers mistakenly target a population having < 50 adult females, the population mean is unlikely to recover to pre-removal levels within 30 years (Fig. 4). The more adult females removed per year will reduce a populations abundance and elevate stochastic effects.
Applications
These survival and recruitment parameters have high temporal and geographical variability. This uncertainty originates from the variability inherent to survivorship and recruitment data within Caprinae populations and demographic stochasticity operating over all age classes, making it difficult to predict exact values of λ and project abundances (Fig. 3). The causes of such variability are complex (e.g. factors such as variation in environmental drivers, predation, management types and timing, the distribution of female reproduction across populations and ages through time), and are rarely monitored. Without data, these factors cannot be explicitly examined. The effects of these factors, however, are contained in the empirically-derived estimates for survival and recruitment, and their associated variability.
We examined the effects of time and management actions on reducing variation in recruitment and adult female survivorship. We began by halving the variance in recruitment, given its empirical basis. For all recruitment data, when the temporal window is short (3 years), recruitment variability declined to nearly half the overall mean variability. Also, the NMDGF operate a fenced facility (6.2 km2) for desert bighorn sheep, to translocate surplus animals elsewhere. These sheep remain wild, yet receive year-round water and rare predation events. This population has biological variance in recruitment approximately half that of the variance of other populations of desert bighorn in the southwest U.S. (variance = 0.015). The mean recruitment value (L:EY) recorded within this facility (0.56; N = 18 years; CV = 0.22) is nearly double the amount of recruitment calculated from the other populations of desert bighorn sheep.
For survival, most of these data represented desert bighorn sheep populations whose abundance were declining (disease, predation, habitat loss22). Survivorship of adult females in endangered or declining populations of ungulates could be lower or more variable than in demographically viable populations30,31,32.
Management actions can reduce variation in recruitment and survival. However, the simulations halving variance in recruitment or survival received minimal increases in precision in λ or abundance (Table 4; Fig. 3). Halving variability in adult female survivorship and recruitment, or eliminating it, moved the probability of λ < 1 to 0.39 and 0.31 (from 0.41) while reducing QE(30) from 0.05 to 0.01 and 0 respectively (Table 4). Therefore, in application, halving variance in recruitment (i.e., calculated from predator-free populations) and survival (i.e., from predator control) does not generate much change in population trajectories.
Management actions can also change the mean values of demographic parameters. For instance, populations of grazing mammals lacking predation have higher growth rates with less variability33. Therefore, when populations experience predation, predator control can improve population sizes of Caprinae by raising the survival of adult females and recruitment12,34,35. Survival of adult females can increase 5–12% with predator control, and survival with predation is often twice as variable as populations without predation12. Imagine predator control boosted mean adult female survival from 0.90 to 0.9512 and recruitment from 0.30 to 0.50 (similar to the NM penned facility), while reducing the survival and recruitment variance by half (12; NM penned facility). Population growth would increase 20%, from λ = 1.02 to 1.22. Mean abundance would climb from 56 adult females to 135 by year 5.
Predators are important components of ecosystem health36,37, so predator management requires conscientious approaches. Predator control (or perhaps reduction in conspecific, alternative prey) could be applied to improve Caprinae populations with < 50 adult females. Larger populations should withstand background levels of predation, when stable or growing. Curbing declines in larger populations, or attaining targets in population growth or abundances could also warrant predator control, to accomplish management objectives. Monitoring the abundance and recruitment of Caprinae populations helps identify conditions suggesting management actions like predator control, while indicating when the desired project objectives are achieved (i.e. Caprinae population responses). Factors like environment, climate and disease influence population abundance too, and are worth considering during such monitoring38.
Provision of supplemental water can increase the distributions of Caprinae39,40. Supplemental water, however, could increase predator distributions (directly or indirectly), potentially aggravating predation issues affecting adult female survival and recruitment41,42. Other hypotheses, like temporal reductions in water supplementation, may also reduce predator presence within Caprinae ranges43,44. Alternative management tools for improving Caprinae abundances are supplemental feeding and disease control, challenging and costly to pursue at large scales.
The variability in adult female survival and recruitment means that 1 year’s recruitment or survival cannot accurately predict the next, and historical trends in population abundance may have little bearing on future performance (Fig. 3). Revealing management contributions to population growth is also challenged by the variability inherent within the demographics of Caprinae populations. This situation makes Caprinae management reactive, with management decisions based on the short-term monitoring results for a population. The repeated acquisition of accurate abundance data, however, builds a more proactive paradigm.
Monitoring Caprinae
Population vital rates and their importance to population growth often varies across populations and within a population over time (our results31,32,45,46). Indeed, within and across populations of Caprinae, the annual differences in survival and recruitment are substantial47,48. Some temporal and geographical variation is biological, and some stems from the use of different methodologies for quantifying variability. Hence, analytical projections of future abundance based on survival and recruitment data from one population are unlikely to apply to other populations for the same or different species. Understanding a given populations status requires directly monitoring that population.
Frequent monitoring of many populations requires simple and affordable methods for identifying a population’s status (abundance, growth). We discovered the threshold of 50 adult females with three types of demographic parameters: abundance, survival and recruitment. Monitoring the threshold is achievable with two of them.
Adult female survival is the most challenging and costly parameter to acquire, unattainable for most biologists managing Caprinae populations. Indeed, we struggled to locate data describing adult female survival given a species extensively studied. Future monitoring and analyses, therefore, do not require survival data, but can rely solely on measures of abundance and recruitment.
Minimum counts are the primary method for monitoring Caprinae species. This method is appropriate if precision measurements are not required and acknowledgement that data are biased low. With minimum counts, management actions dependent upon abundance triggers (i.e., 50 adult females) would be identified early, providing a conservative approach to population management. In the short term, populations can be prioritized for conservation using minimum abundances, but these data make it difficult to generate longer-term conclusions about population sustainability.
When minimum counts or mean abundance estimates for adult females are well above 50 (i.e. ~ ≥ 75), the population is likely to persist (unless conditions change). When populations occur at or near the threshold value, recruitment estimates associated with these abundance estimates (and trends) help biologists infer if the population is stable or growing, and if the minimum abundance threshold were reached. For example, imagine a population with known abundance of 70 adult females. A survey was conducted, producing an estimate of 65 adult females (90% CI 44–86 (20% CV)), with a recruitment estimate (Lamb:(adult female + yearling)) > 0.30. Trends in abundance from prior surveys indicate an increase. A reasonable interpretation of these data is that the population is likely at or above the threshold and growing.
We used abundance trends because of the high variability in recruitment trends (demonstrated herein). If either abundance, abundance trend or recruitment shows a concerning decline, it should initiate work to discern the cause, as the population may no longer be sustainable.
While the acquisition of accurate abundance data can be challenging48,49,50, researchers have posed tenable solutions for meeting these challenges50,51. These methods rely on methodological changes in aerial surveys, or replacing aerial surveys with motion activated cameras, that collaterally identify predators and their relative abundances.
For annually-reproducing Caprinae that begin reproduction in their second to third year, the minimum abundance threshold of 50 adult females should apply. Source populations for translocation have a 70 adult female abundance threshold, assuming translocations of 5 or 10 adult females per year, in each of 5 and 3 years respectively. For Caprinae with different life histories, our model code is easily modified to accommodate those changes.
Hence, our work extends beyond Caprinae. The population projection matrix model we developed can be applied to any species reproducing on an annual cycle. Users specify parameters such as the number of stage-classes, mean and variance of recruitment and adult survival, starting population size, correlation between recruitment and survival, sex-ratio at recruitment, and number of translocations (Supplementary Data S1). As exemplified herein, results will identify a population's’minimum threshold for persistence, which subsequently informs threat assessments, harvest quotas and the triage of conservation activities aimed at recovering ailing populations.
Methods
Our matrix model simulated population trajectories given various combinations of starting abundances, recruitment, adult female survival values, and translocation scenarios (Fig. 5). We predicted population growth, adult female abundance and determined extinction and quasi-extinction (QE) probabilities through time. We defined extinction when abundance = 0 adult females, and QE when abundance ≤ 5 adult females. Results from these simulations enabled us to identify a minimum target abundance of Caprinae to ensure population persistence4. We defined persistence as a population with ≤ 0.01 chance of QE in 10 years and ≤ 0.10 chance of QE in 30 years.
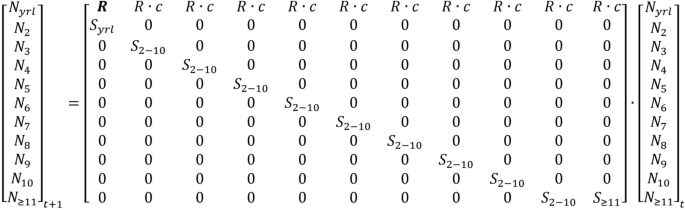
Population projection matrix used for simulating Caprinae population growth and the abundance of adult females. The first recruitment entry (bold R) is a necessary computational step to correctly represent reproduction, and account for the observer misclassifications of yearling male and females as adult females. Symbols indicate the following: R = recruitment, S = adult female survivorship, c = 0.5 (sex ratio), N = Age class.
Demographic parameters
We examined peer-reviewed publications by searching “Google Scholar” for mean recruitment and survival parameters reported for Caprinae species, to ensure that model parameters correspond with data representing a diversity of Caprinae. Our searches covered all years, and included ≥ 1of the following keywords: Abundance, Ammotragus, argali, Capra, Capricornus, Caprinae, Caprini, chamois, goat, goral, ibex, mouflon, Naemorhedus, Oreamnos, Ovibovini, Ovis, recruitment, Rupicapra, Rupicraprini, serow, sheep, survival, survivorship, takin, tur, urial. The simulations and analyses also required an accurate measure of biological variance in Caprinae recruitment and adult female survival to ensure that robust measures of variability accompanied the resulting predictions. Recruitment and survivorship surveys often differ in their methodology (e.g. aerial, ground counts, telemetry), timing and duration. To ensure a robust understanding of the variability in recruitment and survivorship data entering the simulations, we avoided arbitrarily selecting values from the literature. Instead, we calculated the variability in these parameters from data representing desert bighorn sheep. We compared the variability values gained from our calculations to those presented for other Caprinae to ensure relevance and transferability in results.
We found few publications describing ewe survival for Caprinae. Therefore, to compute variability, we relied on survival data for desert bighorn sheep from three publications with studies spanning multiple, sequential years22,52,53. To calculate variability in recruitment, we acquired recruitment data on desert bighorn sheep from three state agencies: Arizona Game and Fish Department (AZGFD; 1958–2008; 90 locations), California Department of Fish and Wildlife (CDFW; 1991–2010; 13 locations), and New Mexico Department of Game and Fish (NMDGF; 1979–2016; 6 locations). Most Caprinae bear one young per year (periodic twinning can occur; an outcome more common in some species), with females reproducing during their second or third year until death1. Desert bighorn sheep share these characteristics. We estimated the biological variance (i.e., the component of variance due to temporal and environmental variation) of survival and recruitment by using the variance discounting procedures which removes the sampling variation54.
Population dynamics
The stage-structured population projection matrix model used 11 age-based categories (Fig. 5). Our models used age-class delineations corresponding to a post-breeding census. We considered lambs (or kids) < 0.5 years, yearlings as ages ≥ 0.5 and < 1.5 years, and adult females as ≥ 1.5 and ≤ 12.5 years (herein, the term “lamb” is also interchangeable for “kid”, when the sentence is used in context for Caprinae species). We set yearling survivorship as 10% lower than adult female survivorship, a reduction based on prior work with bighorn sheep55. We considered prime aged animals ages 2–10 years, with survival equivalent across these age classes55,56. Older females (≥ 11.5) received a 0.43 proportional reduction in survival from adult female survival (calculated from life history table56). We set the amount of variation in yearling and older female survival to equal the variation in adult survival.
We integrated demographic stochasticity (inherent randomness that arises from the discrete nature of individual animals57) and biological variation into the simulation. Biological variation was derived from the empirical recruitment and survival data. For each year and iteration, we randomly selected adult female survival and lamb recruitment using the incomplete beta function, which allows for correlated vital rates58. We assumed the vital rates were correlated at 0.40 (calculated from22). We used the first and second moments to calculate the scale and shape parameters of the beta distribution58,59. We assumed a 50 male:50 female sex ratio of recruited lambs, normally distributed with a variance of 0.0160. We incorporated demographic stochasticity as a binomial random variable through the random generation of survivors and recruits. The number of trials (n) matched the number of individual adult females in a given stage, with the parameter p of the binomial distribution a random variable simulated from the beta distribution.
Our simulations used combinations of mean survival and recruitment values to estimate population growth (λ). We allowed mean survival to range from 0.70 to 0.98, mean recruitment from 0.05 to 0.90 (to account for scenarios with and without twinning) and starting abundance from 10 to 250 adult females. Biological variance remained fixed to empirical values. We explored the effects of biological variation on population dynamics in subsequent simulations by artificially halving and eliminating the recruitment and survivorship variances. We also identified how changes in survivorship and recruitment affected λ.
While multiple factors affect the mortality of adult females (e.g. predation, starvation, disease), declines in abundance also occurs when adult females are translocated from a source population to another population. Translocations of adult females should be an acceptable practice, provided the source population does not encumber a high risk of QE resulting from removals. When desert bighorn sheep are translocated from a population, it is common for managers to pursue sequential years of removals. Therefore, we examined the effects of adult female removals on population stability by examining two translocation scenarios: removing 5 adult females consecutively for 5 years (25 total removals) and removing 10 adult females over 3 consecutive years (30 total removals). These translocation simulations fixed recruitment and survival parameters to generate a stochastic λ = 1.02 (recruitment = 0.30, survivorship = 0.90, with biological variability), as populations with λ ≤ 1.00 would not recover from the translocation event.
Simulations estimated abundance and λ for each combination of survival and recruitment, every year, for 30 years, with 10,000 individual iterations. We tested model operation to ensure results replicated the values of mean recruitment, mean survival and their respective variability. For each simulation we determined extinction and QE each year.
Data describing lamb:adult female ratios typically represent recruitment, a combination of adult female fecundity and lamb survival. Lambs are born in spring and surviving lambs are counted and considered recruited during fall surveys (~ 6 months post-birthing). Our model relies on recruitment ratios, as these data are routinely collected by Caprinae biologists. For Caprinae, age-specific recruitment data are rarely (if ever) recorded during population monitoring. The variability in the lamb:ewe data accounts for any differences in reproduction across age classes through time and across populations.
Management agencies report lamb:adult female ratios differently, with some agencies including or excluding yearlings in the ratio denominator. We examined these lamb:adult female data, finding that yearlings (of both sexes) were often misclassified as adult females. This outcome is not unusual, as surveys for other species often misclassify yearling male and females as adult females25. Grouping yearlings and adult females into a ratio of lamb:‘adult female-like’ is also a common solution, for representing recruitment in Caprinae and other ungulates15,24,61. Therefore, we employed lamb:‘adult female-like’ ratios in the simulations.
Mathematically, we adjusted the population projection matrix to account for the low bias in recruitment, occurring from the inclusion of yearling males and females in the denominator of the ratio. This simple adjustment multiplied the recruitment ratio by 2 in the first column of the matrix (bold R representing the first age category; Fig. 5; Supplementary Data S1). To explain, imagine a hypothetical population consisting of 80 adult females (E) producing 30 lambs (L), with 10 male and 10 female yearlings (YM and YF respectively). The conventional lamb:adult female ratio (L:E) is 0.375. An unknown number of yearlings, however, are misclassified as adult females. When all yearlings are included in the denominator of the lamb:adult female ratio (L:(E + YM + YF)) the recruitment ratio is biased low (0.30). The traditional matrix would only include R in the 2nd–11th column of the matrix (the bold R omitted in the matrix within Fig. 5), which would produce 24 lambs (80 × 0.30 = 24). Yet we know from the example, that 30 lambs were produced. Alternatively, if R occurred in all columns of the matrix, the result is 27 lambs (80 × 0.30 + 10 × 0.30 = 27) and lamb production remains biased low. This problem arises because male and female yearlings are not reliably distinguished. To correct this problem, we multiplied R by 2 in the first column (80 × 0.30 + 10 × 2 × 0.30 = 30), which accounts for yearling males. The 30 lambs includes both sexes, and since our simulation represents adult females, R is multiplied by the lamb sex ratio (c = 0.5).
Data availability
Program and sample data to run analyses are included.
References
Shackleton, D. M. (ed.) and the IUCN/SSC Capriane Specialist Group. Wild Sheep and Goats and Their Relatives. Status Survey and Conservation Action Plan for Caprinae (IUCN, 1997).
Ovaskainen, O. & Meerson, B. Stochastic models of population extinction. Trends Ecol. Evol. 25(11), 643–652 (2010).
Burgman, M. & Possingham, H. Population viability analysis for conservation: The good, the bad and the undescribed. In Genetics, Demography and Viability of Fragmented Populations (eds Young, A. G. & Clarke, G. M.) 97–112 (Cambridge University Press, 2000).
Pe’er, G. et al. A protocol for better design, application, and communication of population viability analyses. Conserv. Biol. 27(4), 644–656 (2013).
Ralls, K., Beissinger, S. R. & Cochrane, J. F. Guidelines for using population viability analysis in endangered-species management. In Population Viability Analysis (eds Beissinger, S. R. & McCullough, D. R.) 521–550 (University of Chicago Press, 2002).
Chaudhary, V. & Oli, M. K. A critical appraisal of population viability analysis. Conserv. Biol. 34(1), 26–40 (2020).
Caswell, H. Matrix Population Models Vol. 1 (Sinauer Associates, Sunderland, 2000).
Mills, L. S. Conservation of Wildlife Populations: Demography, Genetics, and Management (Blackwell Publishing, 2007).
Grenier, M. B., McDonald, D. B. & Buskirk, S. W. Rapid population growth of a critically endangered carnivore. Science 317(5839), 779–779 (2007).
Enneson, J. J. & Litzgus, J. D. Using long-term data and a stage-classified matrix to assess conservation strategies for an endangered turtle (Clemmys guttata). Biol. Conserv. 141(6), 1560–1568 (2008).
Beissinger, S. R. & Westphal, M. I. On the use of demographic models of population viability in endangered species management. J. Wildl. Manag. 63(3), 821–841 (1998).
Festa-Bianchet, M., Coulson, T., Gaillard, J. M., Hogg, J. T. & Pelletier, F. Stochastic predation events and population persistence in bighorn sheep. Proc. R. Soc. B Biol. Sci. 273(1593), 1537–1543 (2006).
Gaillard, J. M., Festa-Bianchet, M. & Yoccoz, N. G. Population dynamics of large herbivores: Variable recruitment with constant adult survival. Trends Ecol. Evol. 13(2), 58–63 (1998).
Gaillard, J.-M., Festa-Bianchet, M., Yoccoz, N. G., Loison, A. & Toïgo, C. Temporal variation in fitness components and population dynamics of large herbivores. Annu. Rev. Ecol. Syst. 31, 367–393 (2000).
Rattenbury, K. L. et al. Delayed spring onset drives declines in abundance and recruitment in a mountain ungulate. Ecosphere 9(11), e02513 (2018).
Festa-Bianchet, M., Urquhart, M. & Smith, K. G. Mountain goat recruitment: Kid production and survival to breeding age. Can. J. Zool. 72(1), 22–27 (1994).
Awan, G. A., Festa-Bianchet, M. & Ahmad, T. Poaching, recruitment and conservation of Punjab urial Ovis vignei punjabiensis. Wildl. Biol. 12(4), 443–444 (2006).
Haider, J., Rakha, B. A., Anwar, M., Khan, M. Z. & Ali, H. An updated population status of Astor Markhor (Capra falconeri falconeri) in Gilgit-Baltistan, Pakistan. Glob. Ecol. Conserv. 27, e01555 (2021).
Clutton-Brock, T. H., Price, O. F., Albon, S. D. & Jewell, P. A. Early development and population fluctuations in Soay sheep. J. Anim. Ecol. 61, 381–396 (1992).
Cransac, N., Hewison, A. J. M., Maublanc, M. L., Gaillard, J. M. & Cugnasse, J. M. Patterns of mouflon (Ovis gmelini) survival under moderate environmental conditions: Effects of sex, age, and epizootics. Can. J. Zool. 75(11), 1867–1875 (1997).
Hoefs, M. & Bayer, M. Demographic characteristics of an unhunted Dall’s sheep (Ovis dalli dalli) population in southwest Yukon, Canada. Can J. Zool. 61(6), 1346–1357 (1983).
Rubin, E. S., Boyce, W. M. & Caswell-Chen, E. P. Modeling demographic processes in an endangered population of bighorn sheep. J. Wildl. Manag. 66, 796–810 (2002).
DeCesare, N. J. et al. Estimating ungulate recruitment and growth rates using age ratios. J. Wildl. Manag. 76(1), 144–153 (2012).
van de Kerk, M., Verbyla, D., Nolin, A. W., Sivy, K. J. & Prugh, L. R. Range-wide variation in the effect of spring snow phenology on Dall’s sheep population dynamics. Environ. Res. Lett. 13(7), 075008 (2018).
Smith, B. L. & McDonald, T. L. Criteria to improve age classification of antlerless elk. Wildl. Soc. Bull. 30, 200–207 (2002).
De Kroon, H., Van Groenendael, J. & Ehrlén, J. Elasticities: A review of methods and model limitations. Ecology 81(3), 607–618 (2000).
Heppell, S. S., Caswell, H. & Crowder, L. B. Life histories and elasticity patterns: Perturbation analysis for species with minimal demographic data. Ecology 81(3), 654–665 (2000).
Pfister, C. A. Patterns of variance in stage-structured populations: Evolutionary predictions and ecological implications. Proc. Natl. Acad. Sci. 95(1), 213–218 (1998).
Hilde, C. H. et al. The demographic buffering hypothesis: Evidence and challenges. Trends Ecol. Evol. 35(6), 523–538 (2020).
Owen-Smith, N. & Mason, D. R. Comparative changes in adult vs. juvenile survival affecting population trends of African ungulates. J. Anim. Ecol. 74(4), 762–773 (2005).
Nilsen, E. B. et al. A slow life in hell or a fast life in heaven: Demographic analyses of contrasting roe deer populations. J. Anim. Ecol. 78(3), 585–594 (2009).
Johnson, H. E., Mills, L. S., Stephenson, T. R. & Wehausen, J. D. Population-specific vital rate contributions influence management of an endangered ungulate. Ecol. Appl. 20(6), 1753–1765 (2010).
Van Houtan, K. S., Halley, J. M., Van Aarde, R. & Pimm, S. L. Achieving success with small, translocated mammal populations. Conserv. Lett. 2(6), 254–262 (2009).
Ballard, W. B., Whitman, J. S. & Reed, D. J. Population dynamics of moose in south-central Alaska. Wildl. Monogr. 114, 3–49 (1991).
Rominger, E. M. The Gordian knot of mountain lion predation and bighorn sheep. J. Wildl. Manag. 82(1), 19–31 (2018).
Sinclair, A. R. E., Mduma, S. & Brashares, J. S. Patterns of predation in a diverse predator–prey system. Nature 425(6955), 288–290 (2003).
Beschta, R. L. & Ripple, W. J. Large predators and trophic cascades in terrestrial ecosystems of the western United States. Biol. Conserv. 142(11), 2401–2414 (2009).
Sæther, B. E. Environmental stochasticity and population dynamics of large herbivores: A search for mechanisms. Trends Ecol. Evol. 12(4), 143–149 (1997).
Krausman, P. R., Leopold, B. D., Seegmiller, R. F. & Torres, S. G. Relationships between desert bighorn sheep and habitat in western Arizona. Wildl. Monogr. 102, 3–66 (1989).
Krausman, P. R., Rosenstock, S. S. & Cain, J. W. III. Developed waters for wildlife: Science, perception, values, and controversy. Wildl. Soc. Bull. 34(3), 563–569 (2006).
Harrington, R. et al. Establishing the causes of the roan antelope decline in the Kruger National Park, South Africa. Biol. Conserv. 90, 69–78 (1999).
Owen-Smith, N. Ecological guidelines for waterpoints in extensive protected areas. S. Afr. J. Wildl. Res. 26(4), 107–112 (1996).
Harris, G., Sanderson, J. G., Erz, J., Lehnen, S. E. & Butler, M. J. Weather and prey predict mammals’ visitation to water. PLoS One 10(11), e0141355 (2015).
Harris, G. M. et al. Year-round water management for desert bighorn sheep corresponds with visits by predators not bighorn sheep. PLoS One 15(11), e0241131 (2020).
Albon, S. D. et al. Temporal changes in key factors and key age groups influencing the population dynamics of female red deer. J. Anim. Ecol. 69(6), 1099–1110 (2000).
Morrison, S. F. & Hik, D. S. Demographic analysis of a declining pika Ochotona collaris population: Linking survival to broad-scale climate patterns via spring snowmelt patterns. J. Anim. Ecol. 76(5), 899–907 (2007).
Côté, S. D., Festa-Bianchet, M. & Smith, K. G. Compensatory reproduction in harvested mountain goat populations: A word of caution. Wildl. Soc. Bull. 29(2), 726–730 (2001).
Hamel, S., Côté, S. D., Smith, K. G. & Festa-Bianchet, M. Population dynamics and harvest potential of mountain goat herds in Alberta. J. Widl. Manag. 70(4), 1044–1053 (2006).
Gonzalez-Voyer, A., Festa-Bianchet, M. & Smith, K. G. Efficiency of aerial surveys of mountain goats. Wildl. Soc. Bull. 29, 140–144 (2001).
Conroy, M. J., Harris, G., Stewart, D. R. & Butler, M. J. Evaluation of desert bighorn sheep abundance surveys, southwestern Arizona, USA. J. Wildl. Manag. 82(6), 1149–1160 (2018).
Harris, G. M., Butler, M. J., Stewart, D. R., Rominger, E. M. & Ruhl, C. Q. Accurate population estimation of Caprinae using camera traps and distance sampling. Sci. Rep. 10(1), 1–7 (2020).
Cunningham, S. C. & DeVos, J. C. Mortality of mountain sheep in the Black Canyon area of northwest Arizona. Des. Bighorn. C. Trans. 36, 27–29 (1992).
Overstreet, M. W. Body condition and survival of desert bighorn sheep in relation to habitat and precipitation on the Kofa National Wildlife Refuge, Arizona (Doctoral dissertation, New Mexico State University, 2014).
White, G. C. Population viability analysis: Data requirements and essential analyses. In Research Techniques in Animal Ecology: Controversies and Consequences (eds Boitani, L. & Fuller, T. K.) 288–331 (Columbia University Press, 2000).
Jorgenson, J. T., Festa-Bianchet, M., Gaillard, J. M. & Wishart, W. D. Effects of age, sex, disease, and density on survival of bighorn sheep. Ecology 78(4), 1019–1032 (1997).
Hansen, C. G. Bighorn sheep populations of the Desert Game Range. J. Wildl. Manag. 31, 693–706 (1967).
Boettiger, C. From noise to knowledge: How randomness generates novel phenomena and reveals information. Ecol. Lett. 21, 1255–1267 (2018).
Morris, W. F. & Doak, D. F. Quantitative Conservation Biology: Theory and Practice of Population Viability Analysis (Sinauer Associates, 2002).
Casella, G. & Berger, R. L. Statistical Inference (Cengage Learning, 2002).
DeVore, R. M., Butler, M. J., Wallace, M. C. & Liley, S. G. Population dynamics model to inform harvest management of a small elk herd in central New Mexico. J. Wildl. Manag. 9, 531–544 (2018).
Hayes, R. D. et al. Experimental reduction of wolves in the Yukon: Ungulate responses and management implications. Wildl. Monogr. 152, 1–35 (2003).
Acknowledgements
We thank E. Rominger and J. Gedir for project ideas and assistance, and AZGFD, NMDGF and CAFW for data. Reviews by M. Conroy, E. Goldstein and two anonymous reviewers improved an earlier draft of this manuscript. The findings and conclusions in this article are those of the author(s) and do not necessarily represent the views of the U.S. Fish and Wildlife Service. Any use of trade, firm, or product names is for descriptive purposes only and does not imply endorsement by the U.S. Government.
Author information
Authors and Affiliations
Contributions
G.M.H. made substantial contributions to the conception and design of the work, the acquisition, analysis, and interpretation of data, plus manuscript writing. M.J.B. made substantial contributions to the conception and design of the work, the acquisition, analysis, and interpretation of data, plus manuscript writing. D.R.S. made substantial contributions to the conception and design of the work, the acquisition, analysis, and interpretation of data, plus manuscript writing. J.W.C. made substantial contributions to the conception and design of the work, the acquisition, analysis, and interpretation of data, plus manuscript writing.
Corresponding author
Ethics declarations
Competing interests
The authors declare no competing interests.
Additional information
Publisher's note
Springer Nature remains neutral with regard to jurisdictional claims in published maps and institutional affiliations.
Supplementary Information
Rights and permissions
Open Access This article is licensed under a Creative Commons Attribution 4.0 International License, which permits use, sharing, adaptation, distribution and reproduction in any medium or format, as long as you give appropriate credit to the original author(s) and the source, provide a link to the Creative Commons licence, and indicate if changes were made. The images or other third party material in this article are included in the article's Creative Commons licence, unless indicated otherwise in a credit line to the material. If material is not included in the article's Creative Commons licence and your intended use is not permitted by statutory regulation or exceeds the permitted use, you will need to obtain permission directly from the copyright holder. To view a copy of this licence, visit http://creativecommons.org/licenses/by/4.0/.
About this article

Cite this article
Harris, G.M., Butler, M.J., Stewart, D.R. et al. The abundance and persistence of Caprinae populations. Sci Rep 12, 13807 (2022). https://doi.org/10.1038/s41598-022-17963-w
Received:
Accepted:
Published:
DOI: https://doi.org/10.1038/s41598-022-17963-w
Comments
By submitting a comment you agree to abide by our Terms and Community Guidelines. If you find something abusive or that does not comply with our terms or guidelines please flag it as inappropriate.
