
Abstract
In the present study, titanium oxide (TiO2) nanoparticles, chitosan, and several nanocomposites containing different mass dosages of TiO2 and chitosan have been applied as the adsorbent for COD removal from the industrial wastewater (Bouali Sina Petrochemical Company, Iran). The FESEM, XRD, and FTIR tests have been employed to characterize TiO2 nanoparticles, chitosan, and fabricated nanocomposites. Then, the effect of adsorption parameters, including TiO2–chitosan mass ratio (1:1, 1:2, and 2:1), adsorbent content (0.25–2.5 g), temperature (20–50 °C), pH (3–11), solution volume (100–500 mL), and contact time (30–180 min) on the COD reduction has also been monitored both experimentally and numerically. The Box–Behnken design of the experiment approves that TiO2–chitosan (1:1), adsorbent content of 2.5 g, temperature = 20 °C, pH 7.4, solution volume of 100 mL, and contact time = 180 min are the condition that maximizes the COD removal (i.e., 94.5%). Moreover, the Redlich–Peterson and Pseudo-second order models are the best isotherm and kinetic scenarios to describe COD removal’s transient and equilibrium behaviors. The maximum monolayer COD adsorption capacity of the TiO2–chitosan nanocomposite is 89.5 mg g−1. The results revealed that the industrial wastewater COD is better to remove using the TiO2–chitosan (1:1) at temperature = 20 °C.
Introduction
The amount of oxygen required to oxidize organic pollutants in wastewater is defined as either COD (chemical oxygen demand) or BOD (biological oxygen demand)1. It is possible to employ chemical2, physical2, and biological3 scenarios, such as adsorption4,5, nano-adsorption6, membrane7, ion exchange, electrocoagulation8, bio-flocculation9, sewage sludge10,11, and filtration12,13 for the treatment of waste streams. Indeed, those separation processes that utilize the solid porous materials (i.e., adsorption) are among the most popular techniques due to their economic/operational features and a high achievable removal efficiency14,15,16. Generally, the advantages of adsorption process relative to other methods are: high performance, low cost, wide pH ranges, and easy operation. In the other hand, the waste product and low selectivity are some of the main disadvantages of adsorption process17.
Now a day, nano-scale solid materials have successfully improved properties of working fluids18,19, alloys20,21, and polymers22, efficiency of solar collectors23, and performance of wastewater treatment processes24. Keshtkar et al. utilized the synthesized alumina nanoparticles with different specific surface areas to adsorb nickel ions from synthetic wastewater24. Esmaeili-Faraj et al. studied the desulfurization of an actual diesel fuel sample by applying the alumina/polymer nanocomposite from numerical and experimental perspectives25.
The chitosan-based nanocomposites have been widely used for water/wastewater treatment26,27. This popularity is associated with the chitosan’s low cost and its amino or hydroxyl functional groups. Chung examined the applicability of chitosan with various deacetylation degrees for treating aquaculture wastewater28. The optimum COD removal of 69.7% has been reported for the chitosan with a 98% deacetylation degree. Dionisi et al. inspected the impact of chitosan adsorbent and pH on the pollutants’ elimination from the pot ale wastewater29. Thirugnanasambandham and Sivakumar focused on the zinc oxide-chitosan nanocomposite to efficiently treat the milk processing industry wastewater30. It has been reported that COD and turbidity can be reduced by applying the zinc oxide-chitosan nanocomposite. The adsorption efficiency of Chitosan-Citral Schiff for the treatment of a dairy industry’s wastewater was studied by Tsaneva et al.31. The maximum COD removal efficiency was approximately 35.3% under the optimum condition. Ligaray et al. studied the applicability of the bentonite-chitosan composite for COD removal from an industrial wastewater stream containing an initial COD concentration of 1348 ppm32. The maximum COD removal of 73.34% has been achieved at the optimum condition. The kinetic of removal of heavy metals (Copper, cadmium and chromium) from wastewater using chitosan based adsorbents have been studied by Prakash et al.33,34,35.The results show that that pseudo second order kinetic model correlates better with the experimental data33,34,35.
Titanium dioxide (TiO2) nanoparticles are non-toxic, photochemically stable, and possess a strong oxidation ability36. The TiO2 nanoparticles have been extensively utilized as either photocatalyst or adsorbent for the COD removal from wastewaters37,38. Belessi et al. examined the simultaneous removal/adsorption of COD and reactive red 195 from aqueous solutions employing the TiO2 nanoparticle39. The photocatalytic removal efficiency of COD from sewage using the TiO2 catalyst has been studied by Toke and Ingale40. Goutam et al. synthesized the green TiO2 nanoparticles and investigated their performance for tannery wastewater treatment41. The results state that the fabricated green TiO2 nanoparticles remove 82.26% and 76.48% of the COD and Cr (VI) ion, respectively. Utilizing pure TiO2 nanoparticles as a photocatalyst for COD removal has several limitations, including inadequate UV (ultraviolet) irradiation, small oxidative performance, and high cost42. Improving the surface properties of nanoparticles by the co-adsorbent is a technique suggested to overcome the TiO2 limitations and increase its COD removal efficiency from wastewater. Rojviroon et al. applied the synthesized TiO2-activated carbon by the sol–gel method to remove the COD and dye from the landfill leachate43. Maleki et al. concentrated on the ethylene dichloride removal from wastewater using the TiO2–graphene catalyst44. Li et al. investigated the electrocatalytic characteristics of the fabricated TiO2–SiO2/GAC particle for COD removal45. Recently, the TiO2–chitosan nanocomposite has been employed to remove organic acids, heavy metals, and dyes. The degradation rate of Rhodamine B using the TiO2–chitosan nanocomposite was reported by Zhang et al.46. Chen et al. used the thiourea-modified chitosan–TiO2 nanocomposite for removing 2,4-dichlorophenol and Cd(II) ions from an aqueous solution47. Farzana and Meenakshi investigated the degradation of methylene blue, reactive red2, and Rhodamine B, by the TiO2–chitosan composite by measuring the solution COD48. Wibowo et al. compared the BOD and COD reduction ability of zeolite, TiO2–chitosan, and TiO2-bentonite composite49. Ali et al. used the TiO2–chitosan fibers supported zero-valent nanoparticles for the organic compound removal50. The ability of the ion-imprinted TiO2–chitosan adsorbent was also studied for nickel removal from aqueous solutions51. Tao et al. used the TiO2–chitosan hybrid film to absorb lead from aqueous solutions52. Nawi et al. examined the impact of operating parameters on the anionic dye (reactive red 4) removal capacity of the TiO2–chitosan nanocomposite53. The efficiency of TiO2–chitosan nanofibers for metal ions sorption was investigated by Razzaz et al.54.
However, little research has focused on the TiO2–chitosan nanocomposite ability for COD removal from industrial wastewater. Therefore, this work applies the TiO2–chitosan nanocomposite as an efficient medium for COD removal from industrial wastewater (Bouali Sina Petrochemical Company, Iran). The characteristics of TiO2, chitosan, and fabricated TiO2–chitosan nanocomposites have been determined using FESEM, XRD, and FTIR tests. The BBD (Box–Benkhen design of experiment) investigates the effect of adsorption parameters (i.e., temperature, pH, contact time, TiO2–chitosan mass ratio adsorbent content, and solution volume) on the COD removal from the wastewater. Moreover, the optimum operating condition that maximizes the COD removal from the industrial wastewater using the TiO2–chitosan nanocomposite has been determined. The best kinetic and isotherm models for describing the transient and equilibrium COD removal measurements have been introduced, and their associated parameters are accurately adjusted.
Laboratory phase
Materials
Chitosan (molecular weight = 100 kDa, 99% degree of deacetylation), and TiO2 nanoparticles have been bought from Sigma-Aldrich, USA. Acetic acid and sodium chloride have been purchased from Fluka, Germany. All experimentations have been done using distilled water.
Fabricating theTiO2–chitosan nanocomposite
The TiO2–chitosan nanocomposite was synthesized based on the procedure described by Zainal et al.55. Briefly, 2.5 g chitosan nanoparticles were dissolved in 40 mL NaCl (molarity = 0.2) and 30 mL acetic acid (molarity = 0.1) under 12 h of stirring. Then, 2.5 g, 1.25 g, or 5 g TiO2 powder (depending on the composite content, i.e., 1:1, 1:2, or 2:1) and 50 mL acetic acid (molarity = 0.1) were added to the previous solution and mixed for more than 24 h until a homogenous solution of TiO2–chitosan was reached. Finally, the solution was warm-up in an oven at 100 °C for 4 h until the solvent was completely evaporated and the TiO2–chitosan composite synthesized. Several composites with different mass ratios of TiO2 and chitosan (i.e., 1:1, 1:2, and 2:1) have been fabricated in the same way as described before.
Characterization tests
This study characterizes the morphology of TiO2 nanoparticles, chitosan, and fabricated TiO2–chitosan nanocomposites applying the FESEM (field-emission scanning electron microscopy, MIRA3TESCAN-XMU) after gold coating. The functional groups of TiO2, chitosan, and TiO2–chitosan nanocomposites have been monitored utilizing the FTIR test (Fourier transform infrared spectroscopy, Perkin–Elmer Spectrum GX FTIR spectrometer). The Philips instrument (X’pert diffractometer) has been employed for recording the XRD (X-ray powder diffraction) profiles of chitosan, TiO2, and TiO2–chitosan composites at 25 °C (using CuKα radiations).
Determination of COD of solutions
The performance of the fabricated TiO2–chitosan nanocomposites for reducing the wastewater COD was measured using the standard procedure of HACH. Indeed, the closed reflux method56 in a HACH COD reactor (DRB200, Hach Co., Loveland) containing K2Cr2O7 (potassium dichromate) reagent has been applied to measure the wastewater COD ranging from zero to 1500 mg L−1. Then, 2 mL aliquots were added to the COD vials at 150 °C for 2 h. The COD vials were cooled to room temperature and titrated with ferrous ammonium sulfate (molarity = 0.05). The solution pH adjusts using H2SO4 (molarity = 0.1) or NaOH (molarity = 0.1). After conducting the adsorption tests, the adsorbent separates from the extract through 10 min of centrifugation at 4000 rpm (Denley BS400 machine, UK). The TDS (total dissolved solids), initial pH, and COD of Bouali Sina Petrochemical Company wastewater are 574 mg L−1, 7.3, and 0.97 g L−1, respectively. Equation (1) expresses the mathematical formulation of the COD removal57.
where Ci and Co stand for the initial and final COD concentrations, respectively.
Design of experiments for the adsorption test
The current research applies the four-factor three-level BBD (Box–Behnken design) scenario to investigate the impact of adsorption parameters [i.e., adsorbent content (0.25–2.5 g), contact time (30–180 min), pH (3–11), and solution volume (100–500 mL)] on industrial wastewater COD removal using TiO2–chitosan nanocomposites. The polynomial model for correlating the COD removal to the adsorption parameters is defined by Eq. (2) 58.
where A0, Ak, Akk, Akz are the model’s coefficients. Xk, Xk2, and Xk Xz are the three combinations of the independent variables (linear, quadratic, and interactive). Table 1 summarizes the output of applying the design of the experiment to the adsorption parameters. This table also reports the experimentally-measured COD removal values (see “Effect of operating conditions on the COD removal” section), and their counterpart predicted values by a polynomial model (see “Statistical analyses of the adsorption experiments” section).
Kinetic and isotherm models
In the optimum condition of the adsorption process, the temperature effect (20–50 °C) on the COD reduction of the considered industrial wastewater was also investigated. The performance of TiO2, chitosan, and synthesized nanocomposites with different mass ratios of 1:1, 1:2, and 2:1 TiO2 and chitosan on the COD reduction was examined. Two famous kinetic models [i.e., pseudo-1st-order (Eq. 3)59 and pseudo-2nd-order (Eq. 4)60] have been applied to describe the transient behavior of the wastewater COD removal using the TiO2–chitosan nanocomposite.
where qe and qt present the COD removal capacity of an adsorbent at the equilibrium state and time t, respectively.
Freundlich, Redlich-Peterson, and Langmuir isotherms have also been checked to model the equilibrium measurements of the COD removal.
Results and discussion
Adsorbent characterization tests
FESEM
The FESEM images of the TiO2 nanoparticles, chitosan, and TiO2–chitosan nanocomposite are presented in Fig. 1a–c, respectively.

FESEM images of (a) TiO2, (b) chitosan, and (c) TiO2–chitosan nanocomposite.
These characterization tests show that the TiO2, chitosan, and TiO2–chitosan nanocomposite are homogenous and have an average particle size of 30, 35, and 40 nm. It can also be seen that the chitosan and TiO2 were appropriately dispersed in the structure of the TiO2–chitosan nanocomposite. The morphology of the TiO2–chitosan has a particle size ranging from 15 to 60 nm.
XRD
The XRD patterns of chitosan, TiO2, and TiO2–chitosan nanocomposite have been displayed in Fig. 2. The peaks observed at the 2θ = 25.3° (1 0 1), 48.1° (2 0 0), 56.6° (2 1 1), 62.7° (2 0 4), and 75.1° (2 1 5) could be related to the various diffraction planes of anatase form of the TiO2 nanoparticles. Whereas the peaks appeared at the 2θ = 27.5°, 37.0°, 54.3°, and 70.3° correspond to the various diffraction planes of nanoparticle rutile form61. The peaks corresponding to chitosan’s crystalline form appear at 2θ = 10° and 19.5°. The XRD pattern of TiO2–chitosan nanocomposite shows that the synthesized TiO2–chitosan nanocomposite possesses a crystallized form with peaks at 2θ = 19.2°, 25.3°, 48.1°, 62.7°, and 75°. Comparing the XRD patterns of TiO2–chitosan nanocomposite and TiO2 indicates the presence of chitosan peaks in the TiO2–chitosan nanocomposite structure. Moreover, no significant change in the anatase and rutile forms of the TiO2 nanoparticles has occurred. This observation approved that the TiO2–chitosan synthesis procedure maintains the characteristic structure of TiO2 nanoparticles.

XRD patterns of TiO2, chitosan, and TiO2–chitosan nanocomposite.
FTIR
The FTIR spectra of TiO2 nanosized particles, chitosan, and TiO2–chitosan nanocomposite have been shown in Fig. 3. The absorption bands at 3720, and 1650 cm−1 are related to O–H and N–H groups of the polysaccharide. The stretching band at 1560 cm−1 could be associated with the amide content in the chitosan structure. The observed bond at 2924 cm−1 corresponds to the CH2 stretching groups. The observed bond at 2359 cm−1 shows the stretching carboxyl groups of chitosan. The absorption band around 1150 cm−1 describes the C–OH stretching vibration. The chitosan C–O stretching groups are detected at 1005 and 862 cm−1.

FTIR spectra of chitosan, TiO2 and TiO2–chitosan nanocomposite.
In the TiO2 nanoparticles’ FTIR spectrum, the absorption spectra at 3737, 3231, 2359, and 1642 cm−1 are associated with the hydroxyl groups. The observed band at 650 cm−1 revealed the existence of the TiO2 compound.
Moreover, the characteristic bands of the chitosan and TiO2 can be easily detected in the TiO2–chitosan nanocomposite’s FTIR spectrum. No significant differences are observable in the FTIR spectra of the chitosan, TiO2, and the synthesized TiO2–chitosan nanocomposite. It implies that the TiO2 addition into the chitosan structure produces no changes in the chitosan chemical structure. These observations approved that the TiO2 was physically loaded in the chitosan structure.
Effect of operating conditions on the COD removal
The effects of four influential factors (i.e., adsorbent content, contact time, pH, and solution volume) on the industrial wastewater COD removal have been measured at three working levels. Figure 4a shows the pH impact on the COD removal efficiency of the TiO2–chitosan nanocomposite. This figure states that increasing the solution pH up to 7 increases the COD removal, and after that, the COD removal efficiency of TiO2–chitosan nanocomposite decreases. Higher H+ ion concentration in the acidic solution (pH of lower than 7) neutralizes the negative charge of the TiO2–chitosan surface and reduces the COD removal efficiency by the ion exchange. On the other hand, high OH- ion concentration in the alkaline/basic solution (pH of higher than 7) prevents the diffusion of organic materials into the TiO2–chitosan pores and decreases the COD removal62. Furthermore, the surface charge of the adsorbent depends on the solution pH. The zero charge point of a TiO2 in water is at pH ~ 6. At the alkaline range of pH, the positive surface charge of the adsorbent may be responsible for decreasing the COD removal efficiency of the TiO2–chitosan nanocomposite40. Similar results were also reported by other researchers63,64. The optimum pH value of 7 has been reported for maximizing the COD removal efficiency of some adsorbents for wastewater treatment of the coffee63 and sugar64 processing companies.
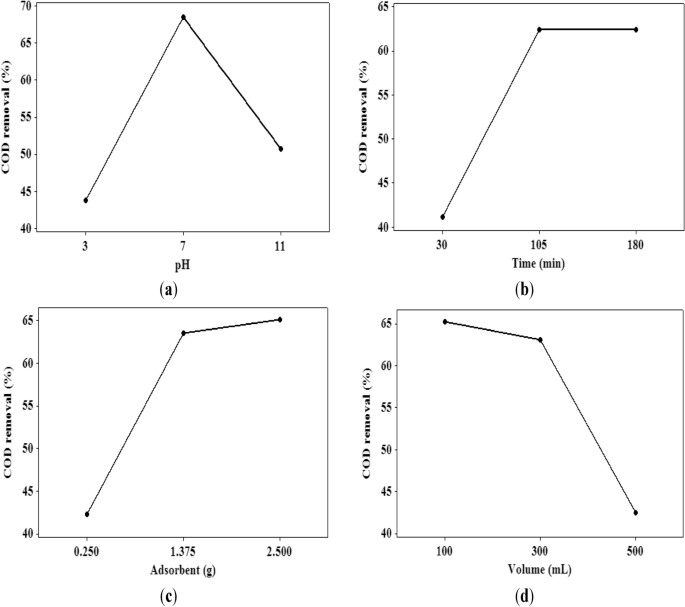
The influence of (a) solution pH, (b) wastewater-adsorbent contact time, (c) adsorbent content, and (d) solution volume on the COD removal ability of the TiO2–chitosan nanocomposite.
The influence of wastewater-nanocomposite contact time at three levels on the COD removal performance of the TiO2–chitosan adsorbent is depicted in Fig. 4b. It can be concluded that the adsorption capacity of the TiO2–chitosan nanocomposite increases by increasing the contact time. COD adsorption using the TiO2–chitosan adsorbent experiences the equilibrium state at contact time = 180 min. More than 90% of the total COD has been adsorbed at the first 105 min of the contact time. The sharp variation of the COD removal during the first 105 min of contact time is associated with the high number of active sites available at the TiO2–chitosan surface. After saturating surface-active sites, the organic matters require more time to diffuse through the TiO2–chitosan pores and adsorb on the pore walls of the nanocomposite. After 180 min of contact time, all the internal/external active sites of the TiO2–chitosan nanocomposite have been occupied, and the equilibrium state is reached. A similar trend has been reported for water removal from 2-dimethylaminoethylazide using calcium chloride and NaA zeolite65.
Figure 4c shows the influence of adsorbent content on the COD removal from industrial wastewater. This figure explains that increasing the adsorbent content increases the available active sites for pollutant adsorption and enhances the COD removal efficiency of the utilized nanocomposite. This figure also shows that the COD removal rate decreases by increasing the adsorbent content (> 1.375 g). Indeed, decreasing the available organic matter to adsorb on the active nanocomposite sites reduces the COD removal rate of a high nanocomposite dosage.
The impact of the effluent volume of wastewater/solution on the COD removal efficiency of the fabricated nanocomposite is illustrated in Fig. 4d. This figure indicates that increasing the solution volume increases the number of organic matters, rapidly saturates the available active sites of the nanocomposite, and decreases the COD removal. The low performance of the TiO2–chitosan nanocomposite for efficiently removing the COD of 500 mL of effluent volume is related to the rapid saturation of adsorbent sites. Indeed, the lower COD removal efficiency achieved for the high than the low wastewater effluent volume is connected to the higher COD needed to be adsorbed/removed by the same number of active sites.
The COD removal ability of TiO2 nanoparticles, chitosan, and synthesized nanocomposites with mass ratios of 1:1, 1:2, and 2:1 of TiO2 and chitosan have been compared in Fig. 5. This graph shows that the maximum COD removal of 80% can be achieved by helping the TiO2–chitosan (1:1) adsorbent at pH 7, contact time 180 min, adsorbent content 2.5 g, and 300 mL solution volume. The COD removal ability of the utilized adsorbents has an order of TiO2–chitosan 1:1 (80%) > TiO2–chitosan 1:2 (76%) > TiO2–chitosan 2:1 (73%) > TiO2 (69%) > chitosan (65%). Therefore, the TiO2–chitosan with an equal mass ratio is the best adsorbent for COD removal from industrial wastewater.

Performance of synthesized adsorbents for COD removal from wastewater (CS: Chitosan).
Dependency of the COD removal efficiency of the TiO2–chitosan (1:1) nanocomposite 100 mL of the effluent solution (pH 7.4, adsorbent content = 1.375 g, contact time = 105 min) has been illustrated in Fig. 6. This figure approves the negative effect of temperature on the COD removal efficiency of the TiO2–chitosan nanocomposite. It means that the TiO2–chitosan adsorbent has the highest tendency to remove the wastewater COD at low temperatures. This behavior may be associated with increasing the internal energy of pollutants that helps them to detach from the adsorbent surface and escape into the solution bulk. Exothermic adsorption may be considered the next responsible for this observation66. Thus, both physical and ion exchange are possible to involve in the COD sorption process using the TiO2–chitosan nanocomposite. This observation has also been reported by other scientists67,68.

Effect of temperature on the COD reduction efficiency using TiO2–chitosan nanocomposite.
Statistical analyses of the adsorption experiments
Table 2 summarizes the results of ANOVA (analysis of variance) performed to inspect the significance probability (p-value) of influential variables on the COD removal efficiency of the nanocomposite. Those independent variables with p < 0.05 at the 95% confidence interval significantly impact the COD removal69. The significant variables are necessary to include in the full quadratic model70. On the other hand, the insignificant variables (p > 0.05) should be removed from the full quadratic model71.
Table 3 reports the ANOVA results for only the significant variables (p < 0.05). Equation (5) presents the polynomial model developed to predict COD removal from the significant variables.
where X1, X2, X3, and X4 stand for the solution pH, contact time (min), adsorbent content (g), and effluent solution volume (mL), respectively. Comparing the lack of fit before (0.252) and after (0.224) elimination of the insignificant parameters reveals considerable improvement in the model prediction accuracy. A relatively high achieved correlation coefficient (R2 > 0.99) implies an excellent compatability between the experimental COD removal values and their counterpart predictions by the developed model. Equation (6) presents the mathematical form of the R2 72.
Validation of the model performance
A normal probability graph of residuals is depicted in Fig. 7a. This figure states that all data samples have approximately located around the straight diagonal line. Based on the Yetilmezsoy et al. observation, errors have a normal distribution and are independent of each other73. The cross-plot of the predicted COD removal (FITS1) versus their associated experimental measurements has been exhibited in Fig. 7b. It can be easily concluded that slight deviations exist between the experimental COD removal values and the model predictions. The high correlation coefficient value (R2 = 0.999) approves that the constructed model accurately approximates the experimentally-measured COD data.

(a) the normal probability graph of residuals and (b) cross-plot of the experimental and predicted COD removal values.
Optimizing the adsorption parameters
It is possible to locate the optimized values of the involved independent variables by solving Eq. (5). The optimum values of the solution pH, contact time, adsorbent content, and effluent solution volume are 7.4, 180 min, 2.5 g, and 100 mL, respectively. In this optimum condition, the maximum COD removal efficiency of the TiO2–chitosan nanocomposite is 93.67%. The experimental value of the COD removal under the optimum condition (i.e., 94.5%) is also in excellent agreement with the predicted optimized value.
Monitoring the combined effect of independent variables
Figure 8 exhibits several three-dimensional (3D) graphs for monitoring the dependency of the COD removal ability of the TiO2–chitosan nanocomposites on different combinations of influential variables. Each of these figures explains the combined effect of a pair of independent variables on the COD removal (the central level of the other two variables has been used to plot these figures). The surface plot of the estimated COD removal as a function of pH and contact time has been shown in Fig. 8a. The COD removal efficiency of the TiO2–chitosan nanocomposite increases by increasing the solution pH up to 7 and then decreases at higher pH values. This behavior was previously related to the variation of the adsorbent surface charge by the solution pH. Increasing the COD removal over time is related to the greater period available for organic matter to absorb on the nanocomposite surface and diffuse in its pores. The simultaneous effects of pH and adsorbent content (Fig. 8b) and pH and effluent solution volume (Fig. 8c) on the wastewater COD removal reveal that the optimum pH value is about 7. The couple effects of pH and contact time (Fig. 8a), adsorbent dosage and contact time (Fig. 8d), and contact time and volume solution (Fig. 8e) indicate that two different mechanisms govern the COD adsorption efficiency of the utilized nanocomposite over the time. In the first stage (up to 105 min), the fast COD adsorption may be related to the adsorption of organic matters on the external surface of the TiO2–chitosan nanocomposite. In the second stage, the organic matter diffuses through the TiO2–chitosan composite pores and throats and absorbs on the internal active sites.

Variation of the COD removal by the (a) solution pH–time, (b) solution pH–nanocomposite mass, (c) pH–wastewater volume, (d) time–nanocomposite mass, (e) time–wastewater volume, and (f) nanocomposite mass–wastewater volume.
Furthermore, enhancing the COD removal by the TiO2–chitosan nanocomposite dosage can be related to increasing the available surface area and active sites for adsorbing pollutants (Fig. 8b,d,f). The simultaneous effect of volume and pH, adsorbent dosage, and contact time have been presented in Fig. 8c,e,f. These graphs state that increasing the effluent wastewater volume negatively affects the COD removal efficiency of the nanocomposite. An increase in the effluent wastewater volume increases the pollutant concentration, rapidly saturates the active sites, and reduces the COD removal ability of the nanocomposite.
Kinetic studies
Referring to Eqs. (3) and (4), the adjustable constants of the pseudo-1st-order and pseudo-2nd-order kinetic equations are shown by k1 and k2, respectively. Table 4 introduces the adjusted constants of the considered kinetic models, experimental and calculated values of the COD adsorption capacity at the equilibrium state, and the observed correlation coefficients. Since the pseudo-2nd-order has a higher correlation coefficient than that of the pseudo-1st-order kinetic approach, the earlier better describes the transient behavior of the COD removal by the TiO2–chitosan nanocomposite. Furthermore, the COD adsorption capacity obtained by the pseudo-2nd-order has a higher compatibility with the experimental measurements (R2 = 0.993) than those provided by the pseudo-1st-order kinetic model (R2 = 0.970). Thus, the pseudo-2nd-order kinetic model is chosen for modeling the transient behavior of the wastewater COD removal using the TiO2–chitosan adsorbent. This is close to the results discussed by Prakash et al.35.
Isotherm models
Three well-established isotherm models, namely Freundlich74, Redlich–Peterson75, and Langmuir76,77, have been employed to monitor the equilibrium behavior of the COD removal performance of the TiO2–chitosan nanocomposite. The mathematical form of Freundlich [Eq. (7)], Redlich–Peterson [Eq. (8)], and Langmuir [Eq. (9)] isotherms has been shown below.
where kF and n are Freundlich’s model constants. qm and b show the coefficients of the Langmuir model. P, α, and β stand for the Redlich–Peterson model parameters. Adjusted parameters of the selected isotherms for describing the equilibrium COD removal using the TiO2–chitosan composite have been reported in Table 5. This table also introduces the numerical values of the observed correlation coefficients. It can be seen that the Redlich–Peterson isotherm model has the highest R2 value (i.e., 0.991), and the Freundlich isotherm possesses the smallest R2 (i.e., 0.970). Since the adjusted value of the β (for the Redlich–Peterson isotherm) is close to 1, it can be concluded that the monolayer COD adsorption by the TiO2–chitosan nanocomposite is the predominant scenario.
Cost analysis
The cost of chitosan and TiO2 nanopowder was obtained as presented in Table 6. According to Table 6, maximum production cost of nano composite TiO2–chitosan (1:1) is about 2.96 $ per kg of adsorbent.
Conclusion
This research studied industrial wastewater treatment using TiO2 nanoparticles, chitosan, and TiO2–chitosan nanocomposite from experimental and numerical points of view. The considered adsorbents have been characterized by the XRD, FTIR, and FESEM tests. The XRD pattern proved that the synthesized TiO2–chitosan nanocomposite preserves the characteristic structure of TiO2 nanoparticles. Analyzing the FTIR spectra approved that the TiO2 nanoparticles have been physically loaded in the chitosan structure. The FESEM tests confirmed that the TiO2–chitosan nanocomposite has a particle size ranging from 15 to 60 nm. The impact of solution pH, temperature, adsorbent mass and composition, contact time, and effluent solution volume on the COD removal has been monitored using the experimental and modeling analyses. The optimum condition for the considered process (pH 7.4, contact time = 180 min, nanocomposite mass = 2.5 g, and wastewater effluent volume = 100 mL) has been determined using the Box–Behnken design of the experiment. Furthermore, results approved that the TiO2–chitosan (1:1) at the lowest allowable temperature is better to employ for industrial wastewater treatment. The maximum experimental and calculated COD removal efficiency of the TiO2–chitosan nanocomposite is 93.67% and 94.5%, respectively. The Redlich–Peterson isotherm and Pseudo-2nd-order kinetic models showed the best performances for describing the equilibrium and kinetic measurements of the wastewater COD removal by the fabricated nanocomposite.
Data availability
All data generated or analyzed during this study are available on reasonable request from the corresponding author.
References
Yaseen, Z. M. et al. Laundry wastewater treatment using a combination of sand filter, bio-char and teff straw media. Sci. Rep. 9, 1–11 (2019).
Yadav, A., Mukherji, S. & Garg, A. Removal of chemical oxygen demand and color from simulated textile wastewater using a combination of chemical/physicochemical processes. Ind. Eng. Chem. Res. 52, 10063–10071 (2013).
Hamdan, A. M., Abd-El-Mageed, H. & Ghanem, N. Biological treatment of hazardous heavy metals by Streptomyces rochei ANH for sustainable water management in agriculture. Sci. Rep. 11, 1–12 (2021).
Prakash, N. & Vendan, S. A. Biodegradable polymer based ternary blends for removal of trace metals from simulated industrial wastewater. Int. J. Biol. Macromol. 83, 198–208 (2016).
Tian, X. et al. Removal of both anionic and cationic dyes from wastewater using pH-responsive adsorbents of l-lysine molecular-grafted cellulose porous foams. J. Hazard. Mater. 426, 128121 (2022).
Liu, W. et al. Recycling Mg(OH)2 nanoadsorbent during treating the low concentration of CrVI. Environ. Sci. Technol. 45, 1955–1961 (2011).
Zhang, L. et al. The performance of electrode ultrafiltration membrane bioreactor in treating cosmetics wastewater and its anti-fouling properties. Environ. Res. 206, 112629 (2022).
Bellebia, S., Kacha, S., Bouyakoub, A. Z. & Derriche, Z. Experimental investigation of chemical oxygen demand and turbidity removal from cardboard paper mill effluents using combined electrocoagulation and adsorption processes. Environ. Prog. Sustain. Energy 31, 361–370 (2012).
Zhang, L. et al. Effects of coexisting Na+, Mg2+ and Fe3+ on nitrogen and phosphorus removal and sludge properties using A2O process. J. Water Process Eng. 44, 102368 (2021).
Ge, D. et al. Application of CaO2-enhanced peroxone process to adjust waste activated sludge characteristics for dewaterability amelioration: Molecular transformation of dissolved organic matters and realized mechanism of deep-dewatering. Chem. Eng. J. 437, 135306 (2022).
Ge, D., Yuan, H., Xiao, J. & Zhu, N. Insight into the enhanced sludge dewaterability by tannic acid conditioning and pH regulation. Sci. Total Environ. 679, 298–306 (2019).
Hu, M. et al. Hierarchical dual-nanonet of polymer nanofibers and supramolecular nanofibrils for air filtration with a high filtration efficiency, low air resistance and high moisture permeation. J. Mater. Chem. A 9, 14093–14100 (2021).
Esmaeili Faraj, S. H., Esfahany, M. N., Kadivar, M. & Zilouei, H. Vinyl chloride removal from an air stream by biotrickling filter. J. Environ. Sci. Health. A 47, 2263–2269 (2012).
Halim, A. A., Aziz, H. A., Johari, M. A. M., Ariffin, K. S. & Adlan, M. N. Ammoniacal nitrogen and COD removal from semi-aerobic landfill leachate using a composite adsorbent: Fixed bed column adsorption performance. J. Hazard. Mater. 175, 960–964 (2010).
AbGhani, Z., Yusoff, M. S., Zaman, N. Q., Zamri, M. F. M. A. & Andas, J. Optimization of preparation conditions for activated carbon from banana pseudo-stem using response surface methodology on removal of color and COD from landfill leachate. Waste Manag. 62, 177–187 (2017).
Zhou, K. et al. Development of nano-CaO2-coated clinoptilolite for enhanced phosphorus adsorption and simultaneous removal of COD and nitrogen from sewage. Chem. Eng. J. 328, 35–43 (2017).
Sadegh, H. & Ali, G. A. M. Potential applications of nanomaterials in wastewater treatment: Nanoadsorbents performance. In Advanced Treatment Techniques for Industrial Wastewater (eds Hussain, A. & Ahmed, S.) 51–61 (IGI Global, 2019). https://doi.org/10.4018/978-1-5225-5754-8.ch004.
Wang, Y. et al. Experimental evaluation of the lubrication properties of the wheel/workpiece interface in MQL grinding with different nanofluids. Tribol. Int. 99, 198–210 (2016).
Zhang, Y. et al. Nano-enhanced biolubricant in sustainable manufacturing: From processability to mechanisms. Friction 1, 1–39 (2022).
Zhang, Y. et al. Experimental study on the effect of nanoparticle concentration on the lubricating property of nanofluids for MQL grinding of Ni-based alloy. J. Mater. Process. Technol. 232, 100–115 (2016).
Li, B. et al. Heat transfer performance of MQL grinding with different nanofluids for Ni-based alloys using vegetable oil. J. Clean. Prod. 154, 1–11 (2017).
Gao, T. et al. Grindability of carbon fiber reinforced polymer using CNT biological lubricant. Sci. Rep. 11, 1–14 (2021).
Cao, Y., Kamrani, E., Mirzaei, S., Khandakar, A. & Vaferi, B. Electrical efficiency of the photovoltaic/thermal collectors cooled by nanofluids: Machine learning simulation and optimization by evolutionary algorithm. Energy Rep. 8, 24–36 (2022).
Keshtkar, Z., Tamjidi, S. & Vaferi, B. Intensifying nickel (II) uptake from wastewater using the synthesized γ-alumina: An experimental investigation of the effect of nano-adsorbent properties and operating conditions. Environ. Technol. Innov. 22, 101439 (2021).
Esmaeili-Faraj, S. H., Hassanzadeh, A., Shakeriankhoo, F., Hosseini, S. & Vaferi, B. Diesel fuel desulfurization by alumina/polymer nanocomposite membrane: Experimental analysis and modeling by the response surface methodology. Chem. Eng. Process. Process Intensif. 164, 108396 (2021).
Rani, M. & Shanker, U. Metal oxide-chitosan based nanocomposites for efficient degradation of carcinogenic PAHs. J. Environ. Chem. Eng. 8, 103810 (2020).
Rimu, S. H. & Rahman, M. M. Insight of chitosan-based nanocomposite for removal of hexavalent chromium from wastewater: A review. Int. J. Environ. Anal. Chem. 1, 1–18 (2020).
Chung, Y. C. Improvement of aquaculture wastewater using chitosan of different degrees of deacetylation. Environ. Technol. 27, 1199–1208 (2006).
Dionisi, D., Bruce, S. S. & Barraclough, M. J. Effect of pH adjustment, solid–liquid separation and chitosan adsorption on pollutants’ removal from pot ale wastewaters. J. Environ. Chem. Eng. 2, 1929–1936 (2014).
Thirugnanasambandham, K. & Sivakumar, V. Modeling and optimization of treatment of milk industry wastewater using chitosan–zinc oxide nanocomposite. Desalin. Water Treat. 57, 18630–18638 (2016).
Tsaneva, D. K., Nikolova, M. I., Prokopov, T. V., Stoyanova, A. S. & Denev, P. P. Evaluation of adsorption capacity of chitosan-citral schiff base for wastewater pre-treatment in dairy industries. Ecol. Balk. 9, 1–10 (2017).
Ligaray, M., Futalan, C. M., de Luna, M. D. & Wan, M. W. Removal of chemical oxygen demand from thin-film transistor liquid-crystal display wastewater using chitosan-coated bentonite: Isotherm, kinetics and optimization studies. J. Clean. Prod. 175, 145–154 (2018).
Prakash, N., Sudha, P. N. & Renganathan, N. G. Copper and cadmium removal from synthetic industrial wastewater using chitosan and nylon 6. Environ. Sci. Pollut. Res. 19, 2930–2941 (2012).
Prakash, N., Latha, S., Sudha, P. N. & Renganathan, N. G. Influence of clay on the adsorption of heavy metals like copper and cadmium on chitosan. Environ. Sci. Pollut. Res. 20, 925–938 (2013).
Prakash, N., Latha, S., Sudha, P. N. & Renganathan, N. G. Kinetics of removal of chromium from wastewater using chitosan-based binary polymer blends. Synth. React. Inorg. Met. Nano Metal Chem. 46, 1310–1317 (2016).
de Dicastillo, C. L., Correa, M. G., Martínez, F. B., Streitt, C. & Galotto, M. J. Antimicrobial effect of titanium dioxide nanoparticles. in Antimicrobial Resistance-A One Health Perspective (IntechOpen, 2020).
Al-Mamun, M. R., Kader, S., Islam, M. S. & Khan, M. Z. H. Photocatalytic activity improvement and application of UV-TiO2 photocatalysis in textile wastewater treatment: A review. J. Environ. Chem. Eng. 7, 103248 (2019).
Mustapha, S. et al. Application of TiO2 and ZnO nanoparticles immobilized on clay in wastewater treatment: A review. Appl. Water Sci. 10, 1–36 (2020).
Belessi, V., Romanos, G., Boukos, N., Lambropoulou, D. & Trapalis, C. Removal of Reactive Red 195 from aqueous solutions by adsorption on the surface of TiO2 nanoparticles. J. Hazard. Mater. 170, 836–844 (2009).
Toke, N., Oza, A. & Ingale, S. T. TiO2 as an oxidant for removal of chemical oxygen demand from sewage. Univers. J. Environ. Res. Technol. 4, 1–10 (2014).
Goutam, S. P. et al. Green synthesis of TiO2 nanoparticles using leaf extract of Jatropha curcas L. for photocatalytic degradation of tannery wastewater. Chem. Eng. J. 336, 386–396 (2018).
Li, J., Luo, G., He, L., Xu, J. & Lyu, J. Analytical approaches for determining chemical oxygen demand in water bodies: A review. Crit. Rev. Anal. Chem. 48, 47–65 (2018).
Rojviroon, O., Rojviroon, T. & Sirivithayapakorn, S. Removal of color and chemical oxygen demand from landfill leachate by photocatalytic process with AC/TiO2. Energy Procedia 79, 536–541 (2015).
Maleki, S. A., Mirzaei, M. & Azimi, A. COD reduction by TiO2/graphene photocatalytic treatment of ethylene dichloride in wastewater. Desalin. Water Treat. 57, 13207–13212 (2016).
Li, X. Y. et al. TiO2-SiO2/GAC particles for enhanced electrocatalytic removal of acid orange 7 (AO7) dyeing wastewater in a three-dimensional electrochemical reactor. Sep. Purif. Technol. 187, 303–310 (2017).
Zhang, X., Zhao, X. & Su, H. Degradation characteristic of TiO2–chitosan adsorbent on Rhodamine B and purification of industrial wastewater. Korean J. Chem. Eng. 28, 1241–1246 (2011).
Chen, A. et al. Novel thiourea-modified magnetic ion-imprinted chitosan/TiO2 composite for simultaneous removal of cadmium and 2, 4-dichlorophenol. Chem. Eng. J. 191, 85–94 (2012).
Farzana, M. H. & Meenakshi, S. Synergistic effect of chitosan and titanium dioxide on the removal of toxic dyes by the photodegradation technique. Ind. Eng. Chem. Res. 53, 55–63 (2014).
Wibowo, E. A. P., Aji, N. R. & Widiarti, N. Synthesis of TiO2/chitosan photocatalyst, TiO2/bentonite and adsorption of zeolite to purify unnes’s water reservoir. Int. J. Chemtech. Res. 10, 62–69 (2017).
Ali, F., Khan, S. B., Kamal, T., Alamry, K. A. & Asiri, A. M. Chitosan-titanium oxide fibers supported zero-valent nanoparticles: Highly efficient and easily retrievable catalyst for the removal of organic pollutants. Sci. Rep. 8, 1–18 (2018).
Li, Q., Su, H. & Tan, T. Synthesis of ion-imprinted chitosan-TiO2 adsorbent and its multi-functional performances. Biochem. Eng. J. 38, 212–218 (2008).
Tao, Y., Ye, L., Pan, J., Wang, Y. & Tang, B. Removal of Pb(II) from aqueous solution on chitosan/TiO2 hybrid film. J. Hazard. Mater. 161, 718–722 (2009).
Nawi, M. A., Sabar, S., Jawad, A. H. & Ngah, W. S. W. Adsorption of Reactive Red 4 by immobilized chitosan on glass plates: Towards the design of immobilized TiO2–chitosan synergistic photocatalyst-adsorption bilayer system. Biochem. Eng. J. 49, 317–325 (2010).
Razzaz, A., Ghorban, S., Hosayni, L., Irani, M. & Aliabadi, M. Chitosan nanofibers functionalized by TiO2 nanoparticles for the removal of heavy metal ions. J. Taiwan Inst. Chem. Eng. 58, 333–343 (2016).
Zainal, Z., Hui, L. K., Hussein, M. Z. & Abdullah, A. H. Characterization of TiO2–chitosan/glass photocatalyst for the removal of a monoazo dye via photodegradation–adsorption process. J. Hazard. Mater. 164, 138–145 (2009).
Federation, W. E. & Association, A. Standard methods for the examination of water and wastewater. Am. Public Health Assoc. 21, 1–10 (2005).
Dubey, S., Joshi, A., Trivedi, R., Pal, D. & Prajapati, A. K. Electro-peroxone treatment of rice grain based distillery biodigester effluent: COD and color removal. Water Resour. Ind. 25, 100142 (2021).
Afshin, S. et al. Application of Box–Behnken design for optimizing parameters of hexavalent chromium removal from aqueous solutions using Fe3O4 loaded on activated carbon prepared from alga: Kinetics and equilibrium study. J. Water Process Eng. 42, 102113 (2021).
Moussout, H., Ahlafi, H., Aazza, M. & Maghat, H. Critical of linear and nonlinear equations of pseudo-first order and pseudo-second order kinetic models. Karbala Int. J. Mod. Sci. 4, 244–254 (2018).
Ghanbari Pakdehi, S. & Vaferi, B. A study on adsorptive removal of DMAZ from aqueous solutions by ZSM-5, NaY zeolites, and activated carbon: kinetic and isotherm. Desalin. Water Treat. 57, 18286–18292 (2016).
Behnajady, M. A., Modirshahla, N., Shokri, M. & Rad, B. Enhancement of photocatalytic activity of TiO2 nanoparticles by silver doping: Photodeposition versus liquid impregnation methods. Glob. NEST J. 10, 1–7 (2008).
Devi, R. & Dahiya, R. P. Chemical oxygen demand (COD) reduction in domestic wastewater by fly ash and brick kiln ash. Water. Air. Soil Pollut. 174, 33–46 (2006).
Devi, R. Innovative technology of COD and BOD reduction from coffee processing wastewater using avocado seed carbon (ASC). Water. Air. Soil Pollut. 207, 299–306 (2010).
Parande, A. K., Sivashanmugam, A., Beulah, H. & Palaniswamy, N. Performance evaluation of low cost adsorbents in reduction of COD in sugar industrial effluent. J. Hazard. Mater. 168, 800–805 (2009).
Ghanbari, S. & Vaferi, B. Experimental and theoretical investigation of water removal from DMAZ liquid fuel by an adsorption process. Acta Astronaut. 112, 19–28 (2015).
Dong, Y., Gao, M., Song, Z. & Qiu, W. Adsorption mechanism of As(III) on polytetrafluoroethylene particles of different size. Environ. Pollut. 254, 112950 (2019).
Ramya, P. M. et al. Chemical oxygen demand reduction from coffee processing waste water: A comparative study on usage of biosorbents prepared from agricultural wastes. (2015).
Ziati, M. & Hazourli, S. Removal of chemical oxygen demand from pharmaceutical wastewater by adsorption on anthracite: Adsorption isotherms and thermodynamics. Rev. Roum. Chim. 62, 933–940 (2017).
Aliabadi, M., Irani, M., Ismaeili, J. & Najafzadeh, S. Design and evaluation of chitosan/hydroxyapatite composite nanofiber membrane for the removal of heavy metal ions from aqueous solution. J. Taiwan Inst. Chem. Eng. 45, 518–526 (2014).
Abdulredha, M. M., Hussain, S. A. & Abdullah, L. C. Optimization of the demulsification of water in oil emulsion via non-ionic surfactant by the response surface methods. J. Pet. Sci. Eng. 184, 106463 (2020).
Nasirpour, N. & Mousavi, S. M. RSM based optimization of PEG assisted ionic liquid pretreatment of sugarcane bagasse for enhanced bioethanol production: Effect of process parameters. Biomass Bioenerg. 116, 89–98 (2018).
Wang, J. et al. Estimating the relative crystallinity of biodegradable polylactic acid and polyglycolide polymer composites by machine learning methodologies. Polymers 14, 527 (2022).
Yetilmezsoy, K., Demirel, S. & Vanderbei, R. J. Response surface modeling of Pb(II) removal from aqueous solution by Pistacia vera L.: Box–Behnken experimental design. J. Hazard. Mater. 171, 551–562 (2009).
Freundlich, H. Über die adsorption in lösungen. Z. Phys. Chem. 57, 385–470 (1907).
Redlich, O. & Peterson, D. L. A useful adsorption isotherm. J. Phys. Chem. 63, 1024 (1959).
Langmuir, I. The constitution and fundamental properties of solids and liquids. Part I. Solids. J. Am. Chem. Soc. 38, 2221–2295 (1916).
Mahmoodi, F., Darvishi, P. & Vaferi, B. Prediction of coefficients of the Langmuir adsorption isotherm using various artificial intelligence (AI) techniques. J. Iran. Chem. Soc. 15, 2747–2757 (2018).
Acknowledgements
The authors wish to thank the Shahid Chamran University of Ahvaz for supporting this project (Grant 1396).
Author information
Authors and Affiliations
Contributions
All authors have a same contribution.
Corresponding author
Ethics declarations
Competing interests
The authors declare no competing interests.
Additional information
Publisher's note
Springer Nature remains neutral with regard to jurisdictional claims in published maps and institutional affiliations.
Rights and permissions
Open Access This article is licensed under a Creative Commons Attribution 4.0 International License, which permits use, sharing, adaptation, distribution and reproduction in any medium or format, as long as you give appropriate credit to the original author(s) and the source, provide a link to the Creative Commons licence, and indicate if changes were made. The images or other third party material in this article are included in the article's Creative Commons licence, unless indicated otherwise in a credit line to the material. If material is not included in the article's Creative Commons licence and your intended use is not permitted by statutory regulation or exceeds the permitted use, you will need to obtain permission directly from the copyright holder. To view a copy of this licence, visit http://creativecommons.org/licenses/by/4.0/.
About this article

Cite this article
Heydari Orojlou, S., Rastegarzadeh, S. & Zargar, B. Experimental and modeling analyses of COD removal from industrial wastewater using the TiO2–chitosan nanocomposites. Sci Rep 12, 11088 (2022). https://doi.org/10.1038/s41598-022-15387-0
Received:
Accepted:
Published:
DOI: https://doi.org/10.1038/s41598-022-15387-0
Comments
By submitting a comment you agree to abide by our Terms and Community Guidelines. If you find something abusive or that does not comply with our terms or guidelines please flag it as inappropriate.
