
Abstract
The high-quality development of the manufacturing industry is an important strategic task for Chinese economic development. The rapid development of the manufacturing industry is also accompanied by problems such as overcapacity and environmental pollution. This paper analyzes the impact of capacity utilization on the high-quality development of manufacturing and establishes a nonlinear threshold regression model on this basis, and studies and analyzes environmental regulations as a threshold variable under the influence of capacity utilization rate on the high-quality development of the manufacturing industry. The research results show that: capacity utilization, profitability, foreign direct investment, and government participation all have a significant positive impact on the high-quality development of the manufacturing industry; environmental regulations have a significant negative impact on the high-quality development of the manufacturing industry. And in the model of the effect of capacity utilization on the high-quality development of the manufacturing industry, environmental regulation has a single threshold effect. With the increase in the intensity of environmental regulation, the coefficient and significance of the effect of capacity utilization on the high-quality development of the manufacturing industry have changed. Finally, this article puts forward corresponding policies and suggestions based on the results of data analysis.
Introduction
Manufacturing is an important way to promote economic growth. From the "Reindustrialization" development strategy put forward by the United States, Germany, Britain, France, and the European Union and made in China 2025 issued by China, the importance of manufacturing has been re-recognized by countries all over the world. Manufacturing is an important driving force for China's economic growth1. The 2018 Central Economic Work Conference put the promotion of high-quality development of manufacturing at the top of its key tasks, and the 2019 government work report once again emphasized the promotion of high-quality development of manufacturing2. Since China’s reform and opening up, while the development speed and overall scale of China’s manufacturing industry have made remarkable achievements, they are also facing problems such as overcapacity, environmental pollution, and energy consumption that threaten the sustainable development of China’s economy. To a certain extent, it has delayed the pace of China's economic development towards high-quality development3. The high-quality development of the manufacturing industry is the only choice for China's manufacturing industry to turn from "large" to "strong"2. Environmental pollution, ecological destruction, and increasingly scarce resources and energy are serious challenges faced by all countries in the world. The development of green and clean production and the realization of sustainable development have become the consensus of the international community. The “Guiding Opinions on Resolving Serious Overcapacity Contradictions” issued by the State Council in 2013 clearly stated that strengthening environmental access and strengthening environmental law enforcement are effective measures to resolve overcapacity. Environmental standards for industries with overcapacity must be gradually improved to guide the green development of industries5. In the "2016 Environmental Performance Index Report" released by Yale University in 2016, China's Environmental Performance Index (EPI) ranked second, and environmental issues have attracted great attention from the general public and governments at all levels4. How to achieve the win-win goal of improving environmental quality and increasing industrial capacity utilization has gradually become a hot topic in the academic circles under the background of high-quality economic development in China in the new era.
Overcapacity is an important issue of general concern to the international community after the international financial crisis. Overcapacity has seriously hindered the sustainable development of China's economy. Overcapacity refers to the situation where the production capacity formed in advance exceeds the equilibrium quantity requirement, which leads to the idle situation of production factors. The "Guidelines of the State Council on Solving the Contradictions of Serious Overcapacity" promulgated by the government in 2013 have had a huge external impact on the traditionally competitive manufacturing market6,7,8. In terms of the inspection of capacity utilization and the judgment of overcapacity, according to the analysis results published by the International Monetary Fund (IMF2012), China's overall capacity utilization rate dropped from around 85% at the turn of the century to 60% at 2011. In addition, according to the analysis results of Chinese scholars, the average capacity utilization rate of China's industry from 2001 to 2011 was 69.3%. Taking 2008 as the demarcation point, it showed an upward trend before, and then basically showed a fluctuating downward trend9. From 2011 to 2014, the average utilization rate of China's manufacturing capacity was only 70% to 75%. The capacity utilization rate of most industries was lower than the internationally recognized normal level of 79–82%. Generally speaking, more than 85% indicates insufficient production capacity. Below 75% indicates serious overcapacity. Overcapacity has now become the source of prominent contradictions and many economic problems in the process of structural adjustment of China’s manufacturing industry. Low-level capacity utilization has led to problems such as lower profits, underutilization, business closures, and layoffs. On the other hand, excess capacity will lead to Vicious market competition, waste of resources, and environmental pollution. These negative effects will affect the industrial upgrading by reducing the investment in technological innovation of enterprises, reducing the efficiency of resource allocation in the industry, and insufficient demand for market products, which in turn will affect the high-quality development of the manufacturing industry10.
Sustainable development has become a consensus of mankind. Energy production drives the development of all walks of life. Industrialization in different countries in the world requires more energy and corresponding upstream and downstream processes, which may lead to a significant increase in environmental hazards11. China’s economic development is facing the dual pressures of the structural transformation of the manufacturing industry and the constraints of the ecological environment. The rapid economic development has also brought tremendous pressure to the environment. For the sustainable development of the manufacturing industry, reducing the pollution emissions of the manufacturing industry is very important, and the use of environmental regulation to control pollution has become an inevitable trend12,13. China's manufacturing industry is still at the middle and low end of the industrial value chain, and excess production capacity should be eliminated as much as possible to reduce the impact on the environment. The main goal of environmental issues is to make environmental sustainability the highest priority and to ensure that environmental issues are incorporated into their strategic considerations3, the manufacturing industry is the main body of energy consumption and pollution emissions. The implementation of environmental regulations is conducive to the protection and restoration of China’s natural and living environments, but it also inevitably affects the daily operation of other industries including manufacturing14,15. Appropriate environmental regulation can promote enterprise performance. Environmental regulations will force the technological innovation of the manufacturing industry, and technological innovation will promote the high-quality development of the manufacturing industry by accelerating the transformation of the development mode, optimizing the industrial structure of the manufacturing industry, and improving the international competitiveness of the manufacturing industry2. How will overcapacity affect the high-quality development of manufacturing? Can environmental regulations promote the high-quality development of manufacturing? Is there a non-linear effect? Based on the panel data of 30 provinces and cities in China from 2005 to 2015, this article studies and analyzes the impact of capacity utilization on the high-quality development of the manufacturing industry from the linear and nonlinear perspectives, and establishes a nonlinear threshold regression model to study and analyze the impact of capacity utilization on the high-quality development of manufacturing industry with environmental regulations as the threshold variable. To provide theoretical support for the successful implementation of high-quality development of the manufacturing industry.
Literature review and research hypothesis
The impact of capacity utilization on high-quality development of manufacturing industry
Capacity utilization (CU) is a comprehensive method to measure the degree of overcapacity in an industry. CU of an industry is equal to the ratio of actual output to industrial potential output16, in western countries, overcapacity is a relative concept and an inevitable result of market competition. In a certain time, industries with excess capacity will evolve into balanced industries and become industries with market survival of the fittest and economic environment changes16. From an economic perspective, CU is measured by the ratio of actual economic output to potential economic output17. With the cyclical fluctuations of the economy, overcapacity occurs from time to time. Generally speaking, when a country's domestic supply exceeds effective demand, there will be overcapacity7. Yang's research shows that the CU level of China's manufacturing industry had improved from 2007 to 2010, which means that China's manufacturing industry has expanded production and is closer to capacity during this period. The average CU value of the light industry was higher than that of heavy industry, and the two light industries had extremely high CU values, which shows that the light industry has a serious overcapacity problem3. Wang conducted an empirical investigation on green CU in 28 provinces of the Chinese mainland from 2010 to 2015. The results show that: first, China's high-tech industry shows a good overall performance in green Cu, with the western region having the highest green CU, followed by the central and northeast regions, and the eastern region has the lowest green CU18. Zhou's research shows that local government intervention has a serious negative impact on regional industrial utilization, and the inhibition degree of factor market segmentation on regional industrial utilization is higher than that of commodity market segmentation19. The report of the 19th National Congress of the Communist Party of China pointed out that to build a modern economic system, we must adhere to the principle of quality first and benefit first, take the supply-side structural reform as the mainline, and promote the quality, efficiency and power changes of economic development. The quality development of the manufacturing industry should start from quality, efficiency, and power. Optimize the industrial structure, enhance the innovation ability of the main body, strengthen the element support, and boost the high-quality development of the manufacturing industry2. High-quality development is based on the principle of quality first and benefit first. At present, most of the literature is studying the causes of overcapacity, while there are few studies on the influencing factors of high-quality development of the manufacturing industry. Industrial structure adjustment is an important part of the high-quality development of the manufacturing industry. From the perspective of economic benefits, scholars generally believe that overcapacity has become the root of prominent contradictions and many economic problems in the process of structural adjustment of China's manufacturing industry. Xiong constructed the evaluation index system of high-quality economic development and concluded that the capacity utilization rate has a significant role in promoting the high-quality economic development of China's regions, and the eastern region has the most serious impact on the high-quality economic development, while the western region has the least impact20. Lv's research shows that overcapacity and import volume will hurt enterprise income21. Zheng believes that overcapacity will hurt the economy. A low level of capacity utilization will lead to problems such as lower production costs and reduced management fees. Moreover, overcapacity will lead to vicious competition in the market, waste of resources, and environmental pollution. The resulting negative effects will affect the reduction of enterprise profits and cause foreign investors to withdraw their capital one after another. Therefore, it will affect enterprises' access to foreign technology, Therefore, the investment in technological innovation of enterprises will be reduced. If the technological innovation investment of enterprises is affected, the transformation of enterprises will be difficult, which will affect the upgrading of the manufacturing industry, and ultimately affect the high-quality development of the manufacturing industry10,22. Zheng analyzed the transmission mechanism of the impact of overcapacity on the upgrading of manufacturing industry from three dimensions of enterprise micro aspect, industry meso aspect, and national macro aspect, and came to the conclusion that: in terms of nationwide, the change of capacity utilization rate has a significant positive impact on the upgrading of manufacturing industry; in terms of different types of manufacturing industry, the impact of capacity utilization rate on the upgrading of light industry manufacturing industry is significant For different regions, the eastern region mainly depends on the improvement of the capacity utilization rate of heavy industry manufacturing industry to promote industrial upgrading, while the central and western regions mainly rely on the improvement of the capacity utilization rate of light industry manufacturing industry to promote industrial upgrading10.
Hypothesis H1
Under the condition that other conditions remain unchanged, capacity utilization has a positive impact on the high quality of the manufacturing industry.
The role of environmental regulation in the impact of capacity utilization on the high-quality development of the manufacturing industry
Nowadays, most kinds of literature are studying the causes of overcapacity, and lack of research on capacity utilization from the perspective of environmental regulation. Facing the increasing attention to the current environmental problems, some scholars began to try to study the problem of overcapacity from the perspective of the ecological environment23. The rapid development of China's manufacturing industry also brings about the consumption of resources and the destruction of the environment. Nearly one-third of the global energy consumption and 36% of the carbon dioxide emissions are attributed to the manufacturing industry24. Environmental supervision refers to the situation that the government formulates environmental standards, formulates supervision and punishment means, and solves the negative externality problem of economic entity pollution, to realize the more harmonious development of resources, environment, and economy25. China's industrial economy has a large-scale and complex production structure. Therefore, improving the environmental and economic performance of industrial enterprises has become an important goal of national environmental governance26. Environmental regulation is an important method to control environmental pollution. Environmental regulation can effectively reduce environmental pollution, but also has an impact on capacity utilization. Many scholars have studied the relationship between environmental management and enterprise economic performance. Some enterprises believe that environmental management realizes the win-win of environmental protection and economic performance, but many enterprises believe that environmental management will reduce the income scale of enterprises27. Zhou's research shows that there is a negative correlation between environmental regulation and enterprise financial performance, and the government's environmental regulation policy has a restrictive effect on enterprise financial performance28. Most scholars believe that the environmental laws and regulations implemented by the government will promote the generation of innovative technologies and play a certain role in improving the capacity utilization rate of enterprises29. Some scholars have shown that environmental regulation has a significant impact on overcapacity and industrial structure adjustment. Higher environmental regulation will increase overcapacity, while moderate environmental regulation will optimize industrial structure29. Some scholars believe that environmental governance will directly increase the production costs of enterprises and reduce the opportunities for other investment projects, thus hindering the improvement of capacity utilization1. Kong believes that market incentive environmental regulation has more effectively promoted the improvement of industrial capacity utilization, and proposes to strengthen the positive role of market incentive environmental regulation, timely and moderately improve industrial capacity utilization, and gradually achieve the goal of high-quality industrial development5. Yu studies the impact of environmental regulation intensity on industrial capacity utilization and also studies the compliance cost effect and innovation offset effect of environmental regulation intensity on industrial capacity utilization. It is found that there are significant differences in environmental supervision intensity and industrial capacity utilization among provinces in China, and there is a trend of fluctuation but rising gradually. At the same time, the utilization rate of industrial capacity also has a significant spatial correlation, and the increase of environmental governance can significantly improve the utilization rate of industrial capacity. Environmental regulations can also improve industrial capacity utilization through the innovation offset effect, but the compliance cost effect of environmental regulation is not significant25. Zheng believes that when companies have difficulties in production and operation, they will turn to other industries to seek new profit growth points, which will play an important role in the adjustment of industrial structure, and changes in industrial structure will affect overcapacity. Through the market compulsory mechanism, environmental regulation will not only affect the overcapacity but also adjust the industrial structure29.
Hypothesis H2
Under the condition that other conditions remain unchanged, In the role model of capacity utilization on the high-quality development of the manufacturing industry, environmental regulation has a threshold effect.
The conceptual framework in this study is shown in Fig. 1.

The conceptual framework.
Variable selection and data source
Variable selection
High-quality development of manufacturing industry (quality)
Referring to the index system used by Tang Hongxiang, this article measures the high-quality development of the manufacturing industry from the perspective of economic development quality of the manufacturing industry. As shown in Table 1. Select the development speed, development efficiency, and high-end industrial structure of the manufacturing industry to measure the high-quality development level of the manufacturing industry30. Specifically, the development speed of the manufacturing industry is measured by the growth rate of the manufacturing industry: first, use the output value of the next year of the manufacturing industry minus the output value of the previous year, and then use the obtained value divided by the output value of the previous year; The development benefit is measured by the profit rate of the main business: operating profit divided by the main business income. The high-end industrial structure is measured by the ratio of the output value of the high-end manufacturing industry divided by the output value of the manufacturing industry. The entropy method is used to calculate the weight of each indicator, and then the comprehensive value is obtained through calculation.
The Organization for Economic Cooperation and Development (OECD) divides the manufacturing structure into four types of industries: low-end, mid-low-end, mid-high-end, and high-end industries according to technical levels. This paper refers to the classification method of Fu31, merges high-end and mid-to-high-end industries, and divides manufacturing into three categories. High-end technology industries include general equipment, special equipment, transportation, electrical machinery and equipment, communications, electronics, instrumentation and cultural office machinery, chemical and pharmaceutical industries; mid-end technology industries include petroleum processing, coking, and nuclear fuel processing industries, rubber, Plastics, non-metallic minerals, golden metal smelting, non-ferrous metal smelting, and metal products industries31.
- Step 1::
-
Standardization of indicators
This article selects 11 years, 30 regions, and 3 indicators, \({X}_{\theta ij}\) is the value of the \(j\)-th index in the \(i\)-th area in year \(\theta \) (\(i=\mathrm{1,2}..,30; \; \; j=\mathrm{1,2},\dots ,11\)). Since the measurement units of the various indicators are not uniform, before using them to calculate the comprehensive indicators, they must be standardized, that is, the absolute value of the indicator is converted into a relative value.
Since the three indicators in this analysis are all positive indicators, we only analyze the positive indicators:
$$\begin{array}{c}{x}_{\theta ij}^{\mathrm{^{\prime}}}=\frac{{x}_{\theta ij}-min\left\{{x}_{\theta 1j},\ldots ,{x}_{\theta 30j}\right\}}{max\left\{{x}_{\theta 1j},\ldots ,{x}_{\theta 30j}\right\}-min\left\{{x}_{\theta 1j},\ldots ,{x}_{\theta 30j}\right\}}\end{array}$$(1) - Step 2::
-
Determine the weight of the indicator
Calculate the proportion of the \(j\)-th indicator in the \(i\)-th area in year \(\theta \) of the indicator:
$$\begin{array}{c}{y}_{\theta ij}=\frac{{x}_{\theta ij}^{\mathrm{^{\prime}}}}{{\sum }_{\theta }{\sum }_{i}{x}_{\theta ij}^{\mathrm{^{\prime}}}}\end{array}$$(2) - Step 3::
-
Calculate the entropy value of the \({\varvec{j}}\)-th index
$$\begin{array}{c}{e}_{j}=-k{\sum }_{\theta }{\sum }_{i}{y}_{ij}ln\left({y}_{\theta ij}\right)\end{array}$$(3)$$\begin{array}{c}k>0,k=ln\left(m\right),m=3\end{array}$$(4)Note: To avoid the situation where \(k=ln\left(0\right)\) cannot be calculated, the displacement method is used here, the amount of displacement is + 0.00001, that is:
When \({y}_{\theta ij}=0:\)
$$\begin{array}{c}{e}_{j}=-k{\sum }_{\theta }{\sum }_{i}{y}_{ij}ln\left({y}_{\theta ij}+0.00001\right)\end{array}$$(5) - Step 4:
-
Calculate the information utility value of the \({\varvec{j}}\)-th index
$$\begin{array}{c}{g}_{j}=1-{e}_{j}\end{array}$$(6)After the above calculations, calculate the average value of the manufacturing high-quality development scores of each province and city in each year and then plot the average value of the high-quality development index of the manufacturing industry in each year as shown in Fig. 2.
Figure 2 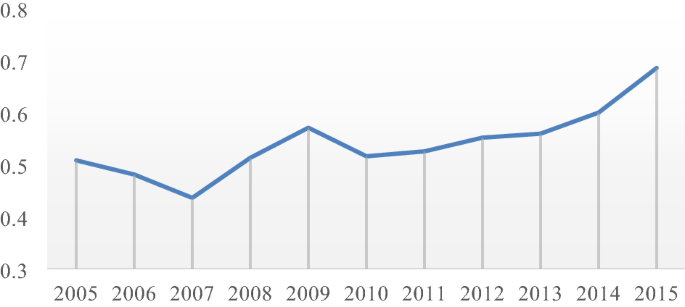
The overall development quality score of China's manufacturing industries.
The overall development quality score of China's manufacturing industry is low, ranging from 0.43 to 0.68 in 2005–2015, and the lowest score index in 2007 was 0.435. Since 2010, the overall development quality of the manufacturing industry has gradually begun to grow slowly. It shows that the structural transformation and high-quality development of the manufacturing industry have become the mainstream consciousness in China.

Capacity utilization (CU)
This paper uses the input-based bcc model in DEA to measure China's regional capacity utilization rate. The production function used in this paper includes one output—the total output value of manufacturing, and three inputs—fixed capital, labor, and intermediate inputs. The algorithm of the fixed capital stock refers to the algorithm of Zhang32, using the perpetual inventory method to estimate.
Specifically, \({K}_{t-1}\) and \({K}_{t}\) respectively represent the stock of fixed capital in period \(t-1\) and the stock of fixed capital in period \(t\), \({\delta }_{t}\) represents the depreciation rate in period \(t\), \({I}_{t}\) represents the amount of new investment in period t, \({P}_{t}\) represents the price index of investment products; The number of employees in the secondary industry is selected as a measure of labor input. The annual average value of fixed assets is used as a measure of intermediate input33.
Refer to the algorithm of Shen34, this paper uses \(Y\) to represent the capacity output, which means the ideal output of the overall decision-making unit under the condition of optimal technical efficiency. The fixed factor of production input is denoted as \(F\), and the production capacity is denoted as \(Y(F)\). Use \(y\) to represent the actual output of the decision-making unit, the extent to which production capacity can be converted into actual output depends on the technical level \(TE\) and the variable production factors of input \(V\). Therefore, the actual output is expressed as:
Use the technical efficiency measured by the DEA method to replace the technical level \(TE\), therefore, the actual output can also be expressed as:
According to the foregoing description, the capacity utilization rate \(CU\) is the ratio between the actual output and the production capacity, which is:
\(Y(F,V)/Y(F)\) can be understood as the utilization of equipment under the constraints of variable input elements. The equipment utilization rate is expressed in \(EU\), which is:
For \(Y(F,V), Y(F)\), we use a variable return to scale method DEA-BCC for measurement:
\({\lambda }_{i}\) is the weight vector, n is the number of production units, i represents each production unit, \(\sum_{i=1}^{N}{\lambda }_{i}=1\) means that the return to scale is variable.
After calculation, the capacity utilization rate of each region from 2005 to 2015 is obtained. Take the average value of the capacity utilization rate of each region and plot it as shown in Fig. 3:

The average value of the capacity utilization rate of each region. The different colors represent the average value of the capacity utilization rate of each region, the color layer was created by the ArcGIS Pro 2.8. (https://pro.arcgis.com/en/pro-app/latest/get-started/download-arcgis-pro.htm).
It can be seen that the general capacity utilization rate in eastern China has a high score, mostly above 0.8. Most provinces in the remaining regions have low scores, and many regions are below 0.6. This shows that most provinces and cities in China still have overcapacity.
Environmental regulation (ER)
This article uses comprehensive indicators to measure the intensity of environmental regulations. Three indicators: the ratio of the operating cost of waste gas treatment facilities to the industrial output value, the ratio of the operating cost of wastewater treatment facilities to the industrial output value, and the comprehensive utilization rate of solid waste are used to calculate the intensity of environmental regulations35.
The calculation method for the intensity of environmental regulations is as follows:
First, standardize each indicator to reduce the influence of extreme values and dimensional differences; then take the average value of the standardized indicators. The specific calculation process is as follows:
Among them, \(h{g}_{ij}^{w}\) is the standardized value of category \(j\) indicators in the \(i\) area, \(h{g}_{ij}\) represents the original value of category \(j\) indicators; \(\mathrm{min}\left(h{g}_{j}\right)\) is the minimum value of category \(j\) indicators, and \(\mathrm{max}(h{g}_{j})\) is the maximum value of category \(j\) indicators.
Control variables
To control the impact of other variables on the high-quality development of the manufacturing industry, this paper selects profitability, foreign investment, and government participation as the control variables.
Profitability (PS): Manufacturing companies have a good level of profitability, which is the key to the sustainable development and stable operation of the manufacturing industry. This article takes the total profit of industrial enterprises above the designated size as the proxy variable of the profitability of the manufacturing industry36.
Foreign investment (FDI) Foreign investment can not only promote economic growth but also bring about technological spillovers, thereby accelerating technological progress13. FDI is mainly concentrated in the high- and mid-end technology industries of the manufacturing industry. The development quality of high-end technology manufacturing is the key to the high-quality development of the manufacturing industry. Expressed by the amount of foreign investment utilized by each province.
The degree of government participation (GP)
The development of the manufacturing industry is inseparable from the government's financial support. The strategic layout formulated by the local government for the development of the manufacturing industry is the key to the development of the manufacturing industry, and fiscal expenditures have a driving effect on the development of the manufacturing industry. The degree of government participation (GP) is expressed by the ratio of local government fiscal expenditure to GDP37.
The descriptive statistics of each variable are shown in Table 2.
Data sources
Because of the consistency of the unified caliber and the basic data (due to lack of data in Tibet and Taiwan), this article uses panel data from 30 provinces and cities in China from 2005 to 2015, data from China Statistical Yearbook, "China Industrial Statistical Yearbook", "China Statistical Yearbook"," China Industrial Economic Statistical Yearbook", "China Environmental Statistical Yearbook"," China Science and Technology Statistical Yearbook", WIND Database.
Metrology economics model construction
Panel regression model construction
The panel regression model constructed in this paper is as follows:
The Quality is the interpretation variable, which represents the high-quality development of the manufacturing industry; CU is the core interpretation variable, which represents capacity utilization; ER is environmental regulation, GP, FDI, and PS are control variables, representing the degree of government participation, foreign investment, Profit status. \(i\) means each province; \(t\) represent the year; \(\varepsilon \) is a random variable, and \({\beta }_{1}-{\beta }_{4}\) is the coefficient of each variable.
Note: Because of these variables, the four indicators: Quality, ER, CU, and GP are all calculated rates of change, not horizontal quantities. Therefore, the logarithm of these four indicators is not taken in the regression model.
Threshold regression model construction
To further explore the impact of the capacity utilization rate on the manufacturing industry at different environmental regulation strengths, with the environmental regulation (ER) as the threshold variable, based on the data existing herein, this article establishes a single threshold regression model and the double threshold regression model as follows:
In the model, I represent an indication function (when the condition is satisfied, its value is 1, otherwise it is 0), \({Quality}_{it}\) is the dependent variable, representing the high-quality development of the manufacturing industry; \({CU}_{it}\) is the independent variable, representing the capacity utilization rate; \({ER}_{it}\) is the threshold variable, representing the intensity of environmental regulations; \({GP}_{it}\), \({FDI}_{it}\), \({PS}_{it}\) are control variables, indicating the profit status, foreign investment, and government participation; \({\mu }_{i}\) is an individual effect of each region; \({\varepsilon }_{it}\) is a random error.
Empirical results and analysis
Panel data analysis results
This article uses mixed regression, fixed effects, and random effects to process the data. For fixed effect, F statistic is to test all the individual effect overall significance, F statistic probability is 0.0000, the test results show that the fixed effect model is better than mixed OLS model. For random effects, the LM test obtains the value of P 0.0000, indicating that the random effect is very significant, and the random effect model is also superior to the mixed OLS model. As a comparison, the MLE estimation of the random effect model, the LR test p-value is 0.0000, and the individual random effect is considered to exist, and the random effect is also proved to be superior to mixed regression. In the selection of random effect model and fixed-effect model, Hausman tested p-value > 0.05 and thought that random effect model RE is better than fixed-effect model FE, so this article uses random effect model RE estimation results for analysis. The results are shown in Table 3.
According to the random effect RE estimate, capacity utilization has a significant positive effect on the high-quality development of the manufacturing industry, with a coefficient of action of 0.1723 (0.0728) and a 5% test, hypothesis H1 is proven. This shows that the improvement of production capacity utilization in various regions has promoted the development speed, development benefits, and structural optimization of the manufacturing industry, and promoted the high-quality development of manufacturing. Environmental regulation has a significant negative effect on the high-quality development of the manufacturing industry, with a coefficient of − 0.0740 (0.0328) and passed the 5% test; This shows that strict environmental regulations have aggravated the company's high energy consumption, high pollution, and negative impact on the production capacity of manufacturing high-quality development. The level of profitability, foreign direct investment, and government participation all have significant positive effects on the high-quality development of the manufacturing industry. (Passed 10%, 5%, 1% tests, respectively). This shows that the manufacturing industry has a good level of profitability is conducive to the high-quality development of the manufacturing industry, the expansion of FDI can be called an important economic means of manufacturing development, The advanced equipment and management concepts that accompany FDI promote the development of manufacturing industry, and the participation of local governments is conducive to the integration of resources of manufacturing enterprises and the high-quality development of manufacturing industry.
Threshold regression result analysis
In this article, the nonlinear relationship between the high-quality development of the manufacturing industry is empirically tested under the condition that environmental regulation is the threshold variable. Based on Hansen's threshold effect regression model estimation method, the threshold estimates and related parameters are obtained38. This mainly includes the use of Bootstrap (self-sampling) method to construct F statistics and P values to test the significance of threshold effect; Using LR (seemingly proportional) statistics to verify the veracity of whether the threshold estimate is equal to the true value, Hansen estimated the confidence interval of LR(q). In cases where the significance level is \(\alpha \), the original hypothesis cannot be rejected when \(LR\left(q\right)\le -2\mathrm{ln}(1-\sqrt{1-\alpha })\). In general, the statistical threshold for LR is 7.3523 at the \(\alpha \) at a significance level of 5%. The single threshold and double threshold are tested respectively to determine the number of threshold values and model types. The threshold effect test results are shown in the Table 4. The single threshold effect passed the 5% significance test, and the double threshold effect was not significant. Therefore, in the model of high-quality development effect of capacity utilization on the manufacturing industry, there is a single threshold value of environmental regulation, and the threshold estimate is 0.6727. The threshold estimate and confidence interval are shown in Table 5.
The estimation results of threshold regression model parameters are shown in Table 6, for the core explanatory variable capacity utilization rate and threshold variable environmental regulation, when the environmental regulation is less than the threshold estimate (0.6727), the capacity utilization rate has a significant positive impact on the high-quality development of the manufacturing industry, the coefficient of action is 0.2248 (0.031); When the environmental regulation is greater than the threshold value (0.6727), the capacity utilization rate has a non-significant positive effect on the high-quality development of the manufacturing industry, and the coefficient of action is 0.1416 (0.183), hypothesis H2 is proven.
For the control variables, in the threshold regression model, the profit situation has a significant positive influence on the high-quality development of the manufacturing industry, and the coefficient of action is 0.0123 (0.041); Foreign direct investment has a significant positive effect on the high-quality development of manufacturing industry, with a factor of 0.0574 (0.000) and a positive effect of government participation on the high-quality development of manufacturing industry, with a factor of action of 0.1249 (0.470).
To verify the authenticity of the threshold estimation, the following uses the LR (likelihood ratio) statistic to the consistency of the dual-threshold estimates to the real value. After the threshold effect test, to more clearly and intuitively understand the double threshold estimation and confidence interval, the LR function diagram is used to test the authenticity and confidence interval of the double threshold estimation, as shown in Fig. 4.

Likelihood ratio function graph of threshold 0.6727.
Due to the obvious differences in environmental governance and manufacturing development in various regions of China, the single threshold effect of environmental regulation is analyzed to analyze the distribution between different regions. Table 7 shows that in 2005-2015, the number of areas with high environmental regulations in china's provinces and cities increased first and then decreased. Most of China's provinces and cities over the years in the low environmental regulation intensity range (ER ≤ 0.6727), 2006–2010 in the high environmental regulation intensity (ER > 0.6727) significantly increased. In 2007 and 2009, the largest number of areas were in high environmental regulation, accounting for 29% (30 provinces and municipalities). From the perspective of regional distribution, the proportion of the western region is the largest, and the proportion of the central region is in high environmental regulations.
Conclusions and practices
Based on the panel data of 30 provinces and cities in China from 2005 to 2015, this article analyzes the impact of capacity utilization on the high-quality development of the manufacturing and establishes a nonlinear threshold regression model on this basis, and studies and analyzes environmental regulations as a threshold variable Under the influence of capacity utilization rate on the high-quality development of the manufacturing industry. The research results show that: capacity utilization, profitability, foreign direct investment, and government participation all have a significant positive impact on the high-quality development of the manufacturing industry; environmental regulations have a significant negative impact on the high-quality development of the manufacturing industry. And in the model of the effect of capacity utilization on the high-quality development of the manufacturing industry, environmental regulation has a single threshold effect. With the increase in the intensity of environmental regulation, the coefficient and significance of the effect of capacity utilization on the high-quality development of the manufacturing industry have changed. From a significant positive impact to an insignificant positive impact, and the coefficient of action gradually decreases.
Based on the above empirical research conclusions, combined with the development status of China's manufacturing industry, the management revelation and countermeasures for promoting high-quality development of manufacturing industry are proposed as follows: (1) The production capacity utilization has a remarkable positive impact on the high-quality development of manufacturing, and overcapacity will hinder the high-quality development of manufacturing. In recent years, the excess capacity of my China’s has been improved, and some areas also need to combine the background of high-quality development and use strong means to relieve overcapacity. (2) Establishing the environmental regulation intensity of China's national conditions, optimizing environmental protection and capacity governance, properly strengthening environmental governance in China, maximizing the role of stimulating environmental regulation in the manufacturing industry. (3) The manufacturing enterprise has a good profit level is the key to the sustainable development of the manufacturing industry, and the manufacturing enterprise should formulate the correct strategic plan to adjust the management model to ensure the quality of business and profitability. (4) Optimize the FDI structure, formulate relevant policies, guide and encourage FDI investment, introduce foreign advanced equipment technology, patents, etc., encourage foreign-invested to help to manufacture high-quality developments such as information technology. (5) Government participates in the integration of manufacturing integration resources in various regions, and the Government should support manufacturing innovation and support the investment of traditional enterprise research funds, and support the new model of the manufacturing industry.
Limitation and further research
This paper only studies the relationship between capacity utilization, environmental regulation and high-quality development of manufacturing industry. There are many related factors that will have an impact on high-quality development of manufacturing industry, which have not been fully considered. Other factors will be added to analyze in future research. This paper is only based on the Chinese background. Environmental issues are also the focus of research in many countries, and will be further improved in the future research.
References
Cheng, Z. et al. The effect of environmental regulation on capacity utilization in China’s manufacturing industry. Environ. Sci. Pollut. R. 27, 14807–14817 (2020).
Yang, R. F. & Zheng, Y. Y. Environmental regulation, technological innovation and high-quality development of manufacturing industry. Statis. Infor. Forum. 35, 73–81 (2020).
Yang, G. L., Fukuyama, H. & Song, Y. Y. Estimating capacity utilization of Chinese manufacturing industries. Socio-Econ. Plan. Sci. 67, 94–110 (2019).
Yu, D. H. & Sun, T. Environmental regulation, skill premium and international competitiveness of manufacturing industry. Chin. Ind. Econ. 5, 35–53 (2017).
Kong, M., Liu, S. & Jin, D. C. Promotion or inhibition: The impact of environmental regulation on industrial capacity utilization. East Chin. Econ. Man. 35, 66–75 (2021).
Liu, H., Li, P. & Yang, D. H. Export fluctuation and overcapacity in China’s manufacturing industry—The inspection of the causes capacity from the perspective of external demand. Chin. Financ. Econ. Rev. 5, 11 (2017).
Du, W. J., Wang, F. M. & Li, M. J. Effects of environmental regulation on capacity utilization: Evidence from energy enterprises in China. Ecol. Indic. 113, 106217 (2020).
Chen, H., Zhong, T. Y. & Lee, J. Y. Capacity reduction pressure, financing constraints, and enterprise sustainable innovation investment: Evidence from Chinese manufacturing companies. Sustainability. 12, 10472 (2020).
Jia, R. S. & Hu, Q. Y. Market concentration, spatial concentration and China's manufacturing capacity utilization rate - empirical research based on micro-enterprise data. Man. World. 25–35. https://doi.org/10.19744/j.cnki.11-1235/f.2016.12.004 (2016).
Zheng, J. J. et al. Influence of capacity utilization rate on regional manufacturing industrial upgrading. Econ. Geogr. 36, 83–92 (2016).
Mohamadi-Baghmolaei, M. et al. Evaluation of hybridized performance of amine scrubbing plant based on exergy, energy, environmental, and economic prospects: A gas sweetening plant case study. Energy 214, 118715 (2021).
Shen, L. et al. Impacts of environmental regulation on the green transformation and upgrading of manufacturing enterprises. Int. J. Environ. Public Health. 17, 7680 (2020).
Sun, H. B., Liu, Z. L. & Chen, Y. C. Foreign direct investment and manufacturing pollution emissions: A perspective from heterogeneous environmental regulation. Sustain. Dev. 28, 1376–1387 (2020).
Wei, P. & Yu, Y. S. The impact of environmental regulation on the upgrading of the industrial structure of the manufacturing industry—GMM analysis system based on provincial dynamic panel data. Inq. Econ. Issues. 38, 144–152 (2017).
Guo, X. B. The Impact Research of Environmental Regulations on the Structural Upgrading of Manufacturing Industry—Analysis on path and panel data model. Inq. Econ. Issues. 40, 148–158 (2019).
Ju, Y. P. & Wang, X. H. Understanding the capacity utilization rate and overcapacity of China’s coal industry and interprovincial heterogeneity. IEEE Access. 7, 111375–111386 (2019).
Sen Rino, T. H.& Tine, O. C. A simulation study of capacity utilization to predict future capacity for manufacturing system sustainability. In ICEED Vol. 109, 012020, (2017).
Wang, Y. et al. A framework for assessing green capacity utilization considering CO2 emissions in China’s high-tech manufacturing industry. Sustainability. 12, 4424 (2020).
Jiang, Z. et al. Market segmentation and industry overcapacity considering input resources and environmental costs through the lens of governmental intervention. Environ. Sci. Pollut. Res. 24, 21351–21360 (2017).
Xiong, S. Y. & Wang, X. Y. Overcapacity, technological innovation and high-quality development of China’s economy. Stat. Dec. 36, 86–90 (2020).
Lv, J. Y., Wang, T. & Li, P. L. The impact of overcapacity and surging imports on the earnings of domestic coal companies. J. Interdiscip. Math. 5, 1339–1344 (2018).
Wu, Y. et al. The conduction mechanism and effect of industry upgrading upon capacity utilization with the view of technological innovation. Sci. Decis. Making. 2019, 47–71 (2019).
Du, W. J. Environmental regulation, enterprise heterogeneity and state-owned enterprises’ overcapacity management. Ind. Econ. Res.. https://doi.org/10.13269/j.cnki.ier.20181122.008 (2018).
Yuan, B. L., Ren, S. G. & Chen, X. H. Can environmental regulation promote the coordinated development of economy and environment in China’s manufacturing industry? A panel data analysis of 28 sub-sectors. J. Clean. Prod. 149, 11–24 (2017).
Yu, B. B. & Shen, C. Environmental regulation and industrial capacity utilization: An empirical study of China. J. Clean. Prod. 246, 118986 (2020).
Liu, R., He, F. & Ren, J. Promoting or inhibiting? The impact of enterprise environmental performance on economic performance: Evidence from China’s large iron and steel enterprises. Sustainability. 13, 6565 (2021).
Zhang, Q. & Ma, Y. The impact of environmental management on firm economic performance: The mediating effect of green innovation and the moderating effect of environmental leadership. J. Clean. Prod. 292, 126057 (2021).
Zhou, B. et al. Environmental regulation and financial performance of Chinese listed companies. PLoS ONE 15, e0244083 (2020).
Zheng, C. S., Zhang, Y. & Chen, K. M. Corporate innovation and capacity utilization in China’s coastal areas: Governance under the context of environmental regulation. J. Coastal Res. 109, 197–205 (2020).
Tang, H. X. et al. The comprehensive development and interactive development of China’s manufacturing industry’s development quality and international competitiveness. China Soft. Sci. 2019, 128–142 (2019).
Fu, Y. H., Ye, X. S. & Wang, Z. X. The selection of technology progress path of manufacturing structure optimization—An empirical analysis based on dynamic panel data model. China Ind. Econ. 9, 78–90 (2014).
Zhang, J., Wu, G. Y. & Zhang, J. P. The estimation of China’s provincial capital stock: 1952–2000. Econ. Res. J. 10, 35–44 (2004).
He, H. L. & Zhang, M. Empirical research on central-provincial governmental relationship, local protection and capacity utilization in China. Soft Sci. 32, 10–13 (2018).
Shen, J. X. & Liu, Y. C. Capacity utilization of strategic emerging industries and its influencing factors: The case study of the new generation information technology industry. Forum Sci. Technol. China. https://doi.org/10.13580/j.cnki.fstc.2019.03.006 (2019).
Wang, Z. Y., Cao, Y. & Lin, S. L. The characteristics and heterogeneity of environmental regulation’s impact on enterprises’ green technology innovation—Based on green patent data of listed firms in China. Stud. Sci. Sci. 39(5), 909 (2021).
Shi, X. A. et al. The influence of “internet+ ” on value chain upgrading of China’s manufacturing. Stud. Sci. Sci. 36, 1384–1394 (2018).
Shi, X. A., Ji, L. Y. & Cheng, Z. H. Influence of “internet+” on transformation and upgrading of Chinese manufacturing industry-based on the national 2003–2014 provincial panel data. Sci. Tech. Prog. Pol. 34, 64–71 (2017).
Hansen, B. E. Threshold effects in nondynamic panels: Estimation, testing and inference. J. Econom. 93, 345–368 (1999).
Acknowledgements
This research was supported by the Special Project of Philosophy and Social Sciences Research of Heilongjiang (grant number 19GLD231), the National Social Science Foundation of China Project (grant number 14AGL004), the Key projects funded by the National Social Science Foundation (grant number 19FGLA001).
Author information
Authors and Affiliations
Contributions
H.W.: data curation, writing—original draft preparation. B.L.: writing—reviewing and editing.
Corresponding author
Ethics declarations
Competing interests
The authors declare no competing interests.
Additional information
Publisher's note
Springer Nature remains neutral with regard to jurisdictional claims in published maps and institutional affiliations.
Rights and permissions
Open Access This article is licensed under a Creative Commons Attribution 4.0 International License, which permits use, sharing, adaptation, distribution and reproduction in any medium or format, as long as you give appropriate credit to the original author(s) and the source, provide a link to the Creative Commons licence, and indicate if changes were made. The images or other third party material in this article are included in the article's Creative Commons licence, unless indicated otherwise in a credit line to the material. If material is not included in the article's Creative Commons licence and your intended use is not permitted by statutory regulation or exceeds the permitted use, you will need to obtain permission directly from the copyright holder. To view a copy of this licence, visit http://creativecommons.org/licenses/by/4.0/.
About this article

Cite this article
Wang, H., Li, B. Environmental regulations, capacity utilization, and high-quality development of manufacturing: an analysis based on Chinese provincial panel data. Sci Rep 11, 19566 (2021). https://doi.org/10.1038/s41598-021-98787-y
Received:
Accepted:
Published:
DOI: https://doi.org/10.1038/s41598-021-98787-y
This article is cited by
-
Numerical simulation and tool parameters optimization of aluminum alloy transmission intermediate shell
Scientific Reports (2024)
-
The rising of house prices and the global value chain position of China’s manufacturing sector
Environment, Development and Sustainability (2024)
-
Research on the measurement of high-quality development of tourism: a case study of Heilongjiang Province, China
Environment, Development and Sustainability (2023)
-
Land resources, market-oriented reform and high-quality agricultural development
Economic Change and Restructuring (2023)
-
Can Digitalization Improve the High-quality Development of Manufacturing? An Analysis Based on Chinese Provincial Panel Data
Journal of the Knowledge Economy (2023)
Comments
By submitting a comment you agree to abide by our Terms and Community Guidelines. If you find something abusive or that does not comply with our terms or guidelines please flag it as inappropriate.
