
Abstract
This study presents a systematic review and meta-analysis over the findings of significance of correlations between weather parameters (temperature, humidity, rainfall, ultra violet radiation, wind speed) and COVID-19. The meta-analysis was performed by using ‘meta’ package in R studio. We found significant correlation between temperature (0.11 [95% CI 0.01–0.22], 0.22 [95% CI, 0.16–0.28] for fixed effect death rate and incidence, respectively), humidity (0.14 [95% CI 0.07–0.20] for fixed effect incidence) and wind speed (0.58 [95% CI 0.49–0.66] for fixed effect incidence) with the death rate and incidence of COVID-19 (p < 0.01). The study included 11 articles that carried extensive research work on more than 110 country-wise data set. Thus, we can show that weather can be considered as an important element regarding the correlation with COVID-19.
Introduction
COVID-19 has impacted significantly over the human society in recent times1,2,3,4. More than 25 million population is already infected and over 0.8 million are already died of by the COVID-195. Scientific organizations are currently involved in the development of possible vaccines to further stop the deadly spread of COVID-196,7,8,9,10,11,12,13,14,15. Weather conditions always play important roles to the enhancement or eradication of health issues16,17,18,19. Thus, we can look for finding answer of the research question: whether weather has any correlation with COVID-1920.
A study21 was conducted to find the possibility of correlation between weather parameters with COVID-19. However, the comments didn’t conform to specific answer of weather impact on COVID-19. A study was conducted to test the impact of temperature on Australia and Egypt as a case study22. It suggested that there is a relation between temperature and COVID-19. A systematic review was performed where advocacy was made in favour of low evidence for impact of temperature and humidity on COVID-1923. No meta-analysis was done in this work. Harmooshi et al.24 investigated a generic review of 16 articles having some outcome-based impact over COVID-19. This work suggested that cool weather may affect transmissibility of COVID-19. In25, a prediction model was investigated for India in stating probable condition in 2020 due to COVID-19. Weather impact was found in Turkey over a 14-day long study26,27 suggested that incidence of COVId-19 could lower with high temperature and high wind speed. Thus, we can see that different articles stated their own point of view via various methods while resulting into confusion.
Methods
In this paper, we present first ever meta-analysis of impacts of weather on the death and incidence on the COVID-19. Initially, we selected vital articles from digital repositories to find resourceful information. Thus, we performed a systematic review upon proper inclusion and exclusion criteria. Secondly, we used risk assessment of the included articles in this study. Thirdly, we performed evidence certainty tests of such articles to find suitability over the significant impact analysis of weather over COVID-19. We selected five weather parameter such as, temperature, humidity, rainfall, ultra violet and wind speed to find correlation with the death rate and incidence of the COVID-19. Fourthly, we performed forest and funnel plots to investigate the heterogeneity and publication bias, respectively.
Search strategy
A comprehensive literature survey was conducted while considering articles from the following digital databases such as, PubMed, Sciencedirect, IEEE Xplore, Google Scholar, and Cochrane. We used a set of combination of key words to search the articles as shown in Table 1. One independent author (PPR) performed screening of abstract and titles of the literature against the aforementioned keyword and scope of the study. Other author (PM) did the review of final selection of the articles. Evaluation of full-texts were conducted against the inclusion and exclusion criteria.
Study selection
The work was done as per the Preferred Reporting Items for Systematic Reviews and Meta-Analyses (PRISMA) guidelines28. We conducted a qualitative analysis of the 11 included articles in this study based on publication year, zone or country of work, various variables used, key techniques used and remarks on the observations. Figure 1 presents the PRISMA of the meta-analysis. Inclusion of articles depends on the availability of correlation factors in the surveyed articles. We have included those studies that only discusses about the correlation between weather parameters to COVID-19. We also, seek for the relevance of performed studies in the article to prescribe some key suggestions. Further, we include those articles that are full-text published but not from the medRxiv repository for meta-analysis. We focused on the quantitative synthesis of statistical approaches used in the articles. We excluded all the articles which are published in non-indexed journals and don’t conform to the direct correlation perspective of COVID-19 with weather factors. Due to lack of minimal availability, we exclude the correlating parameters related to the pollution, air quality index (AQI), pollination, and sun light intensity as the weather parameters in this meta-analysis.

PRISMA flowchart for the study.
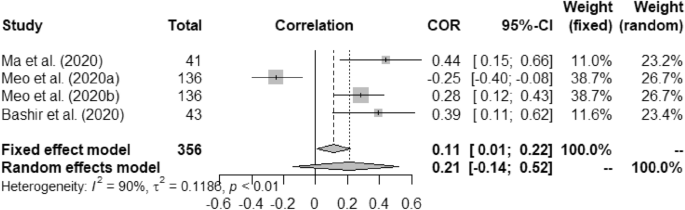
Forest plot of COVID-19 death rate with temperature.
Assessment of risk of bias
We assessed the quality of the articles selected in this study by using the Joanna Briggs Institute (JBI) tool29. The checklist contained eight questions such as (a) were the criteria for inclusion in the sample clearly defined, (b) were the study subjects and the setting described in detail, (c) was the exposure measured in a valid and reliable way, were objective, (d) standard criteria used for measurement of the condition, (e) were confounding factors identified, (f) were strategies to deal with confounding factors stated, (g) were the outcomes measured in a valid and reliable way and (h) was appropriate statistical analysis used. Each of the question was examined against each of the 11 articles and answer was given in ‘Yes’ and ‘No’. Overall risk was finally specified at the bottom of Table 2 with two main answers such as, ‘Low’ and ‘Moderate’. Both the authors (PPR and PM) independently evaluated risk and quality of each study and confusion was mitigated by a consensus team meeting.
Data extraction and outcome measure
Data was extracted for following variables such as, (a) temperature, (b) humidity, (c) rainfall, (d) ultra violet (UV) radiation and (e) wind speed. We considered two key COVID-19 parameters such as, (a) death rate and (b) incidence. Thus, five key weather elements were used to find association with two COVID-19 parameters for performing meta-analysis on possible weather impact on COVID-19. Solar radiation and UV radiation were assumed to be same by considering SI unit i.e. W-m-2. We considered relative humidity out of absolute and relative humidity while performing this meta-analysis. Major characteristics of the included studies rely in the recently performed correlation assessment between the weather parameters with the incidence or death rate of COVID-19. Further, we considered the evaluation criteria as mentioned in the articles to provide the meta-analysis.
Certainty measure
The GRADE (Grading of Recommendations Assessment, Development, and Evaluation)30 approach was used to evaluate the quality of evidence for each outcome as shown in Table 3. We tested 7 outcomes on the correlations between (a) temperature and COVID-19 death rate, (b) humidity with COVID-19 death rate, (c) temperature with COVID-19 incidence, (d) humidity with COVID-19 incidence, (e) rainfall with COVID-19 incidence, (f) UV with COVID-19 incidence, and (g) wind speed with COVID-19 incidence. We found the impact of each of the outcomes. We also measured the evidence of certainty using ⊕ AND/OR◯ combination of four symbols in terms of ‘Moderate’, ‘High’, and ‘Very High’. The points in the GRADE analysis are considered as follows. Very High point is given to the correlation factor that shows the highest order significance among all the included works. Similarly, High point is given to those parametrization aspects where we notice strong evidence of measure. We give Moderate as the lowest measure to the correlating perspective having lowest of significance.
Statistical analysis
Accessed data from 11 articles were initially recorded into the excel datasheet which was later segregated into 7 different comma separated value CSV) files for feeding into the RStudio version 3.4.3 with package meta. We used metacor(cor = r, n = N, data = d, studlab = Author, sm = "ZCOR") method call to perform the fixed-effect and random effect model study. We used Fisher’s z transformed correlations to find meta-analysis. Here, r, N and d represent the CSV columns named as r, N and the CSV itself, respectively. Where, r and N (sample size) of the specific CSV stored the correlation values in ( +) and/or (-) terms and days of experiment by individual article, respectively. 95% confidence interval (CI) was measured for each of the articles. Wang et al. (2020a), Wang et al. (2020b), Meo et al. (2020a), and Meo et al. (2020b) were sub-set wise used of the Wang et al. (2020) and Meo et al. (2020) articles, respectively. Fixed and random weight of each of the article was computed. We found heterogeneity (I2) and τ2 as the level of heterogeneity and measure of dispersion of true effect sizes under the given assumptions that the true effect sizes were bell-shaped and normally distributed, respectively. We used the forest() method to derive the forest plots for seven different scenarios of correlation meta-analysis with help of the Fisher's z transformed correlations.
Results
Study selection and characteristics
The article reporting and record keeping task was finalized on August 6, 2020. All the included papers belong to the initial to recent COVID-19 impacts i.e. December 1, 2019–June 5, 2020. Based on initial record screening, we found 453 articles. We remove 381 irrelevant articles and later moved with 72 records. Due to irrelevance to weather parametric data selection, measurement and study approaches, we excluded 27 articles. Out of 45 articles, upon full-text screening we found improper statistical data and insignificant association between weather and COVID-19, we rejected 14 articles. Rest of the 37 articles were focused on wither parametric or description statistical association study between the weather and COVID-19. However, 23 were found to be nonconclusive toward correlation between weather and COVID-19 which were later on rejected. Out of 14 articles, only 11 were finally included in this meta-analysis. All the studies discussed about some sort of correlation factor with one or more weather parameters comprising of temperature, humidity, rainfall, UV and wind speed with the COVID-19 death rate or incidence level in various parts of globe. The articles conducted studies in different zones of countries belonging to Wuhan, China, mainland China, India, USA, Japan, Jakarta, Indonesia, Australia, Canada, Iran and more than 110 countries. The article mainly used the Pearson’s correlation coefficient, cohort study, Spearman’s rank correlation logarithmic estimation, generalized additive model (GAM) and Fama–Macbeth regression statistical techniques. Out of 11 only 1 article remarked about the basic reproduction number i.e. R0 in conjunction to the weather parameters for possible impact on the COVID-19 incidence.
Survey of articles
Table 4 presents the comparison between the articles included in this study. Wang et al. (2020a) and Wang et al. (2020b) represent a single article but two different works related to China and USA. Similarly, Meo et al. (2020) performed studies on 10 hottest and 10 coolest countries, thus two versions of citations were used into the further works such as Meo et al. (2020a) and Meo et al. (2020b) representing hot and cool countries, respectively.
Overall outcomes
Table 5 presents overall outcome from this study. Correlation between the temperature and COVID-19 death rate was measured as (a) fixed effect model: 0.11 (95% CI, 0.01–0.22) and (b) random effect model: 0.21 (95% CI − 0.14–0.52) with p < 0.01. Similarly, humidity and COVID-19 correlation were measured as − 0.13 (95% CI, − 0.23- 0.03) and − 0.13 (95% CI, − 0.23–0.03) for fixed and random effect model, respectively against p-value at 0.53.
In case of weather and COVID-19 incidence correlation aspect, we found that temperature had 0.22 (95% CI, 0.16–0.28) and 0.23 (95% CI, 0.01–0.42) for fixed and random study, respectively. We found that humidity had positive correlation with the COVID-19 incidence at p < 0.01. Rainfall had minimal positive correlation with COVID-19 incidence having 0.04 (95% CI, − 0.09–0.16)0.03 (95% CI, − 0.10–0.17) for fixed and random, respectively. Correlation between UV and COVID-19 incidence was measured as − 0.09 (95% CI, − 0.23–0.06) for fixed and − 0.14 (95% CI, − 0.43–0.18) for random model. Wind speed was found to have positive correlation with the incidence of COVID-19 such as, 0.58 (95% CI, 0.49–0.66) and 0.62 (95% CI, − 0.17–0.92).
Heterogeneity (I2) was mostly observed with the temperature, humidity (COVID-19 incidence) and wind speed variables i.e. 90%, 96% and 98%, respectively. Complete homogeneity i.e. (I2 = 0) was found in the humidity with the death rate of COVID-19 with zero τ2. I2 of rainfall was found as 16% against the COVID-19 incidence.
Figures 2, 3, 4, 5, 6, 7, and 8 present the forest plots of seven different correlation aspects of weather parameters with COVID-19 death rate and incidence.
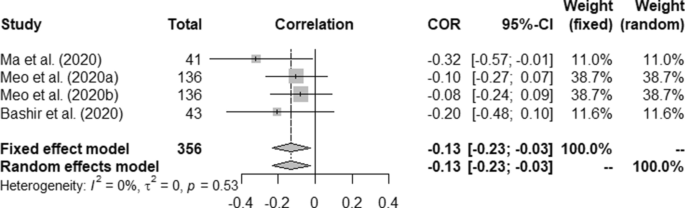
Forest plot of COVID-19 death rate with humidity.
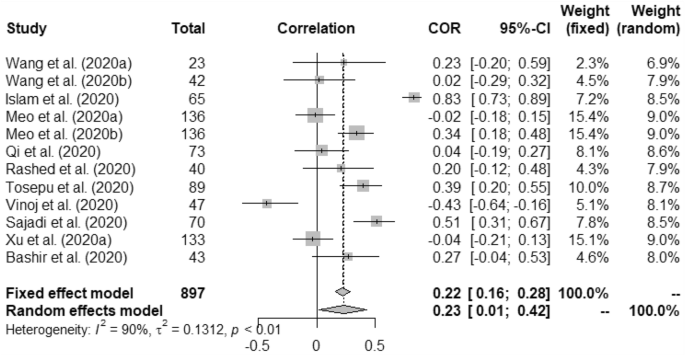
Forest plot of COVID-19 incidence with temperature.
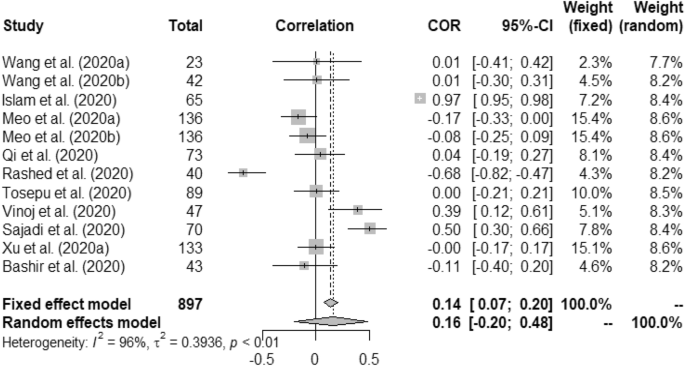
Forest plot of COVID-19 incidence with humidity.
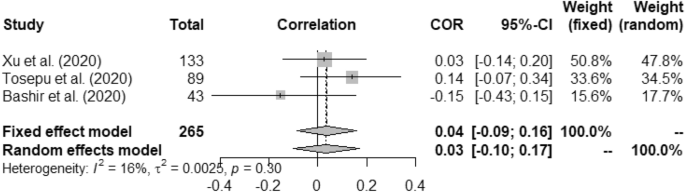
Forest plot of COVID-19 incidence with rainfall.
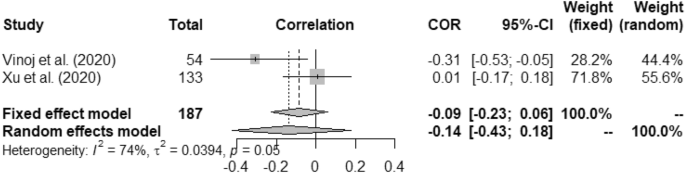
Forest plot of COVID-19 incidence with UV.
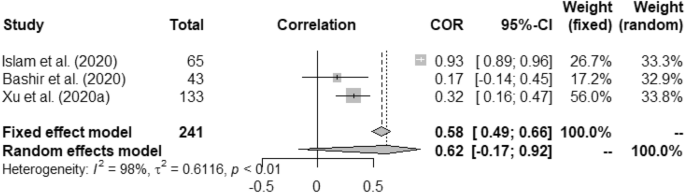
Forest plot of COVID-19 incidence with wind speed.
Discussion
To best of our knowledge, herein presented systematic review and meta-analysis is the first ever work to find answer of correlation between weather on COVID-19. Our meta-analysis is the first to analyse the effect of weather on the death rate and incidence of COVID-19. Based on our meta-analysis we found correlation between weather on the COVID-19. Temperature and humidity are most crucial weather factors that are string enough to impact over the death rate and incidence of COVID-1942,43. All the articles included into this study adhere to the weather centric approaches to the COVID-19. All the articles performed their research during December, 2019 to June, 2020. Thus, a long-time duration was covered in our meta-analysis to come at genuine and effective conclusion about possibility of weather impact on COVID-19. Correlation parameters were used in this study to disseminate direct relationship between the weather and COVID-19.
Our meta-analysis included more than 110 country data regarding weather impact on the coronavirus spread and deaths. As the articles carries extensive research during initial phase and mid phase of COVID-19 in most of the countries, this meta-analysis is far more effective to provide more specific answer to correlation-related questions which were frequently asked in near past. With involvement of the JBI tools and GRADE evidence profile, presented meta-analysis serves as an indispensable literature in the current context of COVID-19 incidence.
In this meta-analysis, we assumed the correlation values to be most effective than other alternatives due to its straight forward nature of relationship measurement approach. We depended our study over the fixed and random effect models asides the heterogeneity and dispersion of true size effects. Significant forest plots were obtained for the (a) temperature versus death rate, (b) temperature versus incidence, (c) humidity versus incidence, and (d) wind speed versus incidence of COVID-19 i.e. air borne. Though, impact of UV radiation over the incidence of COVID-19 was computed but negative correlation was observed. It means that with more UV radiation lesser incidence of COVID-19 can be found. Similarly, rainfall has a positive correlation with COVID-19 incidence.
We didn’t know the exact reason why such behaviour i.e. non-significance was observed. We can hypothesize that higher rainfall increases relative humidity in air thus a greater number of cases can be seen due to COVID-19. One surprising result was found in our meta-analysis i.e. negative correlation between humidity with death rate, though its relationship to the incidence was earlier discussed to be positively correlated. We not clear about the reason behind such nature of humidity.
Our work has some limitations including availability of plentiful research on weather correlation with COVID-19. This study restricted us to conduct meta-analysis on available articles where some of them were taken from various preprint servers. Thus, risk of rejection of those articles were not accurately considered, even though we used JBI and GRADE methods. We can also say that hot countries with high average temperature and relative humidity are more prone get affected by new incidences of COVID-19 in coming days. It can be estimated that during coming winter may provide some relief to the people of world. However, more research should be conducted to better support our meta-analysis conclusions.
Conclusion
We found some strong correlations between weather over the incidence of COVID-19. The met-a analysis can be useful for the policy makers of the government and health incorporations to take prior decisions before the possible surge of COVID-19 cases depending on the weather forecasting mechanism. We urge the medical professionals and weather analysts to further investigate the findings of this article as the a-priori information to mitigate the COVID-19 pandemic.
References
COVID, T.C. and Team, R. Severe outcomes among patients with coronavirus disease 2019 (COVID-19)-United States, February 12-March 16, 2020. MMWR Morb Mortal Wkly Rep 69(12), 343–346 (2020).
Mehta, P. et al. COVID-19: consider cytokine storm syndromes and immunosuppression. Lancet (London, England) 395(10229), 1033 (2020).
Velavan, T. P. & Meyer, C. G. The COVID-19 epidemic. Tropical Med. Int. Health 25(3), 278 (2020).
Kannan, S., Ali, P. S. S., Sheeza, A. & Hemalatha, K. COVID-19 (Novel Coronavirus 2019)-recent trends. Eur. Rev. Med. Pharmacol. Sci 24(4), 2006–2011 (2020).
Worldometer covid-19, Available online https://www.worldometers.info/coronavirus/, Accessed on September 1, 2020.
Le, T. T. et al. The COVID-19 vaccine development landscape. Nat. Rev. Drug Discov. 19(5), 305–306 (2020).
Hotez, P. J., Corry, D. B. & Bottazzi, M. E. COVID-19 vaccine design: the Janus face of immune enhancement. Nat. Rev. Immunol. 20(6), 347–348 (2020).
Graham, B. S. Rapid COVID-19 vaccine development. Science 368(6494), 945–946 (2020).
Corey, L., Mascola, J. R., Fauci, A. S. & Collins, F. S. A strategic approach to COVID-19 vaccine R&D. Science 368(6494), 948–950 (2020).
Wu, S.C., 2020. Progress and Concept for COVID‐19 Vaccine Development. Biotechnology Journal.
Yamey, G. et al. Ensuring global access to COVID-19 vaccines. The Lancet 395(10234), 1405–1406 (2020).
Lv, H., Wu, N.C. and Mok, C.K., 2020. COVID‐19 vaccines: knowing the unknown. European J. Immunol.
Koirala, A., Joo, Y.J., Khatami, A., Chiu, C. and Britton, P.N., 2020. Vaccines for COVID-19: the current state of play. Paediatric Respirat. Rev.
DeRoo, S.S., Pudalov, N.J. and Fu, L.Y., 2020. Planning for a COVID-19 Vaccination Program. JAMA.
Thunstrom, L., Ashworth, M., Finnoff, D. and Newbold, S., 2020. Hesitancy Towards a COVID-19 Vaccine and Prospects for Herd Immunity. Available at SSRN 3593098.
Kyle, C. H., Liu, J., Gallagher, M. E., Dukic, V. & Dwyer, G. Stochasticity and infectious disease dynamics: density and weather effects on a fungal insect pathogen. Am. Nat. 195(3), 504–523 (2020).
Fujii, F., Egami, N., Inoue, M. and Koga, H., 2020. Weather condition, air pollutants, and epidemics as factors that potentially influence the development of Kawasaki disease. Sci. Total Environ, 741, p.140469.
Wang, Z.B., Ren, L., Lu, Q.B., Zhang, X.A., Miao, D., Hu, Y.Y., Dai, K., Li, H., Luo, Z.X., Fang, L.Q. and Liu, E.M., 2020. The impact of weather and air pollution on viral infection and disease outcome among pediatric pneumonia patients in Chongqing, China from 2009 to 2018: a prospective observational study. Clinical Infectious Diseases.
Passer, J.K., Danila, R.N., Laine, E.S., Como-Sabetti, K.J., Tang, W. and Searle, K.M., 2020. The association between sporadic Legionnaires' disease and weather and environmental factors, Minnesota, 2011–2018. Epidemiology & Infection, 148.
Tobías, A. & Molina, T. Is temperature reducing the transmission of COVID-19?. Environ. Res. 186, 109553 (2020).
Yuan, S., Jiang, S. & Li, Z. L. Do humidity and temperature impact the spread of the novel coronavirus?. Front. Public Health 8, 240 (2020).
Anis, A., 2020. The Effect of Temperature Upon Transmission of COVID-19: Australia And Egypt Case Study. Available at SSRN 3567639.
Mecenas, P., Bastos, R., Vallinoto, A. and Normando, D., 2020. Effects of temperature and humidity on the spread of COVID-19: a systematic review. medRxiv.
Harmooshi, N.N., Shirbandi, K. and Rahim, F., 2020. Environmental concern regarding the effect of humidity and temperature on 2019-nCoV survival: fact or fiction. Environmental Science and Pollution Research, pp.1–10.
Gupta, S., Raghuwanshi, G.S. and Chanda, A., 2020. Effect of weather on COVID-19 spread in the US: a prediction model for India in 2020. Science of The Total Environment, p.138860.
Şahin, M., 2020. Impact of weather on COVID-19 pandemic in Turkey. Science of The Total Environment, p.138810.
Rosario, D.K., Mutz, Y.S., Bernardes, P.C. and Conte-Junior, C.A., 2020. Relationship between COVID-19 and weather: Case study ain a tropical country. Int. J. Hyg. Environ. Health, 229, p.113587.
Chen, H. et al. Compound Kushen injection combined with platinum-based chemotherapy for stage III/IV non-small cell lung cancer: a meta-analysis of 37 RCTs following the PRISMA guidelines. J. Cancer 11(7), 1883 (2020).
Lockwood, C., Stannard, D., Jordan, Z. and Porritt, K., 2020. The Joanna Briggs Institute clinical fellowship program: a gateway opportunity for evidence-based quality improvement and organizational culture change.
Piggott, T., Morgan, R.L., Cuello-Garcia, C.A., Santesso, N., Mustafa, R.A., Meerpohl, J.J., Schünemann, H.J. and GRADE Working Group. Grading of Recommendations Assessment, Development, and Evaluations (GRADE) notes: extremely serious, GRADE’s terminology for rating down by three levels. J. Clin. Epidemiol. 120, 116–120 (2020).
Ma, Y., Zhao, Y., Liu, J., He, X., Wang, B., Fu, S., Yan, J., Niu, J., Zhou, J. and Luo, B., 2020. Effects of temperature variation and humidity on the death of COVID-19 in Wuhan, China. Science of The Total Environment, p.138226.
Wang, J., Tang, K., Feng, K. and Lv, W., 2020. High temperature and high humidity reduce the transmission of COVID-19. Available at SSRN 3551767.
Nazrul, I., Sharmin, S. and Mesut, E.A., 2020. Temperature, humidity, and wind speed are associated with lower Covid-19 incidence. https://www.medrxiv.org/content/medrxiv/early/2020/03/31/2020.03.27.20045658.full.pdf.
Qi, H., Xiao, S., Shi, R., Ward, M.P., Chen, Y., Tu, W., Su, Q., Wang, W., Wang, X. and Zhang, Z., 2020. COVID-19 transmission in Mainland China is associated with temperature and humidity: a time-series analysis. Science of the Total Environment, p.138778.
Meo, S. A. et al. Climate and COVID-19 pandemic: effect of heat and humidity on the incidence and mortality in world’s top ten hottest and top ten coldest countries. Eur. Rev. Med. Pharmacol. Sci. 24(15), 8232–8238 (2020).
Rashed, E. A., Kodera, S., Gomez-Tames, J. & Hirata, A. Influence of absolute humidity, temperature and population density on COVID-19 spread and decay durations: multi-prefecture study in Japan. Int. J. Environ. Res. Public Health 17(15), 5354 (2020).
Tosepu, R., Gunawan, J., Effendy, D.S., Lestari, H., Bahar, H. and Asfian, P., 2020. Correlation between weather and Covid-19 pandemic in Jakarta, Indonesia. Sci. Total Environ, p.138436.
Bashir, M. F. et al. Correlation between climate indicators and COVID-19 pandemic in New York 138835 (Science of The Total Environment, 2020).
Vinoj, V., Gopinath, N., Landu, K., Behera, B. and Mishra, B., 2020. The COVID-19 Spread in India and its dependence on temperature and relative humidity.
Sajadi, M.M., Habibzadeh, P., Vintzileos, A., Shokouhi, S., Miralles-Wilhelm, F. and Amoroso, A., 2020. Temperature and latitude analysis to predict potential spread and seasonality for COVID-19. Available at SSRN 3550308.
Xu, R., Rahmandad, H., Gupta, M., DiGennaro, C., Ghaffarzadegan, N., Amini, H. and Jalali, M.S., 2020. The modest impact of weather and air pollution on COVID-19 transmission. medRxiv.
Hariyanto, T. I., Kristine, E., Jillian Hardi, C. & Kurniawan, A. Efficacy of lopinavir/ritonavir compared with standard care for treatment of coronavirus disease 2019 (COVID-19): a systematic review. Infect. Disord. Drug Targets. https://doi.org/10.2174/1871526520666201029125725 (2020).
Hariyanto, T. I., Hardyson, W. & Kurniawan, A. Efficacy and safety of tocilizumab for coronavirus disease 2019 (Covid-19) patients: a systematic review and meta-analysis. Drug Res. (Stuttg). https://doi.org/10.1055/a-1336-2371 (2021).
Author information
Authors and Affiliations
Contributions
P.M. gathered data and designed the experiments. P.P.R. wrote the paper and performed the analysis. All authors reviewed the manuscript.
Corresponding author
Ethics declarations
Competing interests
The authors declare no competing interests.
Additional information
Publisher's note
Springer Nature remains neutral with regard to jurisdictional claims in published maps and institutional affiliations.
Rights and permissions
Open Access This article is licensed under a Creative Commons Attribution 4.0 International License, which permits use, sharing, adaptation, distribution and reproduction in any medium or format, as long as you give appropriate credit to the original author(s) and the source, provide a link to the Creative Commons licence, and indicate if changes were made. The images or other third party material in this article are included in the article's Creative Commons licence, unless indicated otherwise in a credit line to the material. If material is not included in the article's Creative Commons licence and your intended use is not permitted by statutory regulation or exceeds the permitted use, you will need to obtain permission directly from the copyright holder. To view a copy of this licence, visit http://creativecommons.org/licenses/by/4.0/.
About this article

Cite this article
Majumder, P., Ray, P.P. A systematic review and meta-analysis on correlation of weather with COVID-19. Sci Rep 11, 10746 (2021). https://doi.org/10.1038/s41598-021-90300-9
Received:
Accepted:
Published:
DOI: https://doi.org/10.1038/s41598-021-90300-9
This article is cited by
-
Association of air pollution and weather conditions during infection course with COVID-19 case fatality rate in the United Kingdom
Scientific Reports (2024)
-
Bell correlations outside physics
Scientific Reports (2023)
-
Human exposure risk assessment for infectious diseases due to temperature and air pollution: an overview of reviews
Environmental Science and Pollution Research (2023)
-
Assessing the impact of long-term exposure to nine outdoor air pollutants on COVID-19 spatial spread and related mortality in 107 Italian provinces
Scientific Reports (2022)
Comments
By submitting a comment you agree to abide by our Terms and Community Guidelines. If you find something abusive or that does not comply with our terms or guidelines please flag it as inappropriate.
