
Abstract
We analyzed the effects of rice straw biochar (RSBC) and swine manure biochar (SMBC) on N2O emission from paddy soil. The biochars were added to soil at the rates of 1% and 5% (w/w), and N2O emission, soil properties and soil enzyme activities were determined at the elongation, heading and maturation stages of rice growth. The N2O flux started within 2 h of adding the biochar, and decreased significantly thereafter during the three growth stages. The cumulative N2O emission was suppressed by 45.14–73.96% following biochar application, and 5% SMBC resulted in the lowest cumulative emission. In addition, biochar application significantly increased soil pH, soil organic carbon (SOC), NO3− levels and urease activity, and decreased soil NH4+ and nitrate reductase activity. Regression analysis indicated that cumulative N2O emission was correlated positively to NH4+, and negatively to soil pH, SOC and NO3−. SEM further revealed that biochar application weakened the denitrification process, and the NH4+ level had the most significant impact on N2O emission. Taken together, RSBC and SMBC regulated the nitrogen cycle in paddy soil and mitigated N2O emission by increasing soil pH, decreasing nitrate reductase activity and NH4+ content.
Introduction
Nitrous oxide (N2O) is a strong greenhouse gas (GHG) that persists in the atmosphere for 120 years, and accelerates the depletion of the stratospheric ozone layer1. The major source of the rising global N2O levels is the excessive use of nitrogen (N) fertilizers in agriculture2. In fact, the agricultural ecosystem contributes approximately 60% of the global anthropogenic N2O3. Rice is the staple food of nearly 50% of the world's population, and therefore the one of the major crops cultivated large-scale. Although less compared to that of upland soil, the annual N2O emission by rice paddy soil in China is still high at approximately 93 Gg4. Therefore, it is necessary to devise novel agricultural management strategies to mitigate the emission of N2O.
Biochar is a charcoal-like substance formed by controlled pyrolysis of agricultural waste5, and acts as an effective sponge for the organic and inorganic contaminants in soil and water due to its high pH, surface area, porosity and surface charge, as well as presence of various functional groups6. It has gained considerable attention in recent years for enhancing C levels, improving fertility, and controlling GHG emission7,8. Although there is clear evidence that biochar application is an effective soil amendment method in paddy fields9,10,11, its influence on soil N2O emission is still inconsistent. For example, Wang et al.12 reported a significant inhibitory effect of biochar on N2O emission from rice paddy field, especially in the early incubation stage, which was supported by several follow-up studies7,13. In contrast, Lin et al.14 found that wheat straw biochar increased N2O emission from acidic paddy soil. Furthermore, Angst et al.15 indicated that the cumulative emission of N2O was not significantly affected by biochar treatment. Therefore, there are several potential factors that influence N2O emission from paddy soil.
Soils N2O emission is closely related to the nitrogen cycle, which mainly comprises of nitrification and denitrification16. In addition, microbial processes like heterotrophic nitrification, couple denitrification, and reduction of dissimilated nitrate to ammonia also increase N2O emission17. While nitrification is the predominant N2O-generating process in aerobic soils, denitrification decreases with enhanced oxygen availability18. Therefore, heterotrophic denitrification is the primary source of N2O emission from flooded rice fields19, and is dominated by specific microorganisms20,21. Abiotic factors such as pH, organic carbon content, nitrogen availability and enzymatic activity modulate the soil microbiota, and therefore indirectly affect nitrogen cycling and N2O emission22. In this process, biochar acts as a redox catalyst and play a neglectable potential role in N2O emission. Usually, biochar is alkaline and contains considerable amounts of soluble base cations, which can increase soil pH when application to soil23. Increased soil pH, in turn, affect soil nitrate reductase activity and consequently decrease the N2O product ratios through weakening denitrification intensity under anaerobic conditions. However, the relationship of nitrification and denitrification on N2O emissions is not straightforward when available N levels changed in soil24. Cao et al.25 reported that application of biochar reduced the leaching of NO3− and accumulated concentration of NO3− in soil. More recently, Maucieri, et al.13 reported a decrease of NH4+ in biochar amended soil due to higher adsorption. Therefore, as the substrate, available N affected by biochar application is the major driver for N2O emission. Although biochar increases soil alkalization, its potential regulatory effect on the causal relationship between nitrogen cycle and N2O emission is still unclear.
Since N2O emission from paddy soil following biochar amendment varies considerably, we hypothesized that the biochar type and application rate affect N2O emission by regulating soil pH, SOC, NH4+ and NO3−. Therefore, we analyzed N2O emission from paddy soil after treating it with rice straw biochar (RSBC) and swine manure biochar (SMBC), and determined the effect of biochar type and application rate on the physiochemical characteristics of the soil. In addition, the causal relationship between soil properties and N2O emission after biochar application was also investigated, and the causal pathways were tested by structural equation model (SEM).
Methods
Biochar and soil preparation
Rice straw and swine manure were loaded into different porcelain crucibles (height—6 cm and internal diameter—5.5 cm) that were then covered with lids and placed in a muffle furnace (M110 Thermo Scientific, America). The temperature of the furnace was increased at 15 °C min−1 to 500 °C, and maintained at this temperature for 2 h. The final biochar was broken into < 1 cm long chips, stored in sealed bag and dried. The paddy soil samples were taken from depths of 0–20 cm from an agricultural field in Chengdu, Sichuan, China (30° 70′ 56.1″ N, 103° 86′ 05.4″ E) that cultivated wheat and rice alternately. The soil pH was 6.42, with SOC 17.44 mg g−1, ammoniacal nitrogen (NH4) 2.97 µg g−1, nitrate nitrogen (NO3) 11.2 µg g−1, and nitrite nitrogen (NO2) 0.21 mg kg−1.
Biochar application and rice cultivation
The experiment was conducted in the greenhouse of Sichuan Agriculture University, China between May to September, 2018. Cylindrical plastic pots (diameter 380 mm; height 400 mm) were filled with 6 kg soil sample and 1% and 5% (w/w) RSBC and SMBC respectively, with 55% water holding capacity (four experimental groups, see Table 1), or only the soil (control). After 7 days of incubation, deionized water was poured into the plots and the water level was kept 2–3 cm above the soil. Rice seedlings were transplanted to the pots at the end of May 2018, with three seedlings planted per pot. The pots with different soil/biochar mixtures were arranged as per randomized complete block design with three replicates per treatment. Compound fertilizer (N:P:K = 15:15:15) was added at the seedling stage, and deionized water was added till 2–3 cm above the soil surface. Three soil samples were collected from each pot at the elongation (June 28, 2018), heading (August 2, 2018) and maturation stages (September 11, 2018) of rice growth and mixed. One part was stored at 4 °C immediately for testing enzyme and N2O emission, and the remaining was air dried for physicochemical analysis.
Soil N2O sampling and analysis
Fifty grams fresh soil samples were put into 250 ml culture bottles in triplicate, and sealed with perforated silica gel plug. A three-way valve was used to expose the contents of the bottles to the outside air, and the headspace was sealed using hot melt adhesive. The soil samples were saturated with sterile ultrapure water to a depth of 3 cm, and incubated at 25 °C for 30 days. Five empty bottles were similarly set up to measure baseline N2O levels. The N2O in the headspace was sampled at 2 h, and 1, 3, 5, 7, 14 and 30 days using a gas sampling bag. After each sample collection, the lids were opened for half an hour to ensure thorough gas exchange between the atmosphere and the inside of the bottle. The concentration of N2O was measured using a Gas Chromatograph with an Electron Capture Detector (Agilent Technology 7890B, USA).
The N2O fluxes (μg kg−1 soil d−1) were calculated using Eq. (1):
where F is the N2O flux (μg kg−1 soil d−1), C is the concentration measured by the gas chromatograph (ng nl−1), C0 is the concentration measured in the blank bottle (ng nl−1), M is the molecular weight of N2O (g mol−1), V is the volume of gas in the culture flask (L), m is the dry soil weight (g), and T is the sampling interval (d).
The cumulative emission of soil N2O were calculated using Eq. (2):
where E is the cumulative emission of soil N2O (μg kg−1 soil d−1); F is the N2O fluxes (μg kg−1 soil d−1); ti is the ith sampling time (d).
Physicochemical analysis of biochar samples
The pH of the biochars was determined using a pH-meter (ST2100, OHAUS, America) and the solid to water ratio was set at 1:10 (1 g 10 ml−1). The ash contents of biochar were calculated by mass difference after burning in a muffle furnace at 600 °C for 8 h. Cation exchange capacity (CEC) was determined by the barium chloride (BaCl2) method. The content of carbon (C), nitrogen (N), hydrogen (H) and sulfur (S) were measured using an element analyzer (vario EL cube, ELEMENTAR, German). Surface area (SBET) and total pore volume (Vtotal) was determined using a NOVA 1,200 surface area pore analyzer (Quantachrome Instruments, Boynton Beach, Florida, USA).
Soil sample analysis
Soil pH was determined using a pH-meter (ST2100, OHAUS, America) at the solid-water ratio of 1:2.5 (5 g 12.5 ml−1). The concentration of NO3−, NO2− and NH4+ were respectively determined by the phenol disulfonic acid method, sulfa/naphthalene ethylenediamine hydrochloride colorimetry and sodium phenol hypochlorite colorimetry using a UV spectrophotometer (UV-1800, MAPADA, China) respectively. SOC was determined by the potassium bichromate-ferrous sulfate titration method. Soil nitrate reductase (NR) activity was determined by phenol disulfonic acid method, and urease activity (UR) by the sodium phenate-sodium hypochlorite colorimetric method. All these methods have been described by Lu26.
Statistical analysis
One-way analysis of variance (ANOVA) and Duncan test were used to compare the indices and treatments. Two-way ANOVA was used to test the effect of biochar type and rate on various indices. Regression analysis was used to explore the relationship between pH, SOC, NH4+, NO3− and N2O emissions. Principal component analysis (PCA) and redundancy analysis (RDA) were performed to analyze the differences between biochar treatments, and the relationship between soil physico-chemistry and N2O emission. Multivariate analyses were performed using CANOCO version 5.0 for Windows. Exploratory path analysis was used to test the causal relationship between soil physico-chemistry, soil enzymes and N2O emission under different biochar types and application rates. SEM analyses were performed with IBM SPSS Amos 22.0 (IBM, New York, USA).
Results
Soil characteristics
The physiochemical parameters of the paddy soil during the different rice growth stages are shown in Fig. 1. The pH value increased in the 1% RSBC, 1% SMBC, 5% RSBC and 5% SMBC-supplemented soils in that order compared to the control samples. Thus, SMBC had a greater alkalization effect than RSBC at both application rates (Fig. 1a). In addition, the soil pH during rice growth was highest with the addition of 5% SMBC due to its higher ash content and CEC (see Supplementary Table S1). The SOC content in the different groups ranged from 16.92–39.08, 17.59–23.80 and 15.23–26.26 mg g−1 during the elongation, heading and maturation stages respectively (Fig. 1b), and was higher in the biochar-supplemented soil compared to the control soil, indicating that biochar also retarded soil mineralization. Furthermore, addition of SMBC resulted in greater SOC compared to RSBC.

Soil physiochemical parameters during rice growth among treatments. (a), soil pH; (b), soil organic carbon; (c), soil NH4+ concentration; (d), soil NO3− concentration; (e), soil NO2− concentration; (f), rate of soil SOC: NO3−.
Soil NH4+, NO3− and NO2− levels were also significantly influenced by biochar application (see Supplementary Table S2, Fig. 1c,d). The NH4+ levels were significantly higher in the control soil samples relative to the biochar-treated soil during the elongation and heading stages, and the difference between the control and SMBC groups was always significant during the maturation stage (P < 0.05, see Supplementary Table S2). In contrast, biochar application significantly enhanced the NO3− levels, and 5% SMBC resulted in maximum increase during all stages of growth. Consistently, the NO3− levels were highest in the SMBC-treated compared to other treated soils during the maturation stage (Fig. 1d). The soil NO2− levels ranged from 0.15 to 1.03, 0.13 to 0.43 and 0.25 to 0.49 µg g−1 respectively in the elongation, heading and maturation stages. In the elongation stage, 5% SMBC minimized NO2− levels, which increased again during the heading and mature stages (Fig. 1e). Finally, biochar application significantly increased the SOC:NO3− ratio compared to the control (P < 0.05, Fig. 1f) depending on the application rate. Taken together, biochar induces significant changes in the physicochemical characteristics of soil, which likely affect the rate of N2O emission.
Soil enzymes activity
The activities of nitrate reductase (NR) and urease (UR) differed between the control and biochar-supplemented soils, as well as between the RSBC and SMBC-treated samples. As shown in Fig. 2, biochar application markedly inhibited NR activity during the elongation and heading stages of rice growth (P < 0.05), while no significant effect was seen in the maturation stage regardless of the biochar type and application rate (see Supplementary Table S2). In contrast, biochar application increased the soil UR activity compared to control, and consistent with the trends in NR activity, the effect of application rate was significant only during the elongation and heading stages (P < 0.05) and not in the maturation stage (see Supplementary Table S2).

Effect of biochar application on soil nitrate reductase (a) and urease activity (b) in paddy soil at rice growth stages. Different letters above columns indicate significant differences at P < 0.05. Errorbar represented standard error of mean (n = 9).
Soil N2O emission
The N2O flux in the soil during the three growth stages of rice is shown in Fig. 3, which indicates a relatively consistent trend and a pulse-like pattern across all treatments. The N2O emission was highest 2 h after incubation and slowed after 5 days during all growth stages, indicating that the N2O flux primarily occurred soon after biochar application. At the elongation stage, N2O flux peaked at 2 h and 5 days after incubation. In addition, the highest N2O flux was seen in the control soils lacking biochar, and decreased in the 1% RSBC, 1% SMBC, 5% RSBC and 5% SMBC-supplemented soils in that order, which clearly indicated that adding more biochar lowered N2O emission. At the heading and maturation stages, the largest N2O flux was seen in the control samples 2 h after incubation. Interestingly, no significant differences were seen between the RSBC and SMBC groups after 1 day of incubation, suggesting that the effect of biochar on N2O emission is transient.

Soil N2O fluxes during 2 h-30 days of the incubation at elongation stage (a), heading stage (b), maturation stage (c). Errorbar represented standard error of mean (sem).
The cumulative N2O emission decreased significantly with biochar addition by 45.14–73.96% (P < 0.05; Table 2) compared to that of the control soil at all stages of growth. In addition, SMBC resulted in lower cumulative N2O emission compared to RSBC at the same application rate. The average cumulative N2O emission in the control, 1% RSBC, 1% SMBC, 5% RSBC and 5% SMBC samples were 123.1, 67.53, 64.63, 43.16 and 32.06 μg g−1 respectively. Thus, even after considering the difference between the various feedstocks, biochar derived from swine manure always showed better mitigation effect on N2O emission compared to that derived from rice straw.
Relationship between soil properties and N2O emission
Regression analysis showed that soil pH, SOC, NH4+ and NO3− were significantly correlated to the cumulative N2O emission during the elongation and heading stages (Fig. 4). N2O emission was negatively correlated with pH, SOC and NO3− levels, and positively correlated with soil NH4+ levels during elongation. The higher slope values in the regression equation demonstrated that N2O emission was highly sensitive to the soil indices, and peaked in the initial stages of rice growth before stabilizing in the heading and maturation stages.

Regress analysis between soil properties and cumulative N2O emission during rice growth. (a), pH; (b), SOC; (c), NH4+; (d) NO3−.
The PCA analysis indicated that biochar application significantly affected N2O emission and soil properties, especially in the elongation stage (Fig. 5). RDA further showed that the first and second axes accounted for 45.6% and 17.72% of the total variation in the cumulative N2O emission (pseudo-F = 24.9, P = 0.002; Fig. 5). Biochar type and application rate significantly affected the cumulative N2O emission, which correlated positively with NO2− and NH4+ levels and the NR activity, and negatively with NO3−, pH and SOC. Modified SEM was performed to evaluate the potential causal pathways of biochar type and application rate on N2O emission (Fig. 6). Fit statistics for the modified SEM showed an acceptable fit of the model (P = 0.068 and 0.054, respectively). The soil properties explained 90.8% and 90% variations in N2O emission with different biochar types and application rates respectively (Fig. 6). In addition, NO2− and NH4+ levels were the most important factors controlling N2O emission affected by biochar, pH urease activity and NO3− concentration. The biochar type and application rate also strongly affected SOC, urease activity and pH, which in turn controlled the soil NH4+ and NO3− levels. In contrast, NO3− level had a relatively weaker effect on N2O emission (Fig. 6). The standardized total effect, i.e. the sum of direct and indirect effects, on N2O emission was highest for NO2−, followed by NH4+. Biochar type and application rate had a negative standardized total effect (STE) on N2O emission, with higher application rates resulting in greater suppressive effect regardless of the biochar type (Fig. 7).

Principal Component Analysis (PCA) and redundancy Analysis (RDA) of the effect of biochar and application rate on cumulative N2O emission and soil physicochemical properties.
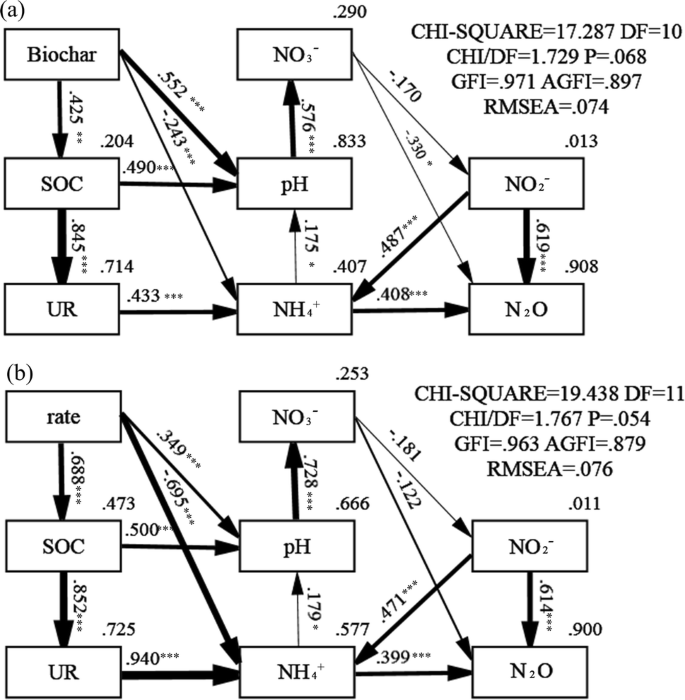
Structural equation model (SEM) diagram showing the potential causal pathways of biochar type (a) and application rate (b) on soil properties and N2O emission. The thickness of arrow represents the strength of the relationship between variables. The values associated with arrows are standardized pathway coefficients, and positive or negative numbers indicating the positive or negative relationships. Values in top right corner of box (endogenous variables) indicate the fraction be explained by the model.

Standardized total effects (direct and indirect effects derived from the structural equation) of N2O emission.
Discussion
Effects of biochar on soil characteristics
Biochar is produced through pyrolysis under limited oxygen condition. The characteristics are largely affected by feedstock, pyrolysis temperature and pyrolysis time. In this study, biochar application increased soil pH by 0.3–1.09 units at elongation stage, 0.29–0.78 units at the heading stage, and by 0.57–0.97 units at the maturation stage. The difference in biochar characteristics was due to different feedstock. Although lower pH value was found in SMBC, the pH in SMBC amended soil was significantly higher than that in RSBC due to its higher ash content and CEC. Alkalization of the soil not only decreased the acidic functional groups during pyrolysis27, but also altered the composition of the microbial community and regulated microbial N availability, thereby affecting soil N2O emission21. We found that cumulative N2O emission correlated negatively with soil pH, and 5% SMBC resulted in maximum alkalization and therefore lowest N2O emission. A higher soil pH is also known to suppress the activity of nitrate reductase (NR) that converts NO3− to NO2–28. Indeed, biochar addition significantly decreased NR activity, especially at 5% application rates, and increased NO3− levels and decreased NO2− levels and N2O emission. Thus, biochar-induced pH increase is the possible mechanism of lower N2O emission.
Among the soil properties and edaphic factors influencing the N2O emission, NH4+ act as reaction substrate of nitrification and play a important role in controlling N2O emission29. Consistent with this, both RSBC and SMBC decreased the availability of NH4+, which correlated with lower cumulative N2O emission. Previous studies have also reported that biochar reduces NH4+ availability in the soil13,30,31. The credible explain was higher adsorb capacity to NH4+ by biochar due to its more adsorption sites and larger surface area32,33. The lower NH4+ concentration in the biochar-treated soils indicated lack of nitrification substrate, resulting in decreased N2O emission.
N3O− contents is the major reaction substrate of denitrification, especially in paddy soils with low oxygen content and sufficient water content. During the process of denitrification, NO3− is converted to NO2− by nitrate reductase, and NO2− is then converted to N2O by nitrite reductase25. The contents of NO3− were increased in both RSBC and SMBC. This result seems to contribute to the process of denitrification and increase N2O emission. Furthermore, we found a decrease in nitrate reductase activity due to higher soil pH after RSBC and SMBC application, thus leading to accumulation of N3O−34.
Effects of biochar on N2O emission
N2O emission from paddy soil was rapid in the initial phase of adding biochar, with a major peak at 2 h and a minor peak 5 days after incubation. These trends were likely due to ammonia oxidation and linked nitrifier denitrification or denitrification pathway. Our findings are consistent with that of Maucieri et al.13, who reported increased carbon and nitrogen availability for nitrification and denitrification in the initial stage of incubation. Gradual consumption of the available N slowed the N2O emission with time. Wang et al.23 also reported that high levels of NO3− supported substrate for N2O production via denitrification in the initial anaerobic incubation after biochar application. One day later, sharp decrease in available NO3− leading to decrease in N2O emission. In this study, we also observed a steady decline in the N2O flux after 1 day. The N2O emission decreased continuously with further consumption of reaction substrate at heading and maturation stages.
Furthermore, the suppressive effect on cumulative N2O emission increased with higher application rate, and was better with SMBC compared to RSBC. Cao et al.25 reported that 1–4% biochar application could effectively decrease soil N2O emission by 17.8–19.2%. The decrease of N2O emission from soil increased with increasing application rate. We found the cumulative N2O emission decreased by 45.14–73.96% compared to that of the control soil at all stages of growth. The least cumulative N2O emission was seen in soils supplemented with 5% SMBC. The inconsistent effects of biochar on N2O emission, in previous study, can be due to the fact that the biochar feedstock, inherent soil properties are major determinants of the nitrogen cycle14,24. In this study, the biochar in fact indirectly affects N2O emission by increasing the pH, and decreasing NH4+ levels and nitrate reductase activity.
The effects of biochar application on N2O emission depend on nitrification and denitrification processes17. Our findings further indicated that NO2− and NH4+ had direct effects on N2O emission. This is not surprising since both are substrates of N2O during nitrification and denitrification. In addition, the high path coefficient from NH4+ to N2O indicated significant direct effects of RSBC and SMBC. However, the effect of NO3− was clearly weakened by RSBC and SMBC as indicated by the weak relationship between NO3− and N2O (standardized path coefficients: 0.170 and 0.181), which explains the increase in NO3− levels after biochar treatment. Thus, biochar application suppressed denitrification of NO3− to N2O, which increased the effect of NH4+ levels on N2O emission in paddy soil. Taken together, N2O emission is not only the result of high pH and biochar-induced decrease in NH4+ levels, but also related to changes in NO3− levels during denitrification.
Conclusion
Application of either RSBC or SMBC reduced N2O flux during the elongation, heading and maturation stages of rice crop in paddy soil, and suppressed cumulative N2O emission by 45.14–73.96%, with 5% SMBC resulting in the lowest cumulative N2O emission. Biochar application increased soil pH, SOC content and NO3− levels, and decreased soil NH4+ levels and nitrate reductase activity. Lower NH4+ content in the soil strongly affected N2O emission, indicating that biochar mitigated N2O emission from paddy soil by increasing soil pH, decreasing nitrate reductase and NH4+ content.
References
Ravishankara, A. R., Daniel, J. S. & Portmann, R. W. Nitrous oxide (N2O): The dominant ozone-depleting substance emitted in the 21st century. Science 326, 123–125. https://doi.org/10.1126/science.1176985 (2009).
Zaman, M. & Nguyen, M. L. How application timings of urease and nitrification inhibitors affect N losses from urine patches in pastoral system. Agric. Ecosyst. Environ. 156, 37–48. https://doi.org/10.1016/j.agee.2012.04.025 (2012).
Hagemann, N. et al. Does soil aging affect the N2O mitigation potential of biochar? A combined microcosm and field study. Glob. Change Biol. Bioenergy 9, 953–964. https://doi.org/10.1111/gcbb.12390 (2017).
Liu, S., Qin, Y., Zou, J. & Liu, Q. Effects of water regime during rice-growing season on annual direct N2O emission in a paddy rice–winter wheat rotation system in southeast China. Sci. Total Environ. 408, 906–913. https://doi.org/10.1016/j.scitotenv.2009.11.002 (2010).
Domene, X., Enders, A., Hanley, K. & Lehmann, J. Ecotoxicological characterization of biochars: Role of feedstock and pyrolysis temperature. Sci. Total Environ. 512–513, 552–561. https://doi.org/10.1016/j.scitotenv.2014.12.035 (2015).
Li, H. B. et al. Mechanisms of metal sorption by biochars: Biochar characteristics and modifications. Chemosphere 178, 466–478. https://doi.org/10.1016/j.chemosphere.2017.03.072 (2017).
Liu, X. Y. et al. Can biochar amendment be an ecological engineering technology to depress N2O emission in rice paddies?—A cross site field experiment from South China. Ecol. Eng. 42, 168–173. https://doi.org/10.1016/j.ecoleng.2012.01.016 (2012).
Case, S. D. C., Uno, H., Nakajima, Y., Stoumann Jensen, L. & Akiyama, H. Bamboo biochar does not affect paddy soil N2O emissions or source following slurry or mineral fertilizer amendment—A 15N tracer study. J. Plant Nutr. Soil Sci. 181, 90–98. https://doi.org/10.1002/jpln.201600477 (2018).
Nelissen, V., Rütting, T., Huygens, D., Ruysschaert, G. & Boeckx, P. Temporal evolution of biochar’s impact on soil nitrogen processes—A 15N tracing study. Glob. Change Biol. Bioenergy 7, 635–645. https://doi.org/10.1111/gcbb.12156 (2015).
Sun, X., Zhong, T., Zhang, L., Zhang, K. & Wu, W. Reducing ammonia volatilization from paddy field with rice straw derived biochar. Sci. Total Environ. 660, 512–518. https://doi.org/10.1016/j.scitotenv.2018.12.450 (2019).
Wang, Y. Q. et al. Differentiated mechanisms of biochar mitigating straw-induced greenhouse gas emissions in two contrasting paddy soils. Front. Microbiol. 9, 2566. https://doi.org/10.3389/fmicb.2018.02566 (2018).
Wang, J., Zhang, M., Xiong, Z., Liu, P. & Pan, G. Effects of biochar addition on N2O and CO2 emissions from two paddy soils. Biol. Fertil. Soils 47, 887–896. https://doi.org/10.1007/s00374-011-0595-8 (2011).
Maucieri, C., Zhang, Y., McDaniel, M. D., Borin, M. & Adams, M. A. Short-term effects of biochar and salinity on soil greenhouse gas emissions from a semi-arid Australian soil after re-wetting. Geoderma 307, 267–276. https://doi.org/10.1016/j.geoderma.2017.07.028 (2017).
Lin, Y. et al. Wheat straw-derived biochar amendment stimulated N2O emissions from rice paddy soils by regulating the amoA genes of ammonia-oxidizing bacteria. Soil Biol. Biochem. 113, 89–98. https://doi.org/10.1016/j.soilbio.2017.06.001 (2017).
Angst, T. E., Six, J., Reay, D. S. & Sohi, S. P. Impact of pine chip biochar on trace greenhouse gas emissions and soil nutrient dynamics in an annual ryegrass system in California. Agric. Ecosyst. Environ. 191, 17–26. https://doi.org/10.1016/j.agee.2014.03.009 (2014).
Harter, J. et al. Gas entrapment and microbial N2O reduction reduce N2O emissions from a biochar-amended sandy clay loam soil. Sci. Rep. 6, 39574–39574. https://doi.org/10.1038/srep39574 (2016).
Verhoeven, E. et al. Nitrification and coupled nitrification-denitrification at shallow depths are responsible for early season N2O emissions under alternate wetting and drying management in an Italian rice paddy system. Soil Biol. Biochem. 120, 58–69. https://doi.org/10.1016/j.soilbio.2018.01.032 (2018).
Saggar, S. et al. Denitrification and N2O:N2 production in temperate grasslands: Processes, measurements, modelling and mitigating negative impacts. Sci. Total Environ. 465, 173–195. https://doi.org/10.1016/j.scitotenv.2012.11.050 (2013).
Zhang, Y., Shi, Z., Chen, M., Dong, X. & Zhou, J. Evaluation of simultaneous nitrification and denitrification under controlled conditions by an aerobic denitrifier culture. Bioresour. Technol. 175, 602–605. https://doi.org/10.1016/j.biortech.2014.10.016 (2015).
Duan, P., Zhang, X., Zhang, Q., Wu, Z. & Xiong, Z. Field-aged biochar stimulated N2O production from greenhouse vegetable production soils by nitrification and denitrification. Sci. Total Environ. 642, 1303–1310. https://doi.org/10.1016/j.scitotenv.2018.06.166 (2018).
Zhang, H. et al. Effect of straw and straw biochar on the community structure and diversity of ammonia-oxidizing bacteria and archaea in rice-wheat rotation ecosystems. Sci. Rep. 9, 9367. https://doi.org/10.1038/s41598-019-45877-7 (2019).
Gul, S., Whalen, J. K., Thomas, B. W., Sachdeva, V. & Deng, H. Physico-chemical properties and microbial responses in biochar-amended soils: Mechanisms and future directions. Agric. Ecosyst. Environ. 206, 46–59. https://doi.org/10.1016/j.agee.2015.03.015 (2015).
Wang, N. et al. Biochar decreases nitrogen oxide and enhances methane emissions via altering microbial community composition of anaerobic paddy soil. Sci. Total Environ. 581–582, 689–696. https://doi.org/10.1016/j.scitotenv.2016.12.181 (2017).
Cayuela, M. L. et al. Biochar’s role in mitigating soil nitrous oxide emissions: A review and meta-analysis. Agric. Ecosyst. Environ. 191, 5–16. https://doi.org/10.1016/j.agee.2013.10.009 (2014).
Cao, H. et al. Biochar can increase nitrogen use efficiency of Malus hupehensis by modulating nitrate reduction of soil and root. Appl. Soil. Ecol. 135, 25–32. https://doi.org/10.1016/j.apsoil.2018.11.002 (2019).
Lu, R. K. Soil analytical methods of agronomic chemical. 10–58 (China Agricultural Science and Technology Press, 2000).
Yuan, J.-H., Xu, R.-K. & Zhang, H. The forms of alkalis in the biochar produced from crop residues at different temperatures. Bioresour. Technol. 102, 3488–3497. https://doi.org/10.1016/j.biortech.2010.11.018 (2011).
Zhang, M., Wang, J., Bai, S. H., Teng, Y. & Xu, Z. Evaluating the effects of phytoremediation with biochar additions on soil nitrogen mineralization enzymes and fungi. Environ. Sci. Pollut. Res. 25, 23106–23116. https://doi.org/10.1007/s11356-018-2425-0 (2018).
Feng, Z., Sheng, Y., Cai, F., Wang, W. & Zhu, L. Separated pathways for biochar to affect soil N2O emission under different moisture contents. Sci. Total Environ. 645, 887–894. https://doi.org/10.1016/j.scitotenv.2018.07.224 (2018).
Singh, B. P., Hatton, B. J., Singh, B., Cowie, A. L. & Kathuria, A. Influence of biochars on nitrous oxide emission and nitrogen leaching from two contrasting soils. J. Environ. Qual. 39, 1224–1235. https://doi.org/10.2134/jeq2009.0138 (2010).
Zhang, A. et al. Effect of biochar amendment on yield and methane and nitrous oxide emissions from a rice paddy from Tai Lake plain, China.. Agric. Ecosyst. Environ. 139, 469–475. https://doi.org/10.1016/j.agee.2010.09.003 (2010).
Luo, L. et al. The characterization of biochars derived from rice straw and swine manure, and their potential and risk in N and P removal from water. J. Environ. Manag. 245, 1–7. https://doi.org/10.1016/j.jenvman.2019.05.072 (2019).
Hale, S. E. et al. The sorption and desorption of phosphate-P, ammonium-N and nitrate-N in cacao shell and corn cob biochars. Chemosphere 91, 1612–1619. https://doi.org/10.1016/j.chemosphere.2012.12.057 (2013).
Nelissen, V., Saha, B. K., Ruysschaert, G. & Boeckx, P. Effect of different biochar and fertilizer types on N2O and NO emissions. Soil Biol. Biochem. 70, 244–255. https://doi.org/10.1016/j.soilbio.2013.12.026 (2014).
Acknowledgements
This work was supported by the National Natural Science Foundation of China (Grant No. 21507095) and The Sichuan Provincial Youth Science and Technology Fund (Grant No. 2017JQ0035).
Author information
Authors and Affiliations
Contributions
Z.B.Y. and Y.Y.: manuscript writing. R.J.H. and L.X.L.: laboratory determination. X.X.X.: data analysis. J.R.X.: manuscript proofreading. Y.X.Y.: samples collection. Z.C. provided materials. All authors have read and approved the final manuscript.
Corresponding authors
Ethics declarations
Competing interests
The authors declare no competing interests.
Additional information
Publisher's note
Springer Nature remains neutral with regard to jurisdictional claims in published maps and institutional affiliations.
Supplementary information
Rights and permissions
Open Access This article is licensed under a Creative Commons Attribution 4.0 International License, which permits use, sharing, adaptation, distribution and reproduction in any medium or format, as long as you give appropriate credit to the original author(s) and the source, provide a link to the Creative Commons license, and indicate if changes were made. The images or other third party material in this article are included in the article’s Creative Commons license, unless indicated otherwise in a credit line to the material. If material is not included in the article’s Creative Commons license and your intended use is not permitted by statutory regulation or exceeds the permitted use, you will need to obtain permission directly from the copyright holder. To view a copy of this license, visit http://creativecommons.org/licenses/by/4.0/.
About this article

Cite this article
Yang, Z., Yu, Y., Hu, R. et al. Effect of rice straw and swine manure biochar on N2O emission from paddy soil. Sci Rep 10, 10843 (2020). https://doi.org/10.1038/s41598-020-67705-z
Received:
Accepted:
Published:
DOI: https://doi.org/10.1038/s41598-020-67705-z
This article is cited by
-
Effect of pristine and Fe-modified rice husk-derived biochar on denitrification and N2O emission in calcareous arable soil
Journal of Soils and Sediments (2023)
-
Faecal sludge pyrolysis as a circular economic approach to waste management and nutrient recovery
Environment, Development and Sustainability (2023)
-
Rice Rusk-Derived Biochar Suppressed N2O Emission from Acidic Arable Soil by Inhibiting Nitrate Reduction
Journal of Soil Science and Plant Nutrition (2022)
-
Contradictory Results of Soil Greenhouse Gas Emissions as Affected by Biochar Application: Special Focus on Alkaline Soils
International Journal of Environmental Research (2021)
Comments
By submitting a comment you agree to abide by our Terms and Community Guidelines. If you find something abusive or that does not comply with our terms or guidelines please flag it as inappropriate.
