
Abstract
Malaria transmission after universal access and use of malaria preventive services is known as residual malaria transmission. The concurrent spatial-temporal distributions of people and biting mosquitoes in malaria endemic villages determines where and when residual malaria transmission occurs. Understanding human and vector population behaviors and movements is a critical first step to prevent mosquito bites to eliminate residual malaria transmission. This study identified where people in the Solomon Islands are over 24-hour periods. Participants (59%) were predominantly around the house but not in their house when most biting by Anopheles farauti, the dominant malaria vector, occurs. While 84% of people slept under a long-lasting insecticide-treated bed net (LLIN), on average only 7% were under an LLIN during the 18:00 to 21:00 h peak mosquito biting period. On average, 34% of participants spend at least one night away from their homes each fortnight. Despite high LLIN use while sleeping, most human biting by An. farauti occurs early in the evening before people go to sleep when people are in peri-domestic areas (predominantly on verandas or in kitchen areas). Novel vector control tools that protect individuals from mosquito bites between sundown and when people sleep are needed for peri-domestic areas.
Introduction
Transmission of mosquito-borne diseases depends on human–vector contact1,2. The concurrent movements and activities of both the human and vector populations that bring these two populations in contact will define the intensity of malaria transmission1,3,4,5,6. After universal access and use of malaria preventive servicesis achieved, eliminating residual malaria transmission requires appropriate interventions to disrupt the remaining human-vector contact4,7,8,9,10,11,12.
Malaria transmission in a specific location is determined by the lifestyle and movements of the residents (among houses, workplaces, neighbourhoods, villages, towns), coupled with mosquito biting patterns through space13 and time14. People move in and around the specific local areas where they live and work and also beyond their local environs. When people move beyond the immediate range of a mosquito’s flight, wider dispersals or acquisitions of malaria and other human vector-borne pathogens can occur5,15,16. Investigating how people move on a broad scale, which can be periodic and/or seasonal across regional, intra-national or international scales6,9,17 helps to understand broad scale malaria transmission and risk. Investigating how people move within more specific local areas such as in/around households, villages or neighbourhoods is critical to understanding and preventing local malaria transmission in specific locations. This understanding of local level transmission is of particular importance when striving to eliminate residual malaria transmission.
As overall malaria transmission is reduced at a provincial, national or regional level, residual transmission becomes highly heterogeneous and local transmission foci emerge18,19. In the South Pacific nation of the Solomon Islands13, malaria transmission varies at two scales, an inter- and at an intra-village scale. Within villages, mosquito biting is highly heterogeneous and understanding the locations where residents spend the majority of their time during periods of peak mosquito activity will define their local risk of malaria. In particular, the amount of time that people spend inside households directly relates to protection from biting mosquitoes and malaria in the Solomon Islands. This protective house effect is a function of two factors. Firstly, the two WHO recommended malaria vector control tools, long lasting insecticidal nets (LLINs) and indoor residual spraying (IRS), only provide protection to individuals inside houses, either when sleeping under an LLIN or inside a room that was sprayed with insecticides (e.g., IRS). The second factor relates to the biting behaviour of the malaria vector, Anopheles farauti. Anopheles farauti is temporally and spatially heterogeneous13 and bites predominantly outdoors and early in the evening14. Thus, individuals are far less likely to be bitten when they are inside a house, even if the house is without screening or other mosquito exclusion methods. People nearby but outside the house, in the peri-domestic area, do not receive the protective benefits of LLIN/IRS and are exposed to higher biting rates by An. farauti due to the mosquito’s preference for biting outdoors.
At the Solomon Islands provincial level, two provinces (Isabel and Temotu) are nearing malaria elimination while other provinces continue to have high rates of transmission. People moving out of Isabel and Temotu provinces are at increased risk of malaria infection. Movement of infected individuals into these provinces threatens elimination efforts by introducing malaria parasites. To date, only one study has explored human movement in the Solomon Islands. This study focused on Isabel Province, and documented broad-scale travel between villages/towns within and beyond the province20. However, fine scale movement of people within villages remains undocumented.
To inform a better understanding of how people move within specific residual transmission foci in the Solomon Islands, this study documented how people moved at both the specific local scale (in/around households within villages) during the period from 18.00 to 00.00 h when 93% of An. farauti bites occur21 and at a broader scale (beyond the village) using individual movement diaries. Documenting where people are in the evening and night (18.00-0.00 h) helps understand exposure to malaria vectors in the village. However, knowledge of people movement across a 24-hour period helps understand broader social and environmental movements as well as exposure to other vectors such as the Aedes vectors of dengue, Zika and chikungunya viruses which are active during the day. Data on people locations over a 14-day period in two villages were compiled, with the analyses in this study focusing on quantifying human-vector interactions10 where and when humans are exposed to the bites of malaria vectors.
Results
Human movement data was collected from a total of 1204 person-days. Participants were children <5 years (11%), youth 5 to 18 years (37%) and adults >18 years (52%). The age structure of survey population was representative of the national population, and there was no difference in the age structure between either population (χ2 = 1.276, df = 2, p = 0.528). All households had LLINs with an average of almost 4 LLINs per household. There were 1.4 persons/LLIN. Although 84% of people reported sleeping under an LLIN, only 7% could be under an LLIN during the 18:00 to 21:00 h peak mosquito biting period. Window screens were present in only one house.
Overall people movement
People locations were designated as being within one of four nested categories, of increasing scale: inside the house, the peri-domestic area around the house (including the veranda and external kitchen building), the residential village and all areas beyond the village of residence (Fig. 1). Each nested location category was composed of finer scale sub-locations (Table 1). There were significant changes in the location of people during a 24 hr period with most people in or near their homes in the early morning as well as in the late afternoon and at night; however, in the middle of the day more people were outside their village or within their village but away from the house and peri-domestic area and these changes in locations over 24-hour periods were statistically different (χ2 = 768.17, df = 6, p = <0.0001; Fig. 2).

Schematic detailing the set of nested categories where people were located.

The 24 h profile of human movement within the three categories of at home (includes both inside house and peri-domestic), within village and beyond village.
Overnight people movement
The overnight period was analysed to document if people spent the night within their home village or outside their village. During the 14-day study, 34% (n = 29) of participants spent at least one night away from the village. Almost equal numbers of males (n = 15) and females (n = 14) spent at least one night away from their village. The average number of nights away from the village was 3.6 per fortnight (range = 1 to 12) with no significant differences by gender (females μ = 3.0 and males μ = 4.1 nights away; β = 1.066, se = 1.245, p = 0.399) or age (compared with the baseline age distribution of all participants) (β = 1.122, se = 3.601, p = 0.756). The average number of nights that participants spent away from the village differed by village (Haleta village μ = 1.2 and Tuguivili village μ = 4.6 nights away; β = 3.378, se = 1.197, p = 0.008). The most frequent overnight travel location was to another village (59%) followed by a town or city (24%) and for employment on ships (14%).
Night-time people movement (18:00–06:00 h)
The night-time period (18:00–06:00 h) was analysed in 1-hour blocks for the evening time period between 18:00–00:00 h and then a single 6-hour late night-time block between 00:00–06:00 h. Locations at specific times were recorded in 3 categories: the house, the peri-domestic area and the village (people who were beyond the village for the evening were not included in the ‘internal village’ movement analysis). There were significant differences in the locations of participants during the evening hours between the three location categories (18:00–00:00 h) (χ2 = 1762.3, df = 10, p = <0.0001), across all days and ages. At 18:00 h 12% were inside the house, 65% were in the peri-domestic area and 23% were in the village (Fig. 3a). During 18:00–21:00 h, half (53%) of participants were in two peri-domestic locations, the kitchen (25%) and the veranda (28%) (Fig. 3c). During 21:00–00:00 h, 62% of people were inside the house (with almost 80% in a bedroom) (Fig. 3b), 29% in the peri-domestic area and 9% in the village. At 00:00 h 80% were inside the house, 17% were in the peri-domestic area, 3% were in the village. Between 00:00 h and 06:00 h, 94% were inside the house, 5% were in the peri-domestic area, 1% were in the village. There was no statistical difference between weekends and weekdays for the percentage of people that were inside the house over the evening (eg. people inside house at 20:00 − 21:00: weekdays = 23% weekends 25%).

The profiles of human movement across the evening for: (a) within the three nested categories of inside the house, the peri-domestic area and the village; (b) the sub-categories for inside the house; and (c) the sub-categories for the peri-domestic environment. Note that the stacked profiles for graphs b and c are calculated as a breakdown of the percentages presented for each category in graph a.
Differences between age groups
The number and proportion of participants inside the house across the evening varied by age (χ2 = 39.526, df = 10, p < 0.0001). Ultimately, 100% of under 5 year olds, 99% of 6–18 year olds and 89% of adults (χ2 = 39.3, df = 2, p < 0.0001) slept inside the house, however the time of entering the house differed. Half of under 5 year olds were in the bed room by 20:30 h, half of 5–18 year olds by 22:00 and half of people >18 year by 23:00 h (Fig. 4). LLINs were used by 100% of under 5 year olds, 85% of 5–18 years and 80% of >18 year olds, which was statistically different (χ2 = 29.4, df = 2, p < 0.0001).

The evening profile of participants located inside the house for each age category.
Difference between villages
The movement of people differed significantly between the villages (β = 111.76, se = 12.34, p = 0.0004). In Tuguivili village, more people moved beyond the village on any given 24-hour period compared to Haleta village. This was particularly relevant for overnight trips (as mentioned earlier). For those who remained in the village, there was no statistical difference between the two villages in the percentage of those inside the house (Tuguivili = 15%, Haleta = 19%) and inside the peri-domestic area (Tuguivili = 68%, Haleta = 72%) during 20:00–21:00 h (middle of the evening).
Quantifying human-vector interactions
Between 18:00–21:00 h, 18% of people were inside the house and 82%were outside (64%in peri-domestic areas, 18% in village) (Fig. 5). Of the 18% indoors only 7% were in the bedroom with access to an LLIN. Previous entomological studies from these villages documented that An. farauti is highly outdoor and early biting, with 0.8 bites/hour indoors and 2.1 bites/hour outdoors and 76% of all bites occurring between 18:00 h and 21:00 h21. Using this data to quantify human-vector interactions, on any given night 3.2 bites per person occurred inside and 8.2 bites per person occurred outside. Across the entire study population and across the entire night (18:00 to 06:00 h), 16% of all bites occurred inside and 84% outside. The proportion of bites that occurred inside tended to differ by age, with 24% (±18%) of bites for under 5 year olds, 21% (±17%) of bites for 5–18 ys and 12% (±12%) of bites for over 18-year olds occurring inside the house, noting the wide standard errors around these estimates.

Villager locations during peak mosquito biting timeparticipants inside the house acrosss (1800–2100 h).
Discussion
This study documented significant movement of people both within and beyond two villages in the Solomon Islands. Although almost everyone in the study had access to and ultimately slept under an LLIN, only 7% of people were under an LLIN during the 18:00–21:00 h peak biting period when 76% of An. farauti bites occur21. Transmission risk is a product of both the location of people and the biting activity of mosquitoes. By quantifying human-vector interactions in this manner, the greatest exposure to mosquito bites was determined to occur early in the evening when over half of people were on the veranda or in the adjacent external kitchen building, neither of which offer protection from mosquitoes. Thus, a large protection gap exists despite universal access and near universal use of LLINs for most people by virtue of their location within the outdoor peri-domestic area when most malaria mosquitoes are seeking blood meals.
Understanding small-scale heterogeneities in transmission requires high resolution human spatial data9. This is the first study to record the daily patterns of where and when people are, within and beyond villages, in the Solomon Islands. In the Solomon Islands, 80% of the population live in rural areas in nuclear families (mean of 5.3 people), 5% of whom are formally employed (by the government or in the private sector22). Houses are constructed on stilts with 99% of roofs constructed with iron sheets or leaf-thatch and 78% of walls made of wood or leaf-thatch with 96% of households having at least one LLIN23. The study population was representative of the Solomon Island population: 10% of participants were formally employed and resided in households with a mean of 5.4 people per house, 100% of houses were constructed on stilts with roofs of iron or leaf-thatch and with walls made of wood or leaf-thatch. All (100%) of participating households had LLINs. The methodology employed in this study (questionnaires and movement diaries) collected high quality fine-scale data on human movements by time and locations24, and focused on specific areas around and within the home in remote village settings. In contrast, mobile phone records and GPS technologies are unlikely to capture human movement with such fine granularity17, and further there is limited cell phone coverage in rural Solomon Islands. This study documented both frequent human movement within a village, and travel beyond the village boundaries in which a third of villagers spent an average of 3.6 nights away from the home village over a 2-weeks period. Malaria control programmes therefore need to protect people within villages and when travelling beyond the village, in particular between high and low transmission areas.
This study identified verandas and kitchens in the peri-domestic space as where most people are when malaria vectors are most actively seeking blood meals. These areas of high vector-human contact are open and exposed and are where residual transmission is maintained. These areas should be the focus of additional vector control strategies. Malaria programs can consider extending the usual application of residual insecticides to beyond the inside walls of house to include targeted spraying of the exterior walls of verandas and kitchens. World Health Organisation guidelines recommend that countries determine the locations where vectors bite and rest to determine locations for residual insecticide applications25. The findings of this study suggest that IRS should include kitchens and verandas in addition to the inside walls of houses. Alternatively, novel control methods such as insecticide-treated durable wall linings26, spatial repellents27,28,29, insecticidal paints or screening to mosquito-proof verandas and kitchens could be evaluated.
This study linked entomological data with fine scale human movement studies to define the locations where residual transmission occurs and to identify the locations where future strategies with the potential for preventing mosquito bites should focus. Gaps when LLINs are not protective were identified during the early evening when most vectors seek blood meals. During this time, most people are outside, in peri-domestic areas (e.g., on verandas or in the kitchen area) near their houses. The size of this protection gap will vary depending on the behaviours of the human and vector populations10. While LLINs continue to provide significant protection from malaria, supplemental vector control strategies are needed to accelerate transmission reduction. Even after malaria is eliminated, vector surveillance and control along with human behaviour research needs to be maintained in receptive areas where there is significant risk of importation of parasites by infected people13,30.
Methods
Study site
The study was conducted in two typical Solomon Island coastal villages (Haleta and Tuguivili; Fig. 6). Haleta village (population 366 people) is located on Ngella Sule Island in Central Province (9°5′56″ S, 160°6′56″ E). Central Province had an Annual Parasite Incidence (API) of 280 cases per 1,000 persons during 201531. The average human biting rate of An. farauti was 15 bites per person per night (b/p/n) during 2011–201421 Tuguivili village (population 167 people) is on New Georgia Island in Western Province (8°11′49″ S, 157°12′54″ E). Western Province had an API of 30 cases per 1,000 persons during 201531. The human biting rate of An. farauti was 3 b/p/n during 2015–201713. The mean daily coastal temperature for the Solomon Islands ranges between 24 °C and 30 °C with a mean of 27 °C and rainfall between 3000–5000 mm32. Anopheles farauti is the dominant malaria vector in the study villages (and the Solomon Islands as documented in previous studies33).
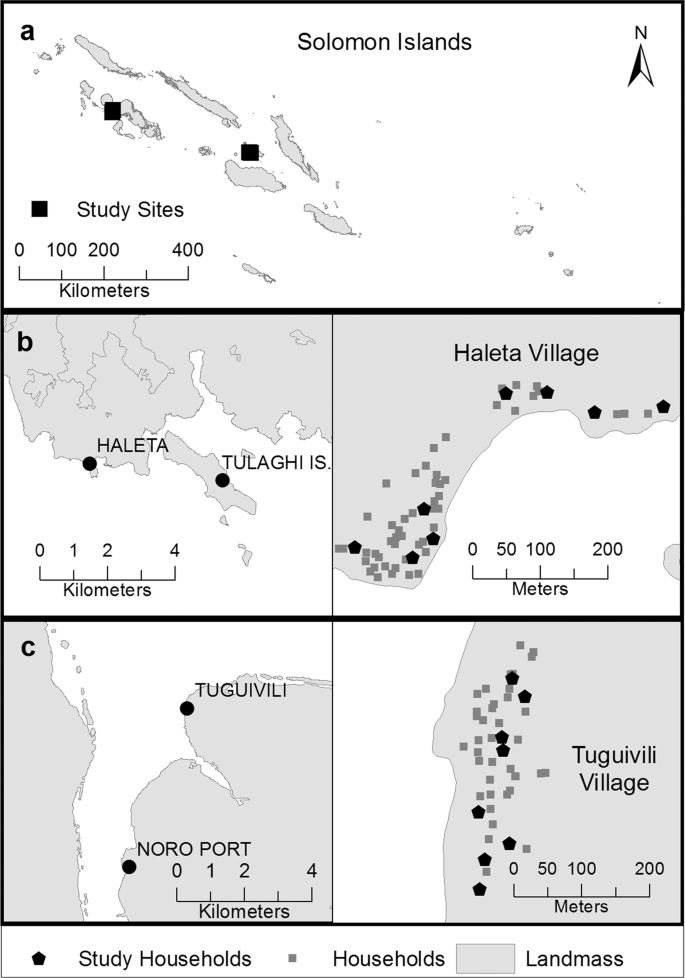
Map of (a) the Solomon Islands showing (b) location of Haleta village on Nggela Sule Island in Central Province (9°5′56″S, 160°6′56″E) on the right and detailed map of the positions of all households and study housholds on the left and (c) location of Tuguivili village on New Georgia Island in Western Province (8°11′49″S, 157°12′54″ E) on the left with the locations of the all households and study households on the right.
Greater than 80% of the Solomon Island population lives in rural villages. The villages are generally small, averaging 68 residents in 12.4 households. The economy is largely non-monetary with 96% of households practicing subsistence farming with 60% also fishing22. Annual household income in 2013 from selling crops, handicrafts and fish was USD 968 (SBD8011)34. More than 98% of Solomon Island residents are Christians and more than 95% are Melanesian22. Houses in the Solomon Islands are predominantly constructed on stilts with timber frames and timber or leaf-thatched walls, and with roofs of iron sheet or leaf-thatch. Five percent of rural households have electricity and fewer than 1% have television35. The houses have large open eaves and are homogenous in size with 2–3 bedrooms.
Interviews and movement diaries
The lead author (EJMP) conducted the recruitment and enrolment process after permission was obtained from the village chief to conduct research activities within the village. The village was divided into geographic zones, and households meeting the inclusion criteria were selected from each zone (see Fig. 6). The inclusion criteria included household heads having basic literacy, all household members being permanent residents of the study village, and being willing to provide informed consent. Households meeting the inclusion criteria were selected from each village zone.
A total of 86 people were enrolled from 16 households distributed across both villages (Fig. 6). The location of each resident was recorded for 14 days during July 2017. The demographic information of each household was captured with an initial questionnaire that included: number of household occupants, their age, gender and use of LLINs (number/household).
The location of each resident was recorded by the household heads using daily movement diaries for the 14-day period. All household heads received training in the use of the diaries but were not compensated for recording human movement data. Movement diary entries were recorded as short answers in English, the language of instruction in the Solomon Islands. Prior to the start of the study, data collection and recording were trialled for 2 days under the supervision of the lead author and translator to ensure comprehension of the data recording instructions and to ensure accurate recording of data. During the study, the lead author and the translator lived in the study villages and visited households in the evening to answer questions and to check progress including daily inspections of the movement diaries to ensure complete data capture for all recording periods for all household members. The informant recorded his/her movements and approximately 4 other household residents, using both direct observations and reported recall. The validity of diary entries was confirmed by spot checks of diary entries recorded by the informant against independent observations of residents’ locations by the senior author. The lead author and translator were fluent in Solomon Pijin, the lingua-franca used for discussions, clarifications and training.
During the day (06:00–18:00 h), data were recorded in 3 blocks of time, each of 4 h duration. During the evening (18:00–00:00 h), data were recorded hourly. A single block of time was recorded for the night (00:00 to 06:00) when limited people movement occurred. For each time period, the household head observed the location of the household members. Household heads acting as informants were provided synchronised watches set to chime hourly during movement recording periods to remind the household head to complete the diary every hour. The predominant location of each participant was recorded as short open text answers which were subsequently categorised into 4 main broad geographic areas (“Inside House”, “Peri-domestic area”, “Village” and “Beyond Village”, see Table 1). Data entries that could have multiple interpretations were clarified in consultation between informants and study investigators.
Statistical analysis
The age distribution of participants was described and compared with the national baseline average using a chi-squared contingency table (chisq. test). Baseline population data was accessed from projected figures for 2017 based on the 2009 census data22.
Generalised linear models (GLMs) with Gaussian distribution were used to analyse differences in: 1. the temporal location of participants compared between villages; 2. the number of nights that participants spend away from their home village by gender and village;3. the age of participants who travelled compared with the age of all participants; 4. the location of all participants across different times of the day and into the evening (06:00–22:00 h); 5. the location of all participants across different hours of the evening (18:00–00:00 h), 6. the location of participants between weekend and weekday days; and 7. the participants locations inside the house between age groups throughout the evening (18:00–00:00 h). The significance of the interaction between location of the participants and time of the day was analysed using a Chi-square test (anova) that compared the fit of two nested poisson GLM models. This statistical method was chosen because both the factors of location and time of the day were categorical. The eventual sleeping location and the usage of LLIN compared by age group used a chi-squared contingency table (chisq. test).
Quantifying human-vector interactions
Prior to conducting the human movement surveys, the biting behaviour of the local An. farauti population was quantified and published21. The proportion of human contact with mosquito bites occurring indoors (πi) was calculated by weighting the mean indoor and outdoor biting rate of An. farauti throughout the night by the proportion of humans indoors and outdoors at each time period (indoors being humans inside the houses) and outdoors being humans in the peri-domestic area to match with the mosquito data collected “inside” and “outside” of houses): \({\pi }_{i}=\sum [{I}_{t}{S}_{t}]/\sum [{O}_{t}(1-{S}_{t})]+{I}_{t}{S}_{t}\); where S = the proportion of humans indoors, I = the total number of mosquitoes caught indoors, O = the total number of mosquitoes caught outdoors [see10 for more detail].
Study limitations
This study had several limitations. This was a small study documenting the locations of 86 people from 16 households in two villages across a single 14-day period. Both villages were ‘typical’ rural villages in a ‘typical period of village life’ where people live in family groups on their customary land and engaged in the rural subsistence economy (96% of the 80% rural population of the Solomon Islands practices subsistence agriculture22). However, the study may have been improved by monitoring the movements of a greater number of households in villages across more provinces. The single 14-day period study period did not allow data collection from different periods of the year, seasons or during social/cultural events. However, the lack of distinct and/or extended wet and dry seasons in the Solomon Islands coupled with the near universal, practice of subsistence farming results in rural village populations having very regular and predictable daily/weekly activity patterns (e.g, tending gardens, selling excess produce at local markets and/or fishing). Almost everybody returns to their village each night and engages with their extended family who live together in the village. Extending the study to include a period of enhanced social movement, for example at Christmas or another religious or cultural event, when former residents return to their ‘home’ village, would have provided information about people movements in ‘non-typical’ periods.
The movement data was composed of both direct visual observations and self-reported recall. Self-reported recall may introduce social desirability bias where respondents report locations that they think are ‘correct’ for the purpose of the study. For example, self-reported use of mosquito bednets is often over-reported (as they are likely to have been in this study). However, during the evening period when most An. farauti bites occur, most people were recorded in directly observable locations. As there is no obvious ‘correct’ answer for locations of individuals, social desirability bias would be minimal. This study did not incorporate cell phone generated data which could have provided information on destinations of village residents moving longer distance. However, as the study focus was on detailing at a very fine scale human locations within villages, cell phones would not have provided detailed information on locations of humans within houses or have distinguished locations within the peri-domestic area. Future research should consider these limitations when designing additional studies.
Ethical approval and informed consent
Ethics approval for this study was provided by the Solomon Islands Health Research and Ethics Review Board (No. HRE046/16) and the James Cook University Research Ethics Committee (No. H6840). All research was performed in accordance with relevant guidelines and regulations of these research boards, and as stipulated in the approvals. Each participant completed a written informed consent form before participating in the surveys, noting that consent for minors and children was provided by the household head. The village chief gave permission for work in the village and also provided permission for each selected household to be involved.
Data availability
The anonymised and categorised datasets supporting the conclusions of this article are available in the JCU Tropical Data Hub repository: https://doi.org/10.25903/5cbe61a46c51f.
References
Apperson, C. S. et al. Host feeding patterns of established and potential mosquito vectors of West Nile Virus in the Eastern United States. Vector-Borne and Zoonotic Diseases 4, 71–82, https://doi.org/10.1089/153036604773083013 (2004).
Shriram, A. N., Ramaiah, K. D., Krishnamoorthy, K. & Sehgal, S. C. Diurnal pattern of human-biting activity and transmission of subperiodic Wuchereria bancrofti (Filariidea: Dipetalonematidae) by Ochlerotatus niveus (Diptera: Culicidae) on the Andaman and Nicobar Islands of India. The American Journal of Tropical Medicine and Hygiene 72, 273–277 (2005).
Geissbühler, Y. et al. Interdependence of domestic malaria prevention measures and mosquito-human interactions in urban Dar es Salaam, Tanzania. Malaria Journal 6, 1–17, https://doi.org/10.1186/1475-2875-6-126 (2007).
Smith, D. L. et al. Recasting the theory of mosquito-borne pathogen transmission dynamics and control. Transactions of The Royal Society of Tropical Medicine and Hygiene 108, 185–197, https://doi.org/10.1093/trstmh/tru026 (2014).
Wesolowski, A. et al. Quantifying the impact of human mobility on malaria. Science 338, 267–270, https://doi.org/10.1126/science.1223467 (2012).
Stoddard, S. T. et al. The role of human movement in the transmission of vector-borne pathogens. PLoS Negl Trop Dis 3, e481 (2009).
Gryseels, C. et al. Re-imagining malaria: Heterogeneity of human and mosquito behaviour in relation to residual malaria transmission in Cambodia. Malaria Journal 14, https://doi.org/10.1186/s12936-015-0689-0 (2015).
Pindolia, D. K. et al. Quantifying cross-border movements and migrations for guiding the strategic planning of malaria control and elimination. Malaria Journal 13, 1–11, https://doi.org/10.1186/1475-2875-13-169 (2014).
Pindolia, D. et al. Human movement data for malaria control and elimination strategic planning. Malaria Journal 11, 205 (2012).
Killeen, G. F. et al. Quantifying behavioural interactions between humans and mosquitoes: evaluating the protective efficacy of insecticidal nets against malaria transmission in rural Tanzania. BMC Infectious Diseases 6, 161, https://doi.org/10.1186/1471-2334-6-161 (2006).
Cooke, M. et al. ‘A bite before bed’: exposure to malaria vectors outside the times of net use in the highlands of western Kenya. Malaria Journal 14, 259 (2015).
Monroe, A. et al. Outdoor-sleeping and other night-time activities in northern Ghana: implications for residual transmission and malaria prevention. Malaria Journal 14, 35, https://doi.org/10.1186/s12936-015-0543-4 (2015).
Burkot, T. R. et al. Spatial-temporal heterogeneity in malaria receptivity is best estimated by vector biting rates in areas nearing elimination. Parasites & Vectors 11, 606, https://doi.org/10.1186/s13071-018-3201-1 (2018).
Russell, T. L. et al. Anopheles farauti is a homogeneous population that blood feeds early and outdoors in the Solomon Islands. Malaria Journal 15, 151, https://doi.org/10.1186/s12936-016-1194-9 (2016).
Buckee, C. O., Wesolowski, A., Eagle, N. N., Hansen, E. & Snow, R. W. Mobile phones and malaria: Modeling human and parasite travel. Travel medicine and infectious disease 11, 15–22 (2013).
Ruktanonchai, N. W. et al. Identifying malaria transmission foci for elimination using human mobility data. PLOS Computational Biology 12, e1004846, https://doi.org/10.1371/journal.pcbi.1004846 (2016).
Tatem, A. J. Mapping population and pathogen movements. International Health 6, 5–11, https://doi.org/10.1093/inthealth/ihu006 (2014).
Bousema, T. et al. Hitting hotspots: Spatial targeting of malaria for control and elimination. PLoS Medicine 9, e1001165, https://doi.org/10.1371/journal.pmed.1001165 (2012).
World Health Organization. World malaria report 2018. World Health Organization, Geneva (2018).
O’Sullivan, M. et al. Malaria elimination in Isabel Province, Solomon Islands: establishing a surveillance-response system to prevent introduction and reintroduction of malaria. Malaria Journal 10, 235 (2011).
Russell, T. L. et al. Frequent blood feeding enables insecticide-treated nets to reduce transmission by mosquitoes that bite predominately outdoors. Malaria Journal 15, 156, https://doi.org/10.1186/s12936-016-1195-8 (2016).
Solomon Islands National Statistics Office. Report on 2009 Population & Housing Census. (2009).
National Vector Borne Disease Control Program. Solomon Islands Malaria Indicator Survey (2011).
Paz-Soldan, V. A. et al. Strengths and weaknesses of global positioning system (GPS) data-loggers and semi-structured interviews for capturing fine-scale human mobility: Findings from Iquitos, Peru. PLOS Neglected Tropical Diseases 8, e2888, https://doi.org/10.1371/journal.pntd.0002888 (2014).
World Health Organization. Indoor Residual Spraying: An operational manual for indoor residual spraying (IRS) for malaria transmission control and elimination. World Health Organization, Geneva (2013).
Messenger, L. A. & Rowland, M. Insecticide-treated durable wall lining (ITWL): future prospects for control of malaria and other vector-borne diseases. Malaria Journal 16, 213, https://doi.org/10.1186/s12936-017-1867-z (2017).
Ogoma, S. B. et al. A low technology emanator treated with the volatile pyrethroid transfluthrin confers long term protection against outdoor biting vectors of lymphatic filariasis, arboviruses and malaria. PLOS Neglected Tropical Diseases 11, e0005455, https://doi.org/10.1371/journal.pntd.0005455 (2017).
Govella, N. J., Ogoma, S. B., Paliga, J., Chaki, P. P. & Killeen, G. Impregnating hessian strips with the volatile pyrethroid transfluthrin prevents outdoor exposure to vectors of malaria and lymphatic filariasis in urban Dar es Salaam, Tanzania. Parasites & Vectors 8, 322, https://doi.org/10.1186/s13071-015-0937-8 (2015).
Masalu, J. P. et al. Efficacy and user acceptability of transfluthrin-treated sisal and hessian decorations for protecting against mosquito bites in outdoor bars. Parasites & Vectors 10, 197, https://doi.org/10.1186/s13071-017-2132-6 (2017).
Monroe, A., Moore, S., Koenker, H., Lynch, M. & Ricotta, E. Measuring and characterizing night time human behaviour as it relates to residual malaria transmission in sub-Saharan Africa: a review of the published literature. Malaria Journal 18, 6, https://doi.org/10.1186/s12936-019-2638-9 (2019).
Monitoring and Evaluation Unit. Solomon Islands Annual Malaria Programme Report 2016. National Vector Borne Diseases Control Program, Ministry of Health & Medical Services, Honiara, Solomon Islands (2017).
Division of Solomon Islands Meteorological Services. Solomon Islands Climate, www.met.gov.sb (2017).
Bugoro, H. et al. The bionomics of the malaria vector Anopheles farauti in Northern Guadalcanal, Solomon Islands: issues for successful vector control. Malaria Journal 13, 56, https://doi.org/10.1186/1475-2875-13-56 (2014).
Solomon Islands National Statistics Office. Solomon Islands 2012/13household income and expenditure survey provincial analytical report (Volume II). Ministry of Finance and Treasury, Honiara (2015).
Solomon Islands National Statistics Office. Solomon Islands demographic and health survey 2006–2007. Ministry of Finance and Treasury, Honiara (2009).
Acknowledgements
Technical assistance when conducting the field work was provided by Jance Oscar and John Lodo, formerly of the Vector Borne Disease Control Programme, Solomon Islands. The authors thank the communities of Haleta and Tuguivili villages as well as the support of Albino Bobogare, Director of National Vector Borne Disease Control Programme, Solomon Islands. This work was supported by a PhD scholarship from Rotarians Against Malaria to E.J.M.P. The support of the National Institute of Allergy and Infectious Diseases of the National Institutes of Health for the International Centers of Excellence in Malaria Research in the Southwest Pacific (subaward U19AI08986 to James Cook University) is gratefully acknowledged.
Author information
Authors and Affiliations
Contributions
E.J.M.P., D.M., T.L.R. and T.R.B. conceived the experiments. T.R.B. secured funding to support the studies. E.J.M.P. conducted the experiments. E.J.M.P. and T.L.R. analysed the results. E.J.M.P. wrote the original draft. All authors reviewed the manuscript.
Corresponding authors
Ethics declarations
Competing interests
Each author (Edgar J. M. Pollard, David MacLaren, Tanya L. Russell and Thomas R. Burkot) declares that they have neither competing financial nor nonfinancial interests.
Additional information
Publisher’s note Springer Nature remains neutral with regard to jurisdictional claims in published maps and institutional affiliations.
Rights and permissions
Open Access This article is licensed under a Creative Commons Attribution 4.0 International License, which permits use, sharing, adaptation, distribution and reproduction in any medium or format, as long as you give appropriate credit to the original author(s) and the source, provide a link to the Creative Commons license, and indicate if changes were made. The images or other third party material in this article are included in the article’s Creative Commons license, unless indicated otherwise in a credit line to the material. If material is not included in the article’s Creative Commons license and your intended use is not permitted by statutory regulation or exceeds the permitted use, you will need to obtain permission directly from the copyright holder. To view a copy of this license, visit http://creativecommons.org/licenses/by/4.0/.
About this article

Cite this article
Pollard, E.J.M., MacLaren, D., Russell, T.L. et al. Protecting the peri-domestic environment: the challenge for eliminating residual malaria. Sci Rep 10, 7018 (2020). https://doi.org/10.1038/s41598-020-63994-6
Received:
Accepted:
Published:
DOI: https://doi.org/10.1038/s41598-020-63994-6
This article is cited by
-
Human landing catches provide a useful measure of protective efficacy for the evaluation of volatile pyrethroid spatial repellents
Parasites & Vectors (2023)
-
Getting to zero: micro-foci of malaria in the Solomon Islands requires stratified control
Malaria Journal (2021)
-
How radical is radical cure? Site-specific biases in clinical trials underestimate the effect of radical cure on Plasmodium vivax hypnozoites
Malaria Journal (2021)
-
Quantifying and characterizing hourly human exposure to malaria vectors bites to address residual malaria transmission during dry and rainy seasons in rural Southwest Burkina Faso
BMC Public Health (2021)
Comments
By submitting a comment you agree to abide by our Terms and Community Guidelines. If you find something abusive or that does not comply with our terms or guidelines please flag it as inappropriate.
