
Abstract
Diatoms are the most diverse and abundant group of phytoplankton species and represent a huge reservoir of marine natural products with possible application for human health. Several diatoms are known to have anticancer, anti-inflammatory, antioxidant and anti-microbial properties, but the compounds responsible of these activities are often still unknown. The diatom Cylindrotheca closterium showed anti-inflammatory properties inhibiting TNFα release in human monocytic leukemia cells. In this study, we present the full transcriptome of C. closterium, and used an -omic approach to identify transcripts coding enzymes that can be involved in the synthesis/degradation of anti-inflammatory compounds. This approach allowed to identify phosphatidylinositol-3-phosphatase, phosphatidylinositol 3-kinase catalytic subunit type 3, phosphatidylinositol N-acetylglucosaminyltransferase subunit A, monogalactosyldiacylglycerol synthase and violaxanthin de-epoxidase, which are known to be involved in anti-inflammatory compound metabolism. When C. closterium was cultured in silica-starvation conditions, selected as stress condition to potentially trigger the synthesis of bioactive metabolites, anti-inflammatory activity was lost and expression levels of the analyzed transcripts were reduced. These data suggested that the control culturing condition was the most active. This study used for the first time a transcriptomic-guided approach to identify enzymes involved in anti-inflammatory compound metabolism, directing future discoveries of marine natural products in microalgae.
Introduction
Diatoms are the most diverse group of phytoplankton with an estimation of 200,000 different species1. Their diversity offers an enormous reservoir of new compounds with possible biotechnological applications2. Throughout the last decades, enhancement in the multi-omics methodologies (such as genomics, transcriptomics, proteomics and metabolomics) lead to exploration and exploitation of diatom properties, supporting the identification and characterization of new marine natural products and enzymes with possible applications in the blue biotechnology field2,3,4,5,6. Diatoms have been already shown to have antioxidant7, anti-diabetes8, anticancer9, antibacterial7,10, anti-tuberculosis11, anti-epilepsy12 and anti-inflammatory7,10,13 properties.
Recently, various studies have been carried out for identification of microalgal compounds with anti-inflammatory activities for human applications (e.g. drugs or nutraceuticals14). The most known microalgal compounds with anti-inflammatory properties are various carotenoids, polyunsaturated fatty acids (PUFA) and certain carbohydrates15,16,17. In addition, other studies have reported microalgal anti-inflammatory properties but the bioactive chemical entities are still unknown7,10.
Currently, six diatoms showed anti-inflammatory properties: Porosira glacialis, Attleya longicornis7, Cylindrotheca closterium, Odontella mobiliensis, Pseudonitzschia pseudodelicatissima10 and Phaeodactylum tricornutum14,18. Both Lauritano et al.10 and Ingebrigtsen et al.7 carried out an assessment of the capability of inhibition of the tumour necrosis factor α release, one of the fundamental mediators of inflammation19, in lipopolysaccharide-stimulated human monocytic leukaemia cells (THP-1). Samarakoon et al.18 evaluated the inhibition of NO production (%) level, another inflammatory mediator, in LPS-induced RAW macrophages. Even though these approaches allowed to identify diatoms with anti-inflammatory properties, they did not reveal yet the microalgal bioactive metabolite(s).
In this study, a transcriptomic approach has been used in order to identify transcripts that can be involved in the synthesis/degradation of compounds with anti-inflammatory properties in the diatom Cylindrotheca closterium. In particular, we sequenced the transcriptome of C. closterium in both control (complete medium) and stress conditions (Silica-starvation). Nitrogen- and phosphate-starvation have already shown to reduce the anti-inflammatory bioactivity of C. closterium10. The reason behind stressing the microalgae is to trigger the activation of the broadest range of metabolic pathways of interest, which can be silent under control conditions. Diatoms require silica (Si) to build the frustules that surround the cell and we hypothesized that Si-starvation could induce a stress response in the cell with possible activation of metabolic pathways of interest. Si is also known to be important for transporting gases and solutes, light penetration and defence against predators. For many diatoms, Si-depletion is known to induce cell cycle and growth arrest20,21,22,23. Therefore, Si is an important limiting factor for diatom productivity and may lead to alterations in cellular homeostasis. In this study, Si-starvation was chosen rather than complete Si-depletion in order to avoid cell death and, at the same time, inducing a less severe stress exposure. Previous studies on various microalgae have shown that Si-starvation/depletion induced a metabolic remodelling, including the activation of specific pathways involved in the synthesis of potential bioactive metabolites24,25.
Among microalgal compounds, phosphatidylinositol, monogalactosyldiacylglycerols and various carotenoids are known to have anti-inflammatory properties26,27,28,29,30 and we looked for enzymes involved in their synthesis/degradation. This is the first study investigating transcripts involved in the metabolism of anti-inflammatory metabolites in C. closterium, showing that they are differentially expressed under stress exposure and providing information directing the chemical discovery of new marine natural products in diatoms.
Results and Discussion
Transcriptome sequencing and de novo assembly
RNA sequencing (RNA-seq) experiment was performed on 6 samples: a triplicate derived from the microalga C. closterium cultured in complete medium and considered as control condition (CTRL), and a triplicate of C. closterium cultured in Si-starvation conditions (Si-starved). Since the genome of C. closterium is not available, RNA-seq reads have been assembled with de novo approach producing 44718 putative transcripts grouped into 33433 genes. The mean GC content was 46.16%. The average and the median contig length were 1064 bp and 781 bp, respectively. The N50 was 1554 bp.
Several controls were performed on the raw transcriptome assembly to check for its quality. Transcripts were translated into proteins obtaining a total of 32586 protein sequences (minimum length 50aa). Among those, 14307 (43.90%) were complete (with a methionine and a stop codon), 2855 (8.76%) started with a methionine but lacked a stop codon, 8194 (25.14%) only had a stop codon, 7230 (22.18%) did not start with a methionine and did not have a stop codon.
In order to verify the completeness of the assembly, the protein sequences were blasted against the two datasets of the Core Eukaryotic Genes, including 248 (http://korflab.ucdavis.edu/Datasets/genome_completeness/) and 458 (http://korflab.ucdavis.edu/datasets/cegma/) protein sequences, respectively. 248 out of 248 (100%) and 456 out of 458 (99.56%) could be detected in the assembly. In addition, the length of the proteins from the assembly was compared to the length of the core eukaryotic genes. About 403 of the proteins covered more than 90% of the length of the corresponding core eukaryotic proteins and 536 covered more than 80% of the length of the corresponding core eukaryotic protein, indicating a good quality of the assembly.
As NGS data could suffer from contaminations of organisms that are not the target of the experiment, we blasted the sequences of the transcripts against the NCBI database of bacteria and archaea in order to remove possible contaminations. By this way, 172 transcripts were detected and removed. In order to detect other sources of contamination, the distribution of the GC content was analysed in the dataset. As already mentioned, the GC content followed a normal distribution with a mean value of 45.84% and a standard deviation of 3.48. Following a z‐test, 5445 sequences could be identified for having a GC content significantly different from the observed mean (p < 0.01). Those sequences were blasted against the NCBI (nr) database to look for contaminants. About 878 sequences were removed for matching bacterial or metazoan sequences.
The obtained assembly was initially composed by 43668 transcripts belonging to 32606 genes. The mean GC content was 46.11%. The average and the median contig length were 1079.06 bp and 803 bp, respectively. The N50 was 1564 bp.
Functional annotation
Assembled transcript sequences were translated into proteins with Transdecoder (minimum length of 50 aa). When multiple translations were possible, the priority was set in order to get the longest complete ORF; when a complete ORF was not detected the longest sequence was kept. The sequences were also investigated for the presence of repetitive elements with Repeat Masker. The software Blast2GO was used to associate a function to the assembled transcripts. A total of 20540 proteins got significant blast hits, and among these 11178 proteins had gene ontology (GO) terms associated. During the blast step, we realized that some proteins had human or bacterial hits, 355 and 103 respectively. These sequences were removed from downstream analysis. Finally, the filtered assembly was composed by 43210 transcripts grouped into 32251 genes (Table 1). The mean GC content was 46.10%. The average and the median contig length were 1078.34 bp and 803 bp, respectively. The N50 was 1561 bp. The final dataset was then translated into proteins (minimum length 50 aa) obtaining a total of 31613 protein sequences. Among these, 14162 (44.79%) were complete protein sequences (with a methionine and a stop codon), 2782 (8.8%) started with a methionine but lacked a stop codon, 7957 (22%) had only a stop codon, 6712 (25.17%) did not start with a methionine and did not have a stop codon.
Differential expression analysis
Differential expression analysis identified 1818 genes with significant expression variations in Si-starved condition compared to control. Among them, 845 were up-regulated (among these, 191 had an NCBI NR assignment), while 973 were down-regulated (among these, 361 had an NCBI NR assignment). The full list of DEGs, log fold change (logFC), false discovery rate (FDR) and their NCBI NR assignment are reported in the Supplementary Table 1.
Among the Differentially Expressed Genes (DEGs), Si-starvation induced an up-regulation on various unknown proteins, tkl dicty4 protein kinase (FDR < 1,35E-004), rna pseudouridine (FDR < 8,82E-003) and a transketolase (FDR < 0). Conversely, Si-starvation induced a strong down-regulation of vacuolar iron family transporter (FDR < 0), sodium bile acid cotransporter 7 isoform x1 (FDR < 6,48E-005) and two ABC transporters (FDR < 6,97E-009 and 1,01E-003, respectively).
Up-regulated transcripts were mainly involved in pathways related to bicarbonate transporters (R-HSA-425381), integrin cell surface interactions (R-HSA-216083) and unwinding of DNA (R-HSA-176974). On the contrary, transcripts involved in pathways related to Na+/Pi cotransporters (R-HSA-427589), transport of bile salts, organic acids, metal ions and amine compounds (R-HSA-425366), ABC transporters in lipid homeostasis (R-HSA-1369062), biotin transport (R-HSA-196780) and metabolism of folate and pterines (R-HSA-196757) were down-regulated when cultured in Si- starvation. In order to validate differential expression analysis between the control and Si-starvation conditions, 13 transcripts were tested using reverse transcription-quantitative PCR (RT-qPCR; gene names and primers are reported in Supplementary Tables 2 and 3). A significant positive correlation was established between RNAseq and RT-qPCR analyses (R = 0.8767, p value < 0.00001), supporting the results obtained by RNA-Seq.
Identification of transcripts related to anti-inflammatory compound metabolism
We identified 5 transcripts coding for enzymes involved in the synthesis of compounds with possible anti-inflammatory activity: Phosphatidylinositol-3-Phosphatase (PtdIns(3)), Phosphatidylinositol 3-kinase catalytic subunit type 3 (PIK3C3), Phosphatidylinositol N-acetylglucosaminyltransferase subunit A (PIGA), Monogalactosyldiacylglycerol synthase (MGD), and Violaxanthin De-Epoxidase (VDE). These were selected as genes of interest (GOI) for this study.
Several inositol derivatives, such as phosphatidylinositol, are known to have anti-inflammatory activity26,30,31 and have been also quantified in several microalgae to be proposed as supplement in diet32. PtdIns(3), PIK3C3 and PIGA are the main enzymes involved in the inositol phosphate metabolism (KEGG pathway ec00562), and were selected as GOI for RT-qPCR analyses in this study. In particular, PtdIns(3) converts 1-phosphatidyl-1D-myo-inositol 3-phosphate in 1-phosphatidyl-1D-myo-inositol, while PIK3C3 and PIGA convert a 1, 2-diacyl-sn-glycero-3-phospho-(1D-myo-inositol) in a 1, 2-diacyl-sn-glycero-3-phospho-(1D-myo-inositol 3-phosphate) and a 6-(N-acetyl-α-D-glucosaminyl)-1-phosphatidyl-1D-myo-inositol, respectively (https://www.uniprot.org/uniprot/Q6PF93, https://www.uniprot.org/uniprot/P37287). Phosphatidylinositol 3-kinase is known to regulate key events in inflammatory responses, and there are also studies on genetically-modified mice with altered phosphatidylinositol 3-kinase signaling in order to understand its role in chronic inflammation mouse models33. Another selected transcript was MGD, essential for the synthesis of monogalactosyldiacylglycerols (MGDG)34. Several microalgae are known to be rich in MGDG containing a high proportion of polyunsaturated fatty acids (PUFAs) with potential nutraceutical and pharmaceutical applications35. MGDG are known to have anti-inflammatory activity reducing the release of inflammatory mediators (i.e. interleukins) and inhibiting the generation of superoxide anion34.
Finally, the transcript coding VDE was selected as well. VDE converts violaxanthin to zeaxanthin and both of them, as well as other carotenoids, are known to possess anti-inflammatory activities36,37 and have been widely studied in microalgae for their potential health benefits15. Primers were designed in order to amplify the five selected transcripts, their expression levels were analyzed in both control and Si-starvation conditions by RT-qPCR and in silico prediction of the three-dimensional structures of their corresponding proteins was performed.
Reference gene assessment and GOI expression level analyses
In order to study GOIs expression levels, a panel of putative reference genes (RGs) was screened. Selected genes were included in those already used as RGs for other microalgae38,39,40,41,42. Results on the assessment of the best RGs obtained by three different software are reported in Fig. 1. According to the results obtained by BestKeeper, the lowest standard deviation (SD) was obtained for α-tubulin (Tub-α), followed by calmodulin (CaM) and glyceraldehyde 3-phosphate dehydrogenase (GAPDH) (Fig. 1a), which indicated that the most stable RG was Tub-α. According to NormFinder, the lowest stability values were calculated for GAPDH, Act and CaM; therefore, they were suggested as best candidate RGs (Fig. 1b). According to the statistical approach of geNorm, the two most stable genes (i.e., with the lowest expression stability, M) were actin (Act) and translation elongation factor-like protein (EFL) (Fig. 1c). Pairwise variation was calculated for assessment of the effect of adding another RG to those already analysed. The obtained results indicated that the addition of other RGs was not required since the value for V2/3 is below the cutoff of 0.15 (Fig. 1d). Considering the best RGs assigned by each software, Tub-α, GAPDH, Act and EFL were selected as RGs for RT-qPCR analyses. The best predicted RGs were different compared to other diatoms (such as Skeletonema marinoi, Pseudo-nitzschia multistriata and P. arenysensis39,40,42 since their stability is related to the studied species, growth phases and studied conditions (e.g. nutrient starvation/depletion and CO2 exposure).
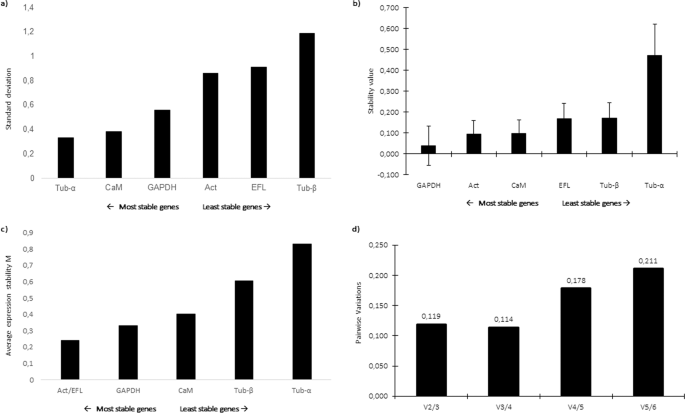
Reference gene assessment for Cylindrotheca closterium. Ranking of the best reference genes obtained with (a) BestKeeper (lowest standard deviation), (b) NormFinder (lowest expression stability value) and (c) geNorm (lowest average expression stability M) softwares. (d) According to geNorm algorithm, the inclusion of additional reference genes was not required for values below the cut-off of 0.15. The selected genes were: Actin (Act), Glyceraldehyde 3-Phosphate Dehydrogenase (GAPDH), Translation elongation factor-like protein (EFL), Calmodulin (CaM), α-tubulin (Tub-α) and β-tubulin (Tub-β).
Relative expression levels of the selected GOIs were analyzed in order to investigate the effect of Si-starvation on their expression. Figure 2 displays GOI expression levels in C. closterium cultured in Si-starvation compared to the control condition (x-axis). According to REST analysis, among the GOI, Gal-9, PIGA, PK3C3 and VDE showed significant down-regulation under Si-starvation (p < 0.001 for all), suggesting that there is higher probability to find their corresponding proteins and products in control conditions. For the other transcripts, changes were not significant. Even if whole transcriptome expression analyses in response to Si-starvation were already done for Phaeodactylum tricornutum43 and Thalassiosira pseudonana44,45, our GOIs were not previously studied. Hook et al.46 also sequenced the transcriptome of a C. closterium clone using 454 pyrosequencing and investigated its ecotoxicogenomic response by exposing the microalgae to various coastal contaminants (e.g. a photosystem II inhibiting herbicide, ammonia, copper and crude oil). However, due to differences in the aims of the studies and in the studied genes, a direct comparison with the present work was not possible.
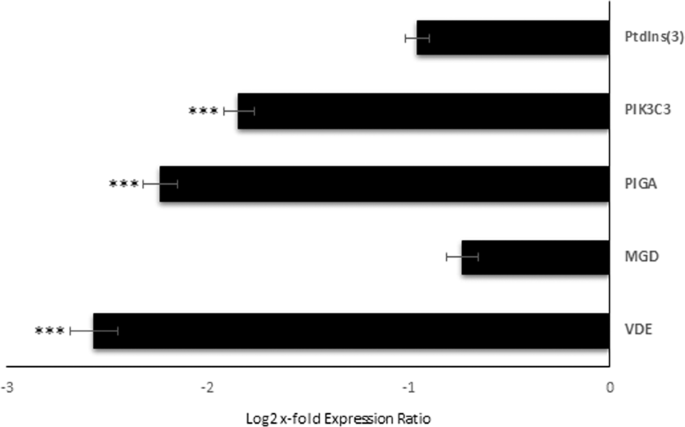
Expression levels of selected genes of interest in C. closterium cells cultured in silica starvation compared to the control condition. Data are represented as log2 x-fold expression ratio ± SD (n = 3). C. closterium cultured in complete medium was used as control (represented in the figure by x-axis; *** for p < 0.001). Gene abbreviations were Phosphatidylinositol-3-Phosphatase (PtdIns(3)), Phosphatidylinositol 3-kinase catalytic subunit type 3 (PIK3C3), Phosphatidylinositol N-acetylglucosaminyltransferase subunit A (PIGA), Monogalactosyldiacylglycerol synthase (MGD), and Violaxanthin De-Epoxidase (VDE).
Domain identification and structure prediction of proteins encoded by selected GOI
With the aim of supporting the quality assessment of the selected GOIs, we performed an InterProScan analysis on the entire protein collection of C. closterium, obtaining an exhaustive functional characterization for each protein sequence. In Table 2, functional annotations from PFAM (protein families) and InterPro (protein domains) databases of five selected GOIs involved in anti-inflammatory compound metabolism are shown. This is the first study to investigate and identify transcripts involved in the synthesis of inflammatory mediators in diatoms and in silico predicting their three-dimensional structures.
In order to further investigate the selected GOIs at protein structure levels, we in silico predicted their three-dimensional structure by fold recognition approach (Kelley et al. 2015 https://www.ncbi.nlm.nih.gov/pubmed/25950237) (Fig. 3). The modeled structures showed PHYRE2 confidence scores that range between 99, 5% and 100%.

In silico protein structure predictions of five proteins encoded by the selected genes of interest. Protein structure predictions, colored by rainbow from N to C terminus, for Gal-9 (a), PtdIns(3) (b), PIK3C3 (c), PIGA (d), MGD (e) and VDE (f). Three-dimensional structures are indicated as follows: α-helices are represented by helices, β-strands are represented by arrows, coils are represented by simple lines.
Anti-inflammatory testing
C. closterium anti-inflammatory activity was screened by monitoring the release of tumor necrosis factor α (TNFα) in human THP-1 cells. Microalgae cultured in Si-starvation condition did not show anti-inflammatory activity (8% TNFα-inhibition, p > 0.05). Similarly, previous studies have shown that C. closterium cultured in nitrogen- and phosphate-starvation did not show anti-inflammatory activity, while the same species cultured in control condition (complete medium) induced more than 80% TNFα-inhibition10. These data suggest that in stressful conditions, such as nutrient starvation, C. closterium should not produce anti-inflammatory molecule/s or produce very low amounts. This information will direct future chemical analyses in C. closterium cultured in control conditions and guide marine natural product discovery increasing diatom applications in the blue biotechnology sector.
Materials and Methods
Cell culturing and harvesting
The diatom Cylindrotheca closterium was cultured in Guillard’s F/2 medium47. Experimental culturing was performed in triplicate for both control (CTRL) or Si-starvation conditions. In particular, microalgae cultured in control condition were cultivated in complete F/2 medium47, while for Si-starvation experiments, 36 μM Si(OH)4 was used. Culturing was carried out in 2-litre polycarbonate bottles, constant bubbling with air filtered through 0.2 μm membrane filters in a climate chamber at 19 °C on a 12:12 hours light:dark cycle and at 100 μmol photons m−2 s−1. Initial cell concentrations were approximately 5000 cells/mL for each replicate, and culture growth was daily monitored from samples fixed with one drop of Lugol (final concentration of about 2%) and counted in a Bürker counting chamber under an Axioskop 2 microscope (20×) (Carl Zeiss GmbH). Aliquots of 50 ml were sampled when the stationary phase was reached (Day 7), and centrifuged for 15 minutes at 4 °C at 1900 g (Eppendorf, 5810R). For RNA extraction, microalgal pellets were resuspended in 500 μL of TRIZOL© (Invitrogen, Carlsbad, CA), incubated for 2–3 min at 60 °C until completely dissolved, frozen in liquid nitrogen and kept at −80 °C till RNA extraction procedure (as in40). For chemical extraction and anti-inflammatory activity, pellets were frozen in liquid nitrogen and kept at −80 °C till further processing.
RNA extraction
RNA extraction was performed following TRIZOL® manufacturer’s instructions (as in40). Afterwards, each sample was treated with DNase I (Invitrogen) using the instruction’s manual in order to remove hypothetically contaminating DNA. The assessment of RNA quantity was carried out by using Nano-Drop (ND-1000 UV–Vis spectrophotometer; NanoDrop Technologies), monitoring the absorbance at 260 nm and the 260/280 nm and 260/230 nm ratios. RNA samples were considered good when both ratios were approximately 2. RNA quality was also assessed on 1% agarose gel, showing intact 18S and 28S ribosomal bands. Total RNA quality was evaluated by measuring the RNA Integrity Number (RIN) with Agilent 2100 Bioanalyzer (Agilent Technologies, Inc.). High quality (RIN > 8) RNA was used for both RNAseq and RT-qPCR.
RNA sequencing
Next generation sequencing experiments, including samples quality control, were performed by Genomix4life S.R.L. (Baronissi, Salerno, Italy). Indexed libraries were prepared from 2 ug/ea purified RNA with TruSeq Stranded mRNA Sample Prep Kit (Illumina) according to the manufacturer’s instructions. Libraries were quantified using the Agilent 2100 Bioanalyzer (Agilent Technologies) and pooled in a way that each index-tagged sample was present in equimolar amounts, with final concentration of the pooled samples of 2 nM. The pooled samples were subject to cluster generation and sequencing using an Illumina HiSeq. 2500 System (Illumina) in a 2 × 100 paired-end format at a final concentration of 8 pmol. The raw sequence files generated (.fastq files) underwent quality control analysis using FastQC (http://www.bioinformatics.babraham.ac.uk/projects/fastqc/).
Transcriptome assembly, annotation, expression quantification and differential expression analysis
Illumina paired-end 100 bp reads were processed to produce the transcriptome assembly. Reads are freely available under the series entry PRJNA577416 in the NCBI BioProject database. Raw reads were trimmed and clipped with BBDuk (https://jgi.doe.gov/data-and-tools/bbtools/) setting a minimum Phred-like quality of 25 and a minimum length of 35 nucleotides. The quality of the reads before and after trimming was checked with the software FASTQC (http://www.bioinformatics.babraham.ac.uk/projects/fastqc/). High quality reads were then normalized with Trinity48 using the options:–SS_lib_type RF–pairs_together–max_cov 50. De novo transcriptome assembly was then performed with Trinity using the options:–SS_lib_type RF–no_normalize_reads–min_kmer_cov 1–KMER_SIZE 32. Transcriptome redundancy was removed with CD-HIT-EST49 using the following options: -r 0 -g 1. A filter for contaminants was applied by performing a BLAST search of the transcripts against the NCBI nr database, discarding all the sequences having a significant hit (evalue <= 0.0001) against bacteria or metazoa. The completeness of the assembly was checked against the Core Eukaryotic Genes database (http://korflab.ucdavis.edu/Datasets/genome_completeness/ and http://korflab.ucdavis.edu/datasets/cegma/). In silico translation was performed with TransDecoder50 whereas Functional Annotation was performed with Blast2GO software51. Transcript expression quantification was performed using Express (v 1.5.1)52 after mapping the reads against the assembly with STAR53. Posterior counts were used as input to perform transcript differential expression analysis with EBSeq.54, and differentially expressed transcripts with |LogFC| > 2 and FDR ≤ 0.01 were considered significant.
Selection and characterization of Putative Reference Genes (RGs) and Genes of Interest (GOIs) and Primer Design
The selection of putative reference genes (RGs) was carried out between a series of genes previously used as reference for other microalgae39,41,42. The selected genes were: Actin (Act), Glyceraldehyde 3-Phosphate Dehydrogenase (GAPDH), Translation elongation factor-like protein (EFL), Calmodulin (CaM), α-tubulin (Tub-α) and β-tubulin (Tub-β). Their primary function in the cell is reported in Supplementary Table 2. Regarding genes of interest (GOIs), transcripts coding enzymes involved in the metabolism of anti-inflammatory compounds were selected. Transdecoder software (https://github.com/TransDecoder/TransDecoder/wiki) was used to translate into protein sequences the entire C. closterium collection of transcripts. InterProScan (version 5.33) software55 was used to scan the entire collection of protein sequences of C. closterium (activating the “iprlookup” parameter) against the InterPro database56, a reference collection for protein domains and functional information. We selected the Reactome database57 to associate metabolic pathways information to DEGs. We also used Kyoto Encyclopedia of Genes and Genomes (KEGG) pathway database during the selection of the genes of interests to look for pathways of interest, such as the Inositol Phosphate Metabolism Pathway since inositol derivatives are known as anti-inflammatory agents31 (https://www.genome.jp/kegg/pathway.html). The chosen GOIs were: Phosphatidylinositol-3-Phosphatase (PtdIns(3)), Phosphatidylinositol 3-kinase catalytic subunit type 3 (PIK3C3), Phosphatidylinositol N-acetylglucosaminyltransferase subunit A (PIGA), Monogalactosyldiacylglycerol synthase (MGD) and Violaxanthin De-Epoxidase (VDE) (as reported in Supplementary Table 2). Protein structures of the selected GOIs were predicted through the Phyre2 web server58 (http://www.sbg.bio.ic.ac.uk/phyre2/html/page.cgi?id=index). In order to perform RNA-seq validation by RT-qPCR, other GOIs, chosen between the most up- or down-regulated differentially expressed genes (DEGs) with functional annotation, were selected: Adenylate and Guanylate cyclase catalytic domain-containing protein (AG), 3′5′-cyclic nucleotide phosphodiesterase (PDEase), Transposon Protein (TE), Nitrate Transporter (NRT), Vacuolar Iron Family Transporter (VIT), rRNA pseudouridylate synthase (Rsu) and ATP-Binding Cassette Protein Transporter (ABC). Their primary function in the cell is reported in Supplementary Table 2. Primers were designed using the software Primer3 version 4.1.0 (http://primer3.ut.ee/). In order to evaluate the cross-comparison of assays and assure equal PCR efficiencies, the size of amplicons was kept in the range of 150 to 250 base pairs, GC content at 50%, the length of primers between 19 and 21 nucleotides, and melting temperature from 59 °C to 61 °C. Primers were synthesized by Sigma-Aldrich. PCR conditions were optimized on a GeneAmp PCR System 9700 (Perkin Elmer) as in Lauritano et al.59. Supplementary Table 3 illustrates primer sequences for all the selected genes as well as their amplicon sizes, oligo efficiencies (E) and correlation factors (R2).
cDNA synthesis and Reverse Transcription-Quantitative Polymerase Chain Reaction (RT-qPCR)
RNA samples (1 μg/each) were retrotranscribed into complementary DNA (cDNA) by using the iScriptTM cDNA Synthesis Kit (BIORAD, Hercules, CA) following the manufacturer’s instructions, in the GeneAmp PCR System 9700 (Perkin Elmer). The obtained cDNA (1:10 dilution) was used as template for RT-qPCR experiments performed in a Viia7 real-time PCR system (Applied Biosystems). PCR volume of each sample was 10 μl with 5 μl of Fast Start SYBR Green Master Mix (Roche), 0.7 pmol/ μl for each oligo and 1 μl of cDNA template. Experiments were performed as in Lauritano et al.38. Best reference genes were identified using three different algorithms, i.e. BestKeeper60, geNorm61 and NormFinder62. To study expression levels for each gene of interest relative to the most stable RGs, we used the REST tool (Relative Expression Software Tool)63. Statistical analysis was performed using GraphPad Prim Statistic Software, V4.00 (GraphPad Software; http://www.graphpad.com/quickcalcs/).
Chemical Extraction, Pre-Fractionation and Anti-inflammatory testing
Chemical extraction was performed as in Lauritano et al.10 by using Amberlite XAD16N resin (20–60 mesh, Sigma-Aldrich). The final extracts were freeze-dried and stored at −20 °C until screening. Before performing the assays, extracts were first diluted at 1 mg/mL with MilliQ water and 2.5% DMSO. A triplicate of control plus the same concentration of DMSO used in test wells was used in all assays. The anti-inflammatory assay was performed as in Lind et al. (2013). Briefly, ~106 human monocyte THP-1 cells/mL (ATCC(R) TIB-202TM) supplemented with 50 ng/mL phorbol 12-myristate 13-acetate (PMA, SigmaAldrich) were seeded in 96 well plates and incubated at 37 °C, 5% CO2 for 48 h in RPMI-1640 medium (Biochrom;10%FBS). After 72 h, 80 μL fresh RPMI medium and 10 μL/well (tested concentration 100 μg/mL) of test extract were added. The test was performed in triplicate. After incubation for 1 h, all samples were incubated with 1 ng/mL lipopolysaccharide (LPS; final concentration) for another 6 h at 37 °C. Enzyme-linked immunosorbent Assay (ELISA) was used to test TNFα secretion as in Lauritano et al.10.
Data availability
Data are available and sequences are deposited in the NCBI Sequence Read Archive (SRA) database.
References
Hargraves, P. E. Identifying Marine Phytoplankton. Eos, Transactions American Geophysical Union 79, 99–99 (1998).
Romano, G. et al. Marine microorganisms as a promising and sustainable source of bioactive molecules. Marine Environmental Research 128, 58–69 (2017).
Lauritano, C. & Ianora, A. Grand Challenges in Marine Biotechnology: Overview of Recent EU-Funded Projects. in Grand Challenges in Marine Biotechnology (eds. Rampelotto, P. H. & Trincone, A.) 425–449, https://doi.org/10.1007/978-3-319-69075-9_11.(Springer International Publishing, 2018).
Lauritano, C., Ferrante, M. I. & Rogato, A. Marine Natural Products from Microalgae: An -Omics Overview. Marine Drugs 17, 269 (2019).
Jaspars, M. et al. The marine biodiscovery pipeline and ocean medicines of tomorrow. Journal of the Marine Biological Association of the United Kingdom 96, 151–158 (2016).
Vingiani, G. M., De Luca, P., Ianora, A., Dobson, A. D. W. & Lauritano, C. Microalgal Enzymes with Biotechnological Applications. Marine Drugs 17, 459 (2019).
Ingebrigtsen, R. A., Hansen, E., Andersen, J. H. & Eilertsen, H. C. Light and temperature effects on bioactivity in diatoms. Journal of Applied Phycology 28, 939–950 (2016).
Lauritano, C. & Ianora, A. Marine Organisms with Anti-Diabetes Properties. Marine Drugs 14, 220 (2016).
Martínez Andrade, K., Lauritano, C., Romano, G. & Ianora, A. Marine Microalgae with Anti-Cancer Properties. Marine Drugs 16, 165 (2018).
Lauritano, C. et al. Bioactivity Screening of Microalgae for Antioxidant, Anti-Inflammatory, Anticancer, Anti-Diabetes, and Antibacterial Activities. Front. Mar. Sci. 3 (2016).
Lauritano, C. et al. First identification of marine diatoms with anti-tuberculosis activity. Sci. Rep. 8, 2284 (2018).
Brillatz, T. et al. Zebrafish-based identification of the antiseizure nucleoside inosine from the marine diatom Skeletonema marinoi. PLoS ONE 13, e0196195 (2018).
Riccio, G. & Lauritano, C. Microalgae with Immunomodulatory Activities. Mar. Drugs 18 (2020).
Montero-Lobato, Z. et al. Chemically-Induced Production of Anti-Inflammatory Molecules in Microalgae. Marine Drugs 16, 478 (2018).
Gong, M. & Bassi, A. Carotenoids from microalgae: A review of recent developments. Biotechnology Advances 34, 1396–1412 (2016).
Khozin-Goldberg, I., Iskandarov, U. & Cohen, Z. LC-PUFA from photosynthetic microalgae: occurrence, biosynthesis, and prospects in biotechnology. Applied Microbiology and Biotechnology 91, 905 (2011).
Uttaro, A. D. Biosynthesis of polyunsaturated fatty acids in lower eukaryotes. IUBMB Life 58, 563–571 (2006).
Samarakoon, K. W. et al. In vitro studies of anti-inflammatory and anticancer activities of organic solvent extracts from cultured marine microalgae. 9 (2013).
Newton, K. & Dixit, V. M. Signaling in Innate Immunity and Inflammation. Cold Spring Harb Perspect Biol 4, a006049 (2012).
Brzezinski, M., Olson, R. & Chisholm, S. Silicon availability and cell-cycle progression in marine diatoms. Mar. Ecol. Prog. Ser. 67, 83–96 (1990).
Roessler, P. G. Effects of silicon deficiency on lipid composition and metabolism in the diatom cyclotella cryptica1. Journal of Phycology 24, 394–400 (1988).
Shifrin, N. S. & Chisholm, S. W. Phytoplankton lipids: interspecific differences and effects of nitrate, silicate and light-dark cycles1. Journal of Phycology 17, 374–384 (1981).
Traller, J. C. & Hildebrand, M. High throughput imaging to the diatom Cyclotella cryptica demonstrates substantial cell-to-cell variability in the rate and extent of triacylglycerol accumulation. Algal Research 2, 244–252 (2013).
Di Dato, V. et al. Animal-like prostaglandins in marine microalgae. The Isme Journal 11, 1722 (2017).
Di Dato, V. et al. Unveiling the presence of biosynthetic pathways for bioactive compounds in the Thalassiosira rotula transcriptome. Scientific Reports 9, 9893 (2019).
Jana, M., Jana, A., Liu, X., Ghosh, S. & Pahan, K. Involvement of Phosphatidylinositol 3-Kinase-Mediated Up-Regulation of IκBα in Anti-Inflammatory Effect of Gemfibrozil in Microglia. J. Immunol. 179, 4142 (2007).
Lenti, M. et al. Monogalactosyldiacylglycerol anti-inflammatory activity on adult articular cartilage. Natural Product Research 23, 754–762 (2009).
Scher, J. U. & Pillinger, M. H. The Anti-Inflammatory Effects of Prostaglandins. J. Investig. Med. 57, 703 (2009).
Soontornchaiboon, W., Soo Joo, S. & Kim, S. M. Anti-inflammatory Effects of Violaxanthin Isolated from Microalga Chlorella ellipsoidea in RAW 264.7 Macrophages. Biological & pharmaceutical bulletin 35, 1137–44 (2012).
van Dieren, J. M. et al. Anti-inflammatory actions of phosphatidylinositol. European Journal of Immunology 41, 1047–1057 (2011).
Wu, J. et al. Anti-inflammatory Inositol Derivatives from the Whole Plant of Inula cappa. J. Nat. Prod. 78, 2332–2338 (2015).
Hemantkumar, J. N. & Rahimbhai, M. I. Microalgae and Its Use in Nutraceuticals and Food Supplements. Microalgae - From Physiology to Application, https://doi.org/10.5772/intechopen.90143 (2019).
Hawkins, P. T. & Stephens, L. R. PI3K signalling in inflammation. Biochimica et Biophysica Acta 16 (1851).
Ulivi, V. et al. Anti-inflammatory activity of monogalactosyldiacylglycerol in human articular cartilage in vitro: Activation of an anti-inflammatory cyclooxygenase-2 (COX-2) pathway. Arthritis research & therapy 13, R92 (2011).
Junpeng, J., Xupeng, C., Miao, Y. & Song, X. Monogalactosyldiacylglycerols with High PUFA Content From Microalgae for Value-Added Products. Appl. Biochem. Biotechnol., https://doi.org/10.1007/s12010-019-03159-y (2019).
Kaulmann, A. & Bohn, T. Carotenoids, inflammation, and oxidative stress–implications of cellular signaling pathways and relation to chronic disease prevention. Nutr. Res. 34, 907–929 (2014).
Kawata, A., Murakami, Y., Suzuki, S. & Fujisawa, S. Anti-inflammatory Activity of β-Carotene, Lycopene and Tri-n-butylborane, a Scavenger of Reactive Oxygen Species. In Vivo 32, 255–264 (2018).
Lauritano, C. et al. De novo transcriptome of the cosmopolitan dinoflagellate Amphidinium carterae to identify enzymes with biotechnological potential. Sci. Rep. 7, 11701 (2017).
Orefice, I., Lauritano, C., Procaccini, G., Ianora, A. & Romano, G. Insights into possible cell-death markers in the diatom Skeletonema marinoi in response to senescence and silica starvation. Marine Genomics 24, 81–88 (2015).
Lauritano, C., Orefice, I., Procaccini, G., Romano, G. & Ianora, A. Key genes as stress indicators in the ubiquitous diatom Skeletonema marinoi. BMC Genomics 16, 411 (2015).
Lauritano, C. et al. New molecular insights on the response of the green alga Tetraselmis suecica to nitrogen starvation. Sci. Rep. 9, 3336 (2019).
Adelfi, M. G. et al. Selection and validation of reference genes for qPCR analysis in the pennate diatoms Pseudo-nitzschia multistriata and P. arenysensis. Journal of Experimental Marine Biology and Ecology 451, 74–81 (2014).
Sapriel, G. et al. Genome-Wide Transcriptome Analyses of Silicon Metabolism in Phaeodactylum tricornutum Reveal the Multilevel Regulation of Silicic Acid Transporters. PLOS ONE 4, e7458 (2009).
Mock, T. et al. Whole-genome expression profiling of the marine diatom Thalassiosira pseudonana identifies genes involved in silicon bioprocesses. Proc. Natl. Acad. Sci. USA 105, 1579 (2008).
Shrestha, R. P. et al. Whole transcriptome analysis of the silicon response of the diatom Thalassiosira pseudonana. BMC Genomics 13, 499 (2012).
Hook, S. E. et al. RNA-Seq analysis of the toxicant-induced transcriptome of the marine diatom, Ceratoneis closterium. Marine Genomics 16, 45–53 (2014).
Guillard, R. R. L. Culture of Phytoplankton for Feeding Marine Invertebrates. in Culture of Marine Invertebrate Animals: Proceedings — 1st Conference on Culture of Marine Invertebrate Animals Greenport (eds. Smith, W. L. & Chanley, M. H.) 29–60, https://doi.org/10.1007/978-1-4615-8714-9_3 (Springer US, 1975).
Grabherr, M. G. et al. Full-length transcriptome assembly from RNA-Seq data without a reference genome. Nature Biotechnology 29, 644 (2011).
Li, W. & Godzik, A. Cd-Hit: a Fast Program for Clustering and Comparing Large Sets of Protein or Nucleotide Sequences. Bioinformatics (Oxford, England) 22, 1658–9 (2006).
Haas, B. J. et al. De novo transcript sequence reconstruction from RNA-seq using the Trinity platform for reference generation and analysis. Nature Protocols 8, 1494 (2013).
Conesa, A. et al. Blast2GO: a universal tool for annotation, visualization and analysis in functional genomics research. Bioinformatics 21, 3674–3676 (2005).
Roberts, A. & Pachter, L. Streaming fragment assignment for real-time analysis of sequencing experiments. Nature Methods 10, 71 (2012).
Dobin, A. et al. STAR: ultrafast universal RNA-seq aligner. Bioinformatics 29, 15–21 (2012).
Leng, N. et al. EBSeq: An empirical Bayes hierarchical model for inference in RNA-seq experiments. Bioinformatics (Oxford, England) 29 (2013).
Jones, P. et al. InterProScan 5: genome-scale protein function classification. Bioinformatics 30, 1236–1240 (2014).
Mitchell, A. et al. The InterPro protein families database: The classification resource after 15 years. Nucleic acids research 43 (2014).
Fabregat, A. et al. The Reactome Pathway Knowledgebase. Nucleic Acids Research 46, D649–D655 (2017).
Kelley, L. A., Mezulis, S., Yates, C. M., Wass, M. N. & Sternberg, M. J. E. The Phyre2 web portal for protein modeling, prediction and analysis. Nature Protocols 10, 845 (2015).
Lauritano, C. et al. First molecular evidence of diatom effects in the copepod Calanus helgolandicus. Journal of Experimental Marine Biology and Ecology 404, 79–86 (2011).
Pfaffl, M. W., Tichopad, A., Prgomet, C. & Neuvians, T. P. Determination of stable housekeeping genes, differentially regulated target genes and sample integrity: BestKeeper-Excel-based tool using pair-wise correlations. Biotechnology Letters 26, 509–515 (2004).
Vandesompele, J. et al. Accurate normalization of real-time quantitative RT-PCR data by geometric averaging of multiple internal control genes. Genome. Biol. 3, 1–11 (2002).
Andersen, C. L., Jensen, J. L. & Ørntoft, T. F. Normalization of Real-Time Quantitative Reverse Transcription-PCR Data: A Model-Based Variance Estimation Approach to Identify Genes Suited for Normalization, Applied to Bladder and Colon Cancer Data Sets. Cancer Res. 64, 5245–5250 (2004).
Pfaffl, M. W., Horgan, G. W. & Dempfle, L. Relative expression software tool (REST©) for group-wise comparison and statistical analysis of relative expression results in real-time PCR. Nucleic Acids Research 30, 10 (2002).
Acknowledgements
We thank Massimo Perna and Mariano Amoroso for their technical support and Flora Palumbo for graphics. We also thank the BIOINforMA group of the Stazione Zoologica Anton Dohrn for technical support. Part of the project was carried out during the master dissertation of Ali Murat Elagoz for the International Master in Marine Biological Resources (IMBRSea) program (www.imbrsea.eu). This research was funded by the “Antitumor Drugs and Vaccines from the Sea (ADViSE)” project (PG/2018/0494374).
Author information
Authors and Affiliations
Contributions
C.L. conceived and designed the experiments. A.M.E., L.A. and C.L. performed the experiments. A.M.E., L.A. and C.L. analyzed the data. A.M.E., L.A. and C.L. co-wrote the paper.
Corresponding author
Ethics declarations
Competing interests
The authors declare no competing interests.
Additional information
Publisher’s note Springer Nature remains neutral with regard to jurisdictional claims in published maps and institutional affiliations.
Supplementary information
Rights and permissions
Open Access This article is licensed under a Creative Commons Attribution 4.0 International License, which permits use, sharing, adaptation, distribution and reproduction in any medium or format, as long as you give appropriate credit to the original author(s) and the source, provide a link to the Creative Commons license, and indicate if changes were made. The images or other third party material in this article are included in the article’s Creative Commons license, unless indicated otherwise in a credit line to the material. If material is not included in the article’s Creative Commons license and your intended use is not permitted by statutory regulation or exceeds the permitted use, you will need to obtain permission directly from the copyright holder. To view a copy of this license, visit http://creativecommons.org/licenses/by/4.0/.
About this article

Cite this article
Elagoz, A.M., Ambrosino, L. & Lauritano, C. De novo transcriptome of the diatom Cylindrotheca closterium identifies genes involved in the metabolism of anti-inflammatory compounds. Sci Rep 10, 4138 (2020). https://doi.org/10.1038/s41598-020-61007-0
Received:
Accepted:
Published:
DOI: https://doi.org/10.1038/s41598-020-61007-0
This article is cited by
-
Bioprospecting of microalgae metabolites against cytokine storm syndrome during COVID-19
Molecular Biology Reports (2022)
-
Lipid mediators in marine diatoms
Aquatic Ecology (2022)
Comments
By submitting a comment you agree to abide by our Terms and Community Guidelines. If you find something abusive or that does not comply with our terms or guidelines please flag it as inappropriate.
