
Abstract
Avian influenza (AI) affects wild aquatic birds and poses hazards to human health, food security, and wildlife conservation globally. Accordingly, there is a recognized need for new methods and tools to help quantify the dynamic interaction between wild bird hosts and commercial poultry. Using satellite-marked waterfowl, we applied Bayesian joint hierarchical modeling to concurrently model species distributions, residency times, migration timing, and disease occurrence probability under an integrated animal movement and disease distribution modeling framework. Our results indicate that migratory waterfowl are positively related to AI occurrence over North America such that as waterfowl occurrence probability or residence time increase at a given location, so too does the chance of a commercial poultry AI outbreak. Analyses also suggest that AI occurrence probability is greatest during our observed waterfowl northward migration, and less during the southward migration. Methodologically, we found that when modeling disparate facets of disease systems at the wildlife-agriculture interface, it is essential that multiscale spatial patterns be addressed to avoid mistakenly inferring a disease process or disease-environment relationship from a pattern evaluated at the improper spatial scale. The study offers important insights into migratory waterfowl ecology and AI disease dynamics that aid in better preparing for future outbreaks.
Introduction
Avian influenza is a global concern and poses hazards to human health, food security, and wildlife conservation worldwide1,2. Domestic poultry operations are particularly vulnerable to avian influenza viruses maintained in wild bird hosts3,4,5,6 as the viruses may be spread to poultry7,8,9,10 via direct contact or by way of environmental contamination. Once introduced into a poultry operation, avian influenza viruses of the H5 and H7 hemagglutinin subtype can rapidly propagate through commercial flocks and mutate to the Highly Pathogenic Avian Influenza (HPAI) pathotype with increased virulence1,11,12. HPAI outbreaks can inflict direct stock mortality or necessitate that culling protocols be implemented to minimize the risk of disease spread. In rare instances, control efforts may also reduce the spread of viruses potentially lethal to humans, as was shown for Goose Guangdong (GsGD) lineage HPAI H5N1 and H7N9 in China13,14.
Avian influenza viruses circulate among wild aquatic birds globally and taxa such as migratory waterfowl are considered to be natural biologic reservoirs15. Waterfowl are infected with varying virus subtypes, including those with the H5 and H7 hemagglutinin protein that have the potential to mutate to HPAI in poultry throughout the Neotropics and Nearctic16,17,18,19.
During 2014 and 2015, it appears migratory waterfowl contributed to the introduction of GsGD lineage HPAI H5 viruses into North America20,21,22 and subsequent spread in Canada and the U.S.23,24,25,26. This outbreak was the largest in U.S. history, affected wild and domestic birds in 21 U.S. States, resulted in the loss of approximately 50 million poultry, and caused estimated losses of more than 3 billion US dollars27,28.
To assess the potential role of migratory waterfowl in transporting HPAI viruses throughout central and eastern Asia, several studies have examined the spatial and temporal overlap of waterfowl movement trajectories or utilization distributions with disease occurrence locations, poultry facilities, and key waterfowl habitats3,29,30,31,32,33, however, there are a lack of comparable waterfowl movement studies investigating associations with avian influenza outbreaks in the Western Hemisphere. Indeed, there is a recognized need for new methods and tools to help quantify the dynamic interaction between wild bird hosts and commercial poultry in North America34,35,36. To help address this knowledge gap, we developed a combined animal movement and disease distribution model to evaluate the spatiotemporal relationship of migratory waterfowl to H5 and H7 subtype avian influenza detections in commercial poultry (AIPs) within North America.
For this study, we define AIPs as being any documented outbreak or infection caused by H5 or H7 subtype avian influenza in commercial poultry. Our central objective was to leverage multi-year animal movement telemetry and poultry disease data to characterize intra-annual patterns within a complex disease system. To accomplish this task, we used satellite-marked blue-winged teal (Anas discors) as a representative sample of the larger North American dabbling duck population and applied Bayesian joint hierarchical modeling to concurrently model species distributions, residency times, migration timing, and AIP occurrence probability. Blue-winged teal were chosen as a representative waterfowl species due to their widespread distribution and suspected role in redistributing avian influenza viruses throughout breeding grounds in the U.S. Northern Great Plains and Canada and overwintering habitats in Mexico17, the Caribbean37, and Central and northern South America16,18,38. Because migratory behavior and habitat preferences can differ between duck species39, the selection of blue-winged teal as an archetypal dabbling duck species necessitates that several important caveats be considered. As examples, blue-winged teal have a tendency to start the spring migration later, undertake the fall migration earlier, and fly greater distances than other dabbling ducks40,41. These caveats are examined in the context of results’ interpretation in the closing discussion.
Essential to our proposed method was taking steps to ensure that spatial correlation between satellite-marked birds and AIP locations did not bias model results and that the inclusion of locally-abundant (clustered) AIP records did not inflate model estimates or predictions. AIP records that are aggregated in time or space may signify non-typical increases in disease incidence that offer special insight into the system’s ecology. Recognizing that disease clusters can be difficult to interpret and statistically problematic, we took steps to avoid mistakenly inferring a disease process or disease-environment relationship from a pattern evaluated at the improper spatial scale42,43. In the case of poultry AIPs, localized clusters may be borne of epidemiological mechanisms operating at a much finer spatial scale than those patterns arising from long-range viral dispersion by migratory birds44. For instance, failures in biosecurity may result in the unintentional transmission of viral pathogens among farms via contaminated farm equipment long after initial introduction by a wild bird26,28,45. To better differentiate between possible farm-to-farm transmission and novel wild bird introduction, our model was designed to accommodate multi-scaled spatial processes.
Materials and Methods
Animal protocols statement
The authors confirm that all methods were carried out in accordance with relevant guidelines and regulations and that all experimental protocols were approved by the appropriate institutions and licensing committees. Protocols for capturing, handling, and instrumenting blue-winged teal included in this study were reviewed by institutional animal care and use committees (USGS Alaska Science Center Animal Care and Use Committee Animal Use permit no. 2014–5 and the University Committee on Animal Care and Supply University of Saskatchewan Animal Use protocol no. 20070039) and carried out under federal authority (US Department of the Interior Federal Bird Banding permit nos. 09072 and 23792, Federal Fish and Wildlife permit no. MB779238-2, Environment Canada Migratory Bird Banding permit no. 10458R).
Study domain and bird telemetry
Our study area encompassed North America between 14.5° and 60.0° North Latitude and −137.5° and −66.2° West Longitude. This area includes the conterminous United States, Mexico, Cuba, the Bahamas, and major portions of Canada. Forty-two adult, male blue-winged teal were captured and marked. Twelve birds were captured on their summer range in the Saskatchewan and Alberta Canadian Provinces during August 11–15, 2013, with the remaining thirty birds captured at wintering areas along the Texas and Louisiana Gulf Coast in the United States during March 17–22, 2015. All birds were marked with 9.5 gram, solar-powered Platform Transmitter Terminals (PTTs) manufactured by Microwave Telemetry, Inc., Columbia, Maryland (USA) and then released in close proximity to their respective capture locations. The PTTs were attached using a Teflon harness secured over the sternum to have a dorsally extended antenna as outlined by Takekawa et al.46. The PTTs were programmed to have a regular duty cycle with a 10 hour on period every 48 hours. We used the Argos Data Collection and Location System (CLS America, Incorporated, Largo, Maryland, USA) to receive transmissions, which provided Doppler-based location estimates, a movement activity indicator, and a class index reporting the quality of each location estimate. To prepare telemetry for statistical modeling, we first applied a filtering algorithm47 and then manually inspected movements and activity sensor records to exclude dates following likely bird mortality or PTT detachment. Locations exhibiting an unchanged activity indicator over two or more duty cycles were removed from the telemetry dataset. Table 1 details the bird-specific number of locations retained for analysis following data cleaning. Animations depicting the wild bird’s used in this study and downloadable telemetry data are available from the U.S. Geological Survey, Alaska Science Center, Wildlife Tracking Data Collection (https://doi.org/10.5066/P9Z9BA9F)48.
Environmental data
To characterize habitat and environmental conditions over the study area, we utilized 250 meter resolution gridded soils data49, the Global Topographic 30 Arc-Second Digital Elevation Model available from the U.S. Geological Survey (USGS) Earth Resources Observation and Science Center (https://www.usgs.gov/centers/eros), the 300 meter 2009 GlobCover Land Cover Maps provided by the European Space Agency (http://due.esrin.esa.int/page_globcover.php), and 30 meter resolution topographic roughness and topographic wetness indices provided by the ENVIREM dataset50. Because our goal with incorporating environmental variables was to characterize waterfowl habitat broadly and not to infer species-specific preferences or tolerances, we decomposed gridded soils data (17 different soil attributes) and elevation derived variables (topographical roughness, topographical wetness, elevation, and slope) using separate Principal Components Analyses and selected the resulting first component from each to represent soil and topographical conditions respectively. The correlation of the retained first component to other attributes included during decomposition are provided for soils in Table 2 and topography in Table 3. In addition to simplifying our analysis, the decomposition of variables also aided in avoiding multicollinearity issues during the model fitting process51. Recognizing the critical importance of wetlands and surface waters to waterfowl, we also calculated the Euclidean distance (km) of each telemetry location to the nearest surface water class in the GlobCover land cover dataset using the Program R52 and the spatstat package53. As detailed in subsection 2.6, we modeled distance to water as a non-linear covariate to avoid treating water presence as a bird occurrence prerequisite.
Poultry and human density data
For estimates of poultry abundance, we used the chicken and duck raster layers from the Food and Agriculture Organization of the United Nations (FAO) Gridded Livestock database54. The rasters were provided at a 0.083333 decimal degree resolution and report the number of poultry head per square kilometer (head/km2). Human population density estimates were obtained as a continuous raster (30 meter) from NASA’s Socioeconomic Data Center that gave the number of persons per square kilometer (persons/km2)55. The distribution of poultry abundance relative to our study domain is shown in Fig. 1 with telemetry tracks overlaid for marked birds.

Track Map. Telemetry tracks for 42 blue-winged teal over grid depicting poultry abundance54. Black lines show individual bird tracks, legend describes estimated number of poultry (chickens and ducks) per km2. To better display poultry abundance in this figure, zero was defined as less than 100 poultry/km2.
Avian influenza event in poultry data
AIP data were obtained from the web-based Global Animal Disease Information System (EMPRES-i) maintained by the FAO (http://empres-i.fao.org/eipws3g/, accessed 12/01/19). EMPRES-i is intended to support veterinary services and related organizations by providing access and analysis of global animal disease information. We initially downloaded all AIP data for the period between January 01, 2004 and December 01, 2019 and then filtered records to include only those with an FAO “Confirmed” status, geographically located within our study domain, affecting commercial poultry, and associated with virus subtypes having a H5 or H7 hemagglutinin surface protein. The H5 and H7 subtypes were chosen due to our interest in the HPAI pathotype, however, both HPAI (n = 440) and LPAI (n = 49) events were included in the resulting 489 record dataset. A secondary consideration in limiting the study to the H5 and H7 subtypes was that these subtypes are required to be reported to the World Organization for Animal Health (OIE) giving us some confidence in our sample. This is not the case with other virus subtypes, which are reported voluntarily and may therefore introduce sample bias. As a final step in preparing AIP data, we randomly selected 97 AIPs (approximately 20%) as a hold-out dataset to aid in later model validation. Locations of all events are shown by virus subtype in Fig. 2.

Locations of Avian Influenza Events (AIP) by virus subtype. AIP cover the period 2004–2019 and included 440 events used for model training and 49 (20%) randomly selected for model validation. Locations shown in the color red signify those retained for validation.
Statistical analysis
We constructed a two-level, spatially explicit model with shared components to evaluate the spatial and temporal relationship of waterfowl to AIPs across North America. The model’s first level estimated waterfowl residence time across the study area, whereas, the model’s second level provided the probability of an AIP as conditioned on that waterfowl residence time. More generally, our model can be represented as:
where the first level [Eq. 1] estimates waterfowl residence time (y1) at locations i \((i=1,2,3,\ldots ,n)\) and the second level [Eq. 2] gives AIP probability (y2) based on the past event (H5 or H7 AI detection) occurrence or absence (1, 0) at location i and conditioned on waterfowl residence time (\({y}_{1}\)). This formulation offers independent intercepts for each model level (\({\alpha }_{j}\)), covariate matrices (\(\beta \cdot {X}_{j}\)) for level-specific linear and fixed effects, and uncorrelated error terms (\({e}_{j}\)). Although independent spatial fields (\({Z}_{1}\) and \({Z}_{2}\)) help account for spatial dependencies within each model level, we added a third spatial field (\({Z}_{shared}\)) to explicitly serve as a shared scaling parameter between model levels56,57. The shared field is a re-scaled copy of \({Z}_{1}\) that controls for spatial autocorrelation and interaction occurring between waterfowl telemetry and AIP locations. As an initial step in specifying the spatial fields, we created a triangulated mesh over our study area using procedures described by Lindgren and Rue58. In addition to facilitating parameterization of the continuous spatial fields needed to account for spatial dependencies, the mesh provided a computationally efficient alternative to characterizing our continent-sized study domain using raster grids or areal polygons. The mesh included 9,555 nodes and had an outer extension large enough to avoid edge effects around study area boundaries. Due to our large study area, the mesh was projected using three-dimensional Cartesian coordinates scaled to one Earth radius (6,371 km). As a component of sensitivity analyses, meshes constructed with 4,897 nodes and 12,651 nodes were also evaluated and found to exhibit a mean spatial effect within 10% of that estimated using 9,555 nodes; therefore, we selected the middle-ground to balance precision and processing time.
To accommodate the joint modeling approach, our dependent variable was structured as a bivariate matrix with the first column corresponding to residence times calculated from telemetry data and the second column being a vector of 1’s and 0’s designating a past AIP occurrence (1) or absence (0) at each location. Because bird and AIP locations did not always geographically coincide, our model incorporated spatial misalignments; however, this was not problematic as the model is capable of providing estimates across continuous space and for all locations within the study domain56. To acquire initial residence time estimates for model fitting, we disaggregated individual bird telemetry tracks (Fig. 1) into 1 minute temporal intervals and then summed them based on mesh node proximity (i.e., “natural neighborhoods”). To achieve this, we performed a Voronoi tessellation around mesh nodes to identify each node’s respective area of influence56. Area of influence refers to the bounded area surrounding each node in which all enclosed locations share that node as their closest point59. The process used to disaggregate tracks into equal time intervals was adapted from Sumner60, but, modified to allow for summation of time intervals based on our tessellated neighborhoods as opposed to a regular grid. Each column of the bivariate matrix exhibited a different distribution, therefore, we specified model likelihoods as,
where, residence time was always a positive value with shape and scale parameters (\({a}_{i},{b}_{i}\)) such that \({a}_{i}/{b}_{i}={\mu }_{i}=E({v}_{i})\cdot Exposure\). Defining Exposure as the area of each node’s tessellated neighborhood, the residence-time linear predictor \({v}_{i}\) was of the form,
here, a log link function was used with \({\alpha }_{1}\) as the intercept, \({\beta }_{1}\) the soil variable coefficient, \({\beta }_{2}\) the topography coefficient, \({\beta }_{3}\) the coefficient for linear distance to nearest wetland, and \({Z}_{1}\) as the spatial field to control for spatial dependencies and other unobserved latencies (errors) that may have resulted from the aggregating process undertaken to estimate residence time.
The corresponding linear predictor for the binomially distributed AIP occurrence vector relied on the logit function and was specified as,
where \({\alpha }_{2}\) is an intercept, \({\beta }_{1}\) is the coefficient for poultry density and \({\beta }_{2}\) is the human population density coefficient. As described for Eq. 2, \({Z}_{2}\) provides a spatial field to account for domain-wide spatial dependencies and latencies among AIP locations, whereas, \({Z}_{shared}\) controls for the spatial relationship between AIP and waterfowl locations. To supplement poultry and human population density variables, we developed two additional model covariates; one to account for fine-scale spatial structure among AIP locations \(({f}_{1}\,{\rm{Cluster}})\) and the second to examine the temporal relationship between seasonal waterfowl migration and the timing of AIPs \(({f}_{2}\,{\rm{Displacement}})\).
As shown by Fig. 2, the geographic distribution of AIPs across North America exhibits broad regional coverage (e.g., the Midwestern U.S.) as well as more localized or concentrated “clustering“ at some locations (e.g., Jalisco, Mexico or Minnesota, USA). We speculate that the epidemiological processes that gave rise to the fine-scaled, cluster patterns were likely different than those that instigated the broad-scale, region-wide coverage. More specifically, it is possible that farm-to-farm transmission or “lateral spread” produced the observed clusters, whereas, the broader coverage may be better explained by waterfowl introduction (see, Discussion for further explanation). We chose to address these different multi-scaled spatial processes using two separate spatial covariates. The spatial field (\({Z}_{2}\)) was used as a domain-wide spatial covariate, while fine-scale spatial structure associated with AIP clusters was modeled using a random walk process across AIP nearest neighbor distances (km). As used here, a random walk \(({f}_{1}\,{\rm{Cluster}})\) is similar to a regression spline in that it permits distances between AIPs to follow a smooth, curvilinear distribution without assuming a mean response. The benefit of using the fine-scale spatial effect is that it quantifies the spatial variability due to proximity between AIP locations, thereby, reducing the model’s capacity to attribute that variation to waterfowl or other covariates.
As with clustering, a random walk was also implemented to quantify the temporal relationship between seasonal waterfowl migration and the timing of AIPs. As shown in Fig. 3, summing raw AIP counts (all years, 2004–2019) by week reveals an apparent correlative relationship of AIP timing to the mean weekly latitudinal displacement exhibited by waterfowl. To capture the timing of waterfowl movement as a model covariate, we calculated latitudinal displacement by finding the weekly mean latitude occupied by marked birds (all years, 2013–2016) and then performing a one-week lag subtraction between weeks. The function \({f}_{2}\,{\rm{Displacement}}\) introduces the resulting time-ordered vector as a non-parametric, dynamic effect that captures waterfowl latitudinal change at each weekly time step t \((t=1,2,3,\ldots ,52)\).
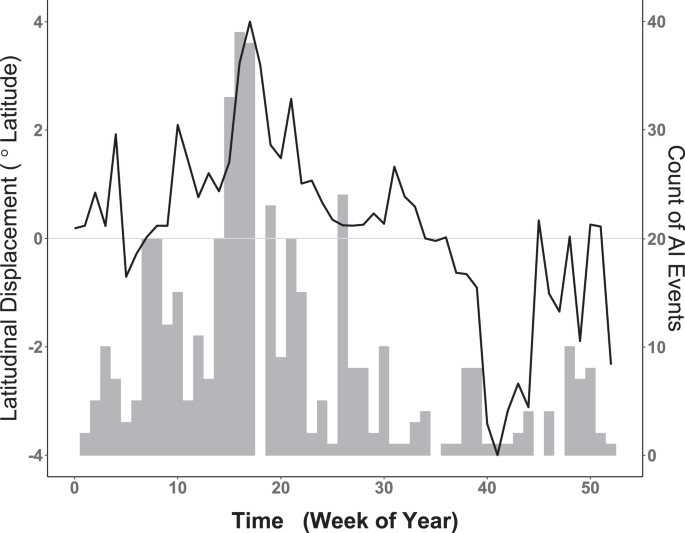
Weekly comparison of historic AI Events (AIPs) with waterfowl latitudinal displacement. Left vertical axis corresponds to smooth black line and represents weekly latitudinal displacement of waterfowl measured in degrees latitude. Horizontal axis provides the week of year. Dotted line intersecting zero signifies no net waterfowl displacement, with portions above zero indicating relative northward movement and portions below showing net southward change. Vertical axis at right corresponds to gray histogram for the weekly counts of all AIP summed over the period 2004–2019. Note apparent temporal correlation between waterfowl spring migration (Weeks 5–18) and increasing AIP as well as that between fall migration (weeks 35–42) and decreased AIP counts.
We used a Penalized Complexity (PC) framework61,62 for the three spatial fields \(({Z}_{j})\) with priors scaled to one Earth radius to reflect the size and projection of our 3D triangulated mesh. Because all spatial fields occurred over a common mesh and spatial domain, PC priors were set with both the spatial range and standard deviation quantile and probability: \({\rho }_{0}=1\) and \({p}_{\rho }=0.5\). The PC priors for the spatial effect were intended as non-informative and can be interpreted as specifying a 0.5 probability that the spatial range is within 6,371 km (i.e., one Earth radius). Sensitivity analyses for probability values between 0.2 and 0.8 in 0.1 increments assuming a \({\rho }_{0}=1\) revealed minimal change to model estimates. Flat PC priors were likewise applied for the random walk effects modeled as \({f}_{1}\,{\rm{Cluster}}\) and \({f}_{2}\,{\rm{Displacement}}\), which were specified as \(\mu =1\) and \(\alpha =0.0001\). We then combined priors and likelihoods using Integrated Laplace Approximation63.
In addition to performing joint estimation of waterfowl residence time and AIP occurrence probability as described above, we also explored an alternative model formulation to jointly estimate waterfowl occurrence probability with AIP occurrence probability. That is, rather than using residence time to inform AIP probability, the alternate formulation used mere waterfowl occurrence to estimate AIP probability as a way of comparing the relative importance of bird presence versus the amount of time spent at a location. Under the alternative model, we assumed that all locations with a residence time equal to, or exceeding 24 hours constituted an occurrence (1) with unobserved locations (0) used to characterize background environmental conditions. To correspond with the derived presence-background vector, we substituted a binomial likelihood for the gamma in Eq. 3, and exchanged a logit link function for the log. The alternative binomial-binomial configuration included all of the same spatial and environmental covariates as described for the Gamma-binomial.
Model evaluation
To evaluate model accuracy, we performed model-based estimation for each AIP location and event time in the independent testing dataset that was randomly selected and excluded from model development. We calculated the percent correctly classified (PCC), sensitivity (proportion of correctly predicted presences), specificity (proportion of correctly predicted absences), and the area under the receiver operating characteristic curve (AUC) using the Presence Absence R package64, and then estimated the True Skill Statistic (TSS) by subtracting a value of one from the sum of the sensitivity and specificity estimates65. We also used tools available in the Presence Absence package to determine the probability thresholds that best maximize sensitivity, specificity, and the TSS. Probability thresholds were determined by comparing the input data to model estimates to ascertain the probability value (threshold) that best captured known disease occurrences.
In addition to validating with an independent out-of-sample testing data set, we applied a comparative approach to assess the overall performance of our joint waterfowl residence time and AIP occurrence probability model. In total, seven different models were constructed and then compared to the full joint model detailed in subsection 2.6, one of which (Model6) was the alternative formulation described in the closing paragraph of subsection 2.6. Recognizing that application of parsimony metrics to spatial models can be problematic66,67, we chose three different parsimony measures; the deviance information criterion (DIC), the Watanabe-Akaike information criterion (WAIC), and the log-conditional predictive ordinate (lCPO). Generally, the DIC and WAIC are comparable, however, the DIC sometimes under-penalizes random effects67; thus, we opted to use both the DIC and WAIC as well as leave-one-out cross-validation (lCPO). Descriptions for all comparative models are provided with accompanying DIC, WAIC, and lCPO in the results section.
Results
Table 4 lists all models used to assess performance relative to the full model described in subsection 2.6. Note that in Table 4, the DIC, WAIC, and lCPO indicate improved parsimony as additional covariates were added, and that joint models combining waterfowl telemetry (Model5 and Model6) with AIP occurrences exhibited the best overall performance. As a visual comparison, Fig. 4(A) maps the smoothed random field densities produced by the base spatial model with no covariates (Model1) in comparison to a spatial model with all covariates, but, excluding waterfowl telemetry (Model4, Fig. 4(B)), and the joint models incorporating waterfowl residence time (Model5, Fig. 4(C)) and occurrence probability (Model6, Fig. 4(D)). Each of the sub-figures in Fig. 4 display a zero mean domain density and can be interpreted in a manner similar to mapped spatial residuals. The map’s warm colors (oranges and reds) indicate regions where actual values are greater than those estimated by the model and cool colors (blues) highlight regions where actual values fall below those estimated by model. Note that random field densities for both joint models are reduced relative to those resulting from Model1 and Model4, but, the joint models still underestimate AIPs over areas in the upper Midwestern and Northwestern U.S., as well as central Mexico. Residual error indicates that additional factors or variables are needed to fully explain the AIPs at these locations.

Random field density comparison. Spatial field resulting from the (A) base model (Model1), (B) base model with clustering effect and other covariates, (C) joint-model for residence time (Model5), and (D) joint-model for occurrence (Model6). Red areas highlight where models under predict AIP, cooler blue regions indicate where models over predict. Maps are plotted on the same scale using the same palette and can be interpreted as “mapped residuals”. Note that random field densities for models incorporating telemetry (C,D) are reduced relative to models without telemetry (A,B), but, even the telemetry models underestimate AIPs over several areas in the upper Midwestern and Northwestern U.S., as well as in central Mexico. Residual error indicates that additional factors or variables are needed to fully explain the AIPs at these locations.
Tables 5 and 6 summarize model covariates for the waterfowl residence time and occurrence probability models jointly fit with AIP occurrence probability. Observe that the soils covariate is important as judged by its credible intervals for both Model5 and Model6, whereas, the topography covariate is not. The soils and topography covariates likely correlate to waterfowl habitat preferences, but, this variation is better captured by soils than by topography. Soils and topography have been successfully used to model wetland occurrence probability in other studies68. The distance to water covariate is negative for both models suggesting that as distance from water increases, both waterfowl occurrence probability and waterfowl residence time decrease. Coefficients for poultry abundance are similar across models signifying an approximate 52.9% [(1/(1 + exp(0.12))) × 100%] increase in AIP occurrence probability for every additional 100,000 poultry head/km2 above the domain average while holding all other covariates constant. The \({f}_{1}\,{\rm{Cluster}}\) effect is plotted in Fig. 5 and indicates that the probability of an AIP occurrence increases non-linearly as proximity to a known AIP decreases below approximately 300 km. More simply, the closer a location is to a detection of H5 or H7 subtype influenza virus, the more likely it is to be subject to an AIP itself. The lower credible interval in Fig. 5 is inclusive of zero at distances greater than about 170 km, meaning that there is a low posterior probability of equal occurrence odds at longer distances. Figure 6 displays the functional relationship of AIP occurrence to time-structured waterfowl latitudinal displacement. The effect is important over most of the year and suggests that the greatest probability of an AIP occurs at approximately the 18th week of the year (late April - early May), a period largely coinciding with the peak of northward mean waterfowl latitudinal displacement (spring migration, see Fig. 3).

Model estimated clustering covariate. Non-linear, smooth line describes AIP probability as a function of proximity to other, adjacently located AIP occurrences. Vertical axis provides probability (logit scale) and the horizontal axis gives distance in kilometers. Dashed gray lines display 95% Credible Interval. Note that the credible interval includes zero at distances greater than approximately 170 km.

Model estimated temporal effect. Non-linear response of AIP probability as a function of time-structured bird latitudinal displacement. Vertical axis provides probability (logit scale) and the horizontal axis gives time in weeks. Dashed gray lines display 95% Credible Interval. Note that the credible interval includes zero between Weeks 20–35, a time period corresponding with the waterfowl breeding season.
Of particular interest in Tables 5 and 6 are the shared spatial fields (\({Z}_{shared}\)) that represent the relationship of waterfowl telemetry to AIP occurrence probability. The shared fields for both the waterfowl residence time and occurrence probability joint models are estimated to be positive, with 95% credible intervals that exclude zero. In the instance of Model6, the \({Z}_{shared}\) estimate is interpreted to indicate that if the probability of waterfowl occurrence at a location is 0.5, then the probability of an AIP is greater than 0.5 while controlling for all other model covariates. More precisely, at locations having a 0.5 waterfowl occurrence probability, the chance of an AIP is 53.2% [(1/(1 + exp(0.13))) × 100%] while controlling for all other covariates. As the occurrence probability of waterfowl increases above 0.5, the chance of an AIP likewise increases above 53.2%. In the case of Model5, the \({Z}_{shared}\) estimate translates to a 63.6% [(1/(1 + exp(0.56))) × 100%] chance of an AIP at locations exhibiting the domain-wide mean waterfowl residence time of 8.6 days while holding all else constant. A greater AIP likelihood is expected for locations with longer waterfowl residence time. Combining all covariates, AIP probability can be estimated for any week of the year and any location within our study area; Fig. 7 displays the relative chance of an AIP for North America for select weeks of the year.

Mapped AIP probabilities predicted by joint-model (Model5). Weeks 7, 15, 18, 23, 33, and 51 of the year are labeled as A through F respectively. Color coding and legend reflect relative probability (0.00–1.00) of H5 or H7 occurrence in North American Poultry with darker colors signifying increased likelihood. Note that C representing week 18 of the year (late April – early May) was predicted to exhibit the greatest AIP probability.
Model validation results are summarized in Table 7, which provides the PCC, Sensitivity, Specificity, AUC, and TSS for the hold-out data randomly partitioned during preliminary analysis. Statistics are provided for the three AIP presence thresholds determined to maximize Sensitivity, Specificity, and the TSS. To supplement Table 7, Table 8 further describes the validation dataset by providing the count of each virus subtype retained for evaluation as well as the average estimate and probability of cluster membership at each location.
Discussion
Considering forty-two marked blue-winged teal as representative natural host waterfowl, we applied advanced temporal modeling techniques to evaluate the location and timing of waterfowl movement and space-use (1) relative to avian influenza events (AIP) across North America between 2004 and 2019 and (2) confirmed as resulting from viruses having the H5 or H7 hemagglutinin surface protein. While our primary goal was to utilize multi-year animal movement telemetry and disease event data to characterize intra-annual patterns, we also emphasized methodological facets to guard against attributing avian influenza detections to waterfowl when they are better explained by mere spatial proximity or membership to the AIP clusters in our sample. To accomplish these goals, we developed a dynamic joint (waterfowl-AIP) temporal model with shared components. Our combined animal movement and disease distribution framework was sufficiently flexible to accommodate a large study domain and enabled us to account for cumulative error across what might typically be approached as individual or separate analyses.
Results indicate that the presence of migratory waterfowl is positively related to AIP occurrence within North America. As waterfowl occurrence probability or residence time increase at a given location, so too does the chance of an AIP. This conclusion is supported by estimates for the shared spatial fields (see, \({Z}_{shared}\), Tables 5 and 6), which were specifically implemented to account for spatial interaction between waterfowl and AIP locations. The 95% credible intervals for the shared fields included with both the waterfowl residence time (Model5) and occurrence probability (Model6) models indicate that waterfowl presence improves the model’s ability to estimate AIPs and that inclusion of movement telemetry increases parsimony (Table 4). Importantly, our inferred support for waterfowl improving AIP estimation is made after accounting for the week-specific, latitudinal displacement of migratory birds (Model3), poultry abundance (Model4), and AIP clustering (Model2). While our approach indicates that waterfowl presence and residence time were associated with North American AIPs during 2004–2019, we cannot conclude that any individual AIP was the direct result of wild bird to poultry viral spillover. Given that HPAI phenotypes are recognized as only evolving in domestic poultry, it is probable that associations between waterfowl presence and AIPs are a function of LPAI H5 and H7 spillover from wild birds to domestic poultry, or that the spatiotemporal associations resulted from other unidentified and unmeasured factors.
Regarding AIP clusters, we speculate that not all69 of the clustered AIPs visibly apparent (Fig. 2) over portions of Mexico (e.g., Jalisco) and the upper Midwestern U.S. (e.g., Minnesota) represent independent introductions of avian influenza by wild birds. Given the compact spatial arrangement of the events, relative incident timing (Fig. 3)70,71, and the commonality of virus subtypes at each location (e.g., H7N3 in Jalisco, H5N2 in Upper Midwest), we conjecture that AIP clusters likely stemmed from some combination of mechanical (i.e., shared farm equipment, staff movement between farms, etc.) and environmental (i.e., common water, soil, and air) transmission28,72. This interpretation is consistent with recent genetic analyses showing viral relatedness among H5N2 HPAI outbreaks in the Midwest26,69 and among H7N3 HPAI outbreaks in Mexico17. In the absence of extensive genetic sampling and lacking information detailing farm-specific operational practices, the current study is insufficient in itself to assess the tenability of a “farm-to-farm” or “lateral spread” disease cluster hypothesis directly, but, from a modeling context we propose Tobler’s Law73 as an accessible heuristic to account for the spatial patterns that sometimes arise from disease and epidemiological processes. The constructed covariate we designed to quantify fine-scale spatial structure is a statistical implementation of Tobler’s Law in that it assigns a cluster membership probability to all locations in the study area based on proximity to a neighboring AIP. To paraphrase Tobler from an epidemiological perspective, we assumed that “nearer outbreaks are more related than distant outbreaks”. If a detection is better explained by being in close proximity to another AIP than it is by waterfowl occurrence, then the risk of inferring an independent introduction by waterfowl is inherently reduced.
The timing of seasonal waterfowl migration was also found to be an AIP indicator. The time-structured covariate reflecting bird net latitudinal displacement was important as shown by 95% credible intervals (Fig. 6) and improved model parsimony (Model3, Table 4). Model results suggest that AIP occurrence probability is greatest during the months of April and May, a period coincident with peak blue-winged teal northward movement, and less during the months of September and October, which is the peak of observed southward movement. Stated differently, the chance of an AIP occurring in North America is greatest during the spring migration, less during the fall migration, and generally insignificant during the waterfowl breeding and overwintering seasons. More generally, the temporal relationship of waterfowl to past AIPs suggests that the chance of avian influenza being introduced into a U.S. poultry facility steadily increases between February and May and then rapidly decreases for the remainder of the year. Although increased hatchling abundances and bird aggregation at pre-migration staging areas through the late-breeding and fall seasons (August and September) are thought to contribute to a generally higher AI prevalence in dabbling ducks broadly, this spatiotemporal pattern may not be as consistent for blue-winged teal specifically. Having a reputation for early departure and long flight distances, vast numbers of blue-winged teal have already vacated pre-migration staging areas and arrived at migration stop-over sites or overwintering habitats by August and September40,74. Having experienced reduced rates of virus exposure prior to autumn migration, immunologically naïve blue-winged teal may help maintain AI at lower latitude locations throughout the non-breeding period and potentially redistribute virus during the spring migration40,41,75. As it relates to both the timing and degree of clustering shown in our AIP sample, it is important to note that models underestimate AIP probability over several areas in the upper Midwest and northwestern U.S., as well as in central Mexico (Fig. 4(C,D)). This indicates that additional factors or variables are needed to fully explain the epidemiological processes at these locations. Remaining error may be due to delayed surveillance or event reporting, environmental persistence, post-introduction redistribution by wild birds, farm-specific operational practices, species-specific virus relationships, or other unmodeled factors.
Geographically, several regions appear particularly vulnerable to an AIP. In the U.S., the states of Mississippi, Alabama, and Georgia in the Southeast exhibit elevated risk from February through April (Fig. 7). The Delmarva Peninsula on the East Coast shows an increased chance of a poultry influenza event during the second half of March through April as does the southern Great Lakes Region and central California on the West Coast. By comparison to the U.S., model estimates indicate relatively lower AIP probabilities for southern Canada and Mexico. Although Southwestern Ontario and the Montreal vicinity show increased risk at the height of waterfowl spring migration (Fig. 7(C)), AIP suitability in Canada falls below 15% for the remainder of the year. In Mexico, the highest AIP probability was estimated for the second-half of January and first part of February when conditions were approximately 30% suitable for an AIP along the western-most edge of the Mexican Plateau between Jalisco in the north and Puebla to the south. This estimated period of highest AIP probability in Mexico coincides with the timing of blue-winged teal staging for the spring migration.
Although validation evidenced overall good model performance (Tables 7 and 8), comparing model estimated AIP probabilities to the full disease occurrence dataset used as input (Fig. 2) suggests that the model’s ability to capture past AIPs varied by virus subtype. More specifically, waterfowl space use and migration timing show greater correspondence to past H7 AIPs than to those of H5 origin. The majority of H5 events (e.g., H5N2 and H5N8) incorporated into our analyses were sampled from the outbreaks in 2014–2015 that affected 21 States across the Northwestern and Midwestern U.S.27, but, as discussed with respect to possible farm-to-farm transmission above, estimated AIP occurrence across these regions is generally very low (Fig. 7) and considerable residual error remains (Fig. 4) at these locations. By comparison, AIP probabilities in the vicinity of past H7 events (e.g., H7N3 and H7N9) are considerably higher. This tendency may be a reflection of blue-winged teal being more commonly infected with H7 subtype viruses during spring as compared to H5 viruses18. In short, model results provide additional support that blue-winged teal were unlikely acting as a vector of HPAI during the 2014–2015 H5N2 and H5N8 outbreaks across the U.S.71; however, findings may add support to the notion that this species could introduce H7 subtype viruses to domestic poultry during the spring migration.
Our study could be improved in at least a couple regards. First, despite having intended our marked blue-winged teal as representative of the larger North American dabbling duck population, we acknowledge that migratory movement behavior may vary even within a species and that our study likely exhibits species-specific sample bias. As discussed above, the tendency for blue-winged teal to be early and long-distance flyers may have important implications for AI disease ecology and the representativeness of the species as an archetypal dabbling duck. We likewise recognize that bird-virus associations are often species-specific due to co-adaptation and variable physiological and immunological tolerances. Studies drawing on a larger sample size or incorporating different duck species under a comparative framework may be better suited to infer waterfowl-AIP relationships over such a heterogeneous study area. Studies aimed at investigating waterfowl-AIP dynamics by either choosing a wider range of focal bird species or being more selective in the virus subtypes examined would certainly be worthwhile. Secondly, the analysis of a large spatial domain may offer insight into long-distance animal movement and virus transmission potential, but, it also restricts data precision and availability. For example, the Gridded Livestock database that was used to estimate poultry abundance was essential to our study, but, had focused on a smaller geographic area in the U.S., we would have gained access to more recent and detailed information to characterize poultry locations and abundances.
In closing, we believe that the spatial and temporal relationship of blue-winged teal to past AIPs offers important insights into migratory waterfowl ecology and avian influenza disease dynamics that can aid in better preparing for future AIPs. Being able to anticipate the geographic locations and times most vulnerable to avian influenza outbreaks would be an asset to the domestic poultry industry and those oversight agencies responsible for disease surveillance and response. Additionally, we hope that the methodological approach presented in this study will motivate future research into modeling disparate facets of disease systems at the wildlife-agriculture interface.
Data availability
All analysis and modeling were performed using the open-source R language for statistical computing52 with freely-available data. Wild bird telemetry, environmental data, and avian influenza detections can be accessed using web addresses provided in the Materials and Methods Section.
References
Alexander, D. J. An overview of the epidemiology of avian influenza. Vaccine 25, 5637–5644, https://doi.org/10.1016/j.vaccine.2006.10.051 (2007).
Jones, K. E. et al. Global trends in emerging infectious diseases. Nature 451, 990–993, https://doi.org/10.1038/nature06536 (2008).
Prosser, D. J. et al. Wild bird migration across the Qinghai-Tibetan Plateau: A transmission route for highly pathogenic H5N1. PLoS One 6, https://doi.org/10.1371/journal.pone.0017622 (2011).
Prosser, D. J. et al. Mapping Avian Influenza Transmission Risk at the Interface of Domestic Poultry and Wild Birds. Front. Public Heal. 1, 1–11, https://doi.org/10.3389/fpubh.2013.00028 (2013).
Belkhiria, J., Hijmans, R. J., Boyce, W., Crossley, B. M. & Martínez-López, B. Identification of high risk areas for avian influenza outbreaks in California using disease distribution models. PLoS One 13, e0190824, https://doi.org/10.1371/journal.pone.0190824 (2018).
La Sala, L. F. et al. Spatial modelling for low pathogenicity avian influenza virus at the interface of wild birds and backyard poultry. Transboundary Emerg. Dis. 66, 1493–1505, https://doi.org/10.1111/tbed.13136 (2019).
Campitelli, L. et al. Interspecies transmission of an H7N3 influenza virus from wild birds to intensively reared domestic poultry in Italy. Virology 323, 24–36, https://doi.org/10.1016/j.virol.2004.02.015 (2004).
Li, L. et al. Genetic Evidence Supports Sporadic and Independent Introductions of Subtype H5 Low-Pathogenic Avian Influenza A Viruses from Wild Birds to Domestic Poultry in North America. J. Virol. 92, 1–16, https://doi.org/10.1128/jvi.00913-18 (2018).
Li, L., DeLiberto, T. J., Killian, M. L., Torchetti, M. K. & Wan, X. F. Evolutionary pathway for the 2017 emergence of a novel highly pathogenic avian influenza A(H7N9) virus among domestic poultry in Tennessee, United States. Virology 525, 32–39, https://doi.org/10.1016/j.virol.2018.09.003 (2018).
Yu, Z., Cheng, K. & Gao, Y. Poultry Infection with Influenza Viruses of Wild Bird Origin, China, 2016. Emerg. Infect. Dis. 24, 1375–1377, https://doi.org/10.1007/s13312-018-1234-3 (2018).
Kawaoka, Y., Nestorowicz, A., Alexander, D. J. & Webster, R. G. Molecular analyses of the hemagglutinin genes of H5 influenza viruses: origin of a virulent turkey strain. Virology 158, 218–227, https://doi.org/10.1016/0042-6822(87)90256-X (1987).
Munster, V. J. & Fouchier, R. A. Avian influenza virus: Of virus and bird ecology. Vaccine 27, 6340–6344, https://doi.org/10.1016/j.vaccine.2009.02.082 (2009).
Claas, E. C. et al. Human influenza A H5N1 virus related to a highly pathogenic avian influenza virus. The Lancet 351, 472–477, https://doi.org/10.1016/s0140-6736(97)11212-0 (1998).
Chen, Y. et al. Human infections with the emerging avian influenza A H7N9 virus from wet market poultry: Clinical analysis and characterisation of viral genome. The Lancet 381, 1916–1925, https://doi.org/10.1016/S0140-6736(13)60903-4 (2013).
Olsen, B. et al. Global patterns of influenza A virus in wild birds. Science 312, 384–388, https://doi.org/10.1126/science.1122438, arXiv:1011.1669v3 (2006).
González-Reiche, A. S. et al. Influenza a viruses from wild birds in Guatemala belong to the North American lineage. PLoS One 7, 1–11, https://doi.org/10.1371/journal.pone.0032873 (2012).
Lu, L., Lycett, S. J. & Brown, A. J. Determining the phylogenetic and phylogeographic origin of highly pathogenic avian influenza (H7N3) in Mexico. PLoS One 9, https://doi.org/10.1371/journal.pone.0107330 (2014).
Ramey, A. M. et al. Evidence for Seasonal Patterns in the Relative Abundance of Avian Influenza Virus Subtypes in Blue-Winged Teal (Anas discors). J. Wildl. Dis. 50, 916–922, https://doi.org/10.7589/2013-09-232 (2014).
Nallar, R. et al. Ecological Determinants of Avian Influenza Virus, West Nile Virus, and Avian Paramyxovirus Infection and Antibody Status in Blue-Winged Teal (Anas Discors) in the Canadian Prairies. J. Wildl. Dis. 52, 33–46 (2016).
Lee, D. et al. Intercontinental Spread of Asian-Origin H5N8 to North America through Beringia by Migratory Birds. J. Virol. 89, 6521–6524, https://doi.org/10.1128/JVI.00728-15 (2015).
Ip, H. et al. Novel Eurasian highly pathogenic avian influenza A H5 viruses in wild birds, Washington, USA. Emerg. Infect. Dis. 21, 886–890 (2014).
Ramey, A. M. et al. Evidence for common ancestry among viruses isolated from wild birds in beringia and highly pathogenic intercontinental reassortant H5N1 and H5N2 influenza a viruses. Infect. Genet. Evol. 40, 176–185, https://doi.org/10.1016/j.meegid.2016.02.035 (2016).
Lee, D. et al. Highly pathogenic avian influenza viruses and generation of novel reassortants, United States, 2014-2015. Emerg. Infect. Dis. 22, 1283–1285, https://doi.org/10.3201/eid2207.160048 (2016).
Bevins, S. N. et al. Widespread detection of highly pathogenic H5 influenza viruses in wild birds from the Pacific Flyway of the United States. Sci. Reports 6, 1–9, https://doi.org/10.1038/srep28980 (2016).
Ramey, A. M. et al. Surveillance for highly pathogenic influenza A viruses in California during 2014-2015 provides insights into viral evolutionary pathways and the spatiotemporal extent of viruses in the Pacific Americas Flyway. Emerg. Microbes Infect. 6, https://doi.org/10.1038/emi.2017.66 (2017).
Grear, D. A., Hall, J. S., Dusek, R. J. & Ip, H. S. Inferring epidemiologic dynamics from viral evolution: 2014–2015 Eurasian/North American highly pathogenic avian influenza viruses exceed transmission threshold, R0 = 1, in wild birds and poultry in North America. Evol. Appl. 11, 547–557, https://doi.org/10.1111/eva.12576 (2018).
Greene, J. L. Update on the highly pathogenic avian influenza outbreak of 2014–2015. Congr. Res. Serv. Rep. R44114 (2015).
Dargatz, D., Beam, A., Wainwright, S. & McCluskey, B. Case Series of Turkey Farms from the H5N2 Highly Pathogenic Avian Influenza Outbreak in the United States During 2015. Avian Dis. 60, 467–472, https://doi.org/10.1637/11350-121715-reg (2016).
Prosser, D. J. et al. Satellite-marked waterfowl reveal migratory connection between H5N1 outbreak areas in China and Mongolia. Ibis 151, 568–576, https://doi.org/10.1111/j.1474-919X.2009.00932.x (2009).
Takekawa, J. Y. et al. Migration of Waterfowl in the East Asian Flyway and Spatial Relationship to HPAI H5N1 Outbreaks. Avian Dis. Dig. 5, e101–e102, https://doi.org/10.1637/9187-891409-DIGEST.1, 15334406 (2010).
Yamaguchi, N., Hupp, J. W., Higuchi, H., Flint, P. L. & Pearce, J. M. Satellite-tracking of Northern Pintail Anas acuta during outbreaks of the H5N1 virus in Japan: implications for virus spread. Ibis 152, 262–271 (2010).
Takekawa, J. Y. et al. Movements of wild ruddy shelducks in the Central Asian flyway and their spatial relationship to outbreaks of highly pathogenic avian influenza H5N1. Viruses 5, 2129–2152, https://doi.org/10.3390/v5092129 (2013).
Sullivan, J. D. et al. Waterfowl Spring Migratory Behavior and Avian Influenza Transmission Risk in the Changing Landscape of the East Asian-Australasian Flyway. Front. Ecol. Evol. 6, 1–14, https://doi.org/10.3389/fevo.2018.00206 (2018).
Pepin, K. M. et al. Using quantitative disease dynamics as a tool for guiding response to avian influenza in poultry in the United States of America. Prev. Vet. Medicine 113, 376–397, https://doi.org/10.1016/j.prevetmed.2013.11.011 (2014).
Nallar, R. et al. Demographic and spatiotemporal patterns of avian influenza infection at the continental scale, and in relation to annual life cycle of a migratory host. PLoS One 10, 1–14 (2015).
Papp, Z. et al. The ecology of avian influenza viruses in wild dabbling ducks (Anas spp.) in Canada. PLoS One 12, 1–18, https://doi.org/10.1371/journal.pone.0176297 (2017).
Gonzalez-Reiche, A. S. & Perez, D. R. Where do avian influenza viruses meet in the americas? Avian Dis. 56, 1025–1033–9, https://doi.org/10.1637/10203-041412-Reg.1 (2012).
Spackman, E., McCracken, K. G., Winker, K. & Swayne, D. E. H7n3 avian influenza virus found in a south american wild duck is related to the chilean 2002 poultry outbreak, contains genes from equine and north american wild bird lineages, and is adapted to domestic turkeys. J. virology 80, 7760–7764, https://doi.org/10.1128/JVI.00445-06 (2006).
Humphreys, J. M., Murrow, J. L., Sullivan, J. D. & Prosser, D. J. Seasonal occurrence and abundance of dabbling ducks across the continental united states: Joint spatio-temporal modelling for the genus anas. Divers. Distributions 25, 1497–1508, https://doi.org/10.1111/ddi.12960 (2019).
Hanson, B. A. et al. Avian influenza viruses and paramyxoviruses in wintering and resident ducks in Texas. J. Wildl. Dis. 41, 624–628, https://doi.org/10.7589/0090-3558-41.3.624 (2005).
Stallknecht, D. E. & Brown, J. D. Wild birds and the epidemiology of avian influenza. J. Wildl. Dis. (2007).
Kulldorff, M. & Nagarwalla, N. Spatial Disease Clusters: Detection and INference. Stat. Medicine 14, 799–810 (1995).
Aamodt, G., Samuelsen, S. O. & Skrondal, A. A simulation study of three methods for detecting disease clusters. Int. J. Heal. Geogr. 5, 1–11, https://doi.org/10.1186/1476-072X-5-15 (2006).
Van Dijk, J. G. et al. Juveniles and migrants as drivers for seasonal epizootics of avian influenza virus. J. Animal Ecol. 83, 266–275, https://doi.org/10.1111/1365-2656.12131, NIHMS150003 (2014).
Alexander, D. J. A review of avian influenza in different bird species. Veterinary microbiology. Vet. Microbiol. 1, 3–13 (2000).
Takekawa, J. Y. et al. Migration of Waterfowl in the East Asian Flyway and Spatial Relationship to HPAI H5N1 Outbreaks. Avian Dis. 54, 466–476 (2010).
Douglas, D. C. et al. Moderating Argos location errors in animal tracking data. Methods Ecol. Evol. 3, 999–1007, https://doi.org/10.1111/j.2041-210X.2012.00245.x (2012).
Ramey, A. et al. Tracking data for Blue-winged Teal (Anas discors), U.S. Geological Survey data release, https://doi.org/10.5066/P9Z9BA9F (2019).
Hengl, T. et al. Soilgrids250m: Global gridded soil information based on machine learning. PLoS One 12, 1–40, https://doi.org/10.1371/journal.pone.0169748 (2017).
Title, P. O. & Bemmels, J. B. Envirem: an expanded set of bioclimatic and topographic variables increases flexibility and improves performance of ecological niche modeling. Ecography 291–307, https://doi.org/10.1111/ecog.02880 (2017).
Dormann, C. F. et al. Collinearity: A review of methods to deal with it and a simulation study evaluating their performance. Ecography 36, 027–046, https://doi.org/10.1111/j.1600-0587.2012.07348.x, NIHMS150003 (2013).
R Core Team. R: A Language and Environment for Statistical Computing. (R Foundation for Statistical Computing, Vienna, Austria, 2017).
Baddeley, A. & Turner, R. spatstat: An R Package for Analyzing Spatial Point Patterns. J. Stat. Softw. 12, 1–42 (2005).
Gilbert, M. et al. Global distribution data for cattle, buffaloes, horses, sheep, goats, pigs, chickens and ducks in 2010. Sci. Data 5, 1–11, https://doi.org/10.1038/sdata.2018.227 (2018).
CIESIN. Gridded Population of the World, Version 4 (GPWv4): Population Density Grid (2005).
Krainski, E. T. et al. Advanced Spatial Modeling with Stochastic Partial Differential Equations Using R and INLA. 1 edn. (Chapman and Hall/CRC, New York, 2018).
Blangiardo, M. & Cameletti, M. Spatial and Spatio-temporal Bayesian Models with R-INLA. (John Wiley & Sons, Inc., Chichester, UK, 2015).
Lindgren, F. & Rue, H. Bayesian Spatial Modelling with R-INLA. J. Stat. Softw. 63, 1–25 (2015).
Lawson, A. B. Bayesian point event modeling in spatial and environmental epidemiology. Stat. Methods Med. Res. 21, 509–529, https://doi.org/10.1177/0962280212446328, 1706.09079 (2012).
Sumner, M. D. trip: Tools for the Analysis of Animal Track Data, R package version 1.5.0 (2016).
Simpson, D., Illian, J., Lindgren, F., Sørbye, S. H. & Rue, H. Going off grid: Computationally efficient inference for log-Gaussian Cox processes. Biometrika 103, 49–70, https://doi.org/10.1093/biomet/asv064, arXiv:1111.0641v1 (2015).
Fuglstad, G.-A., Simpson, D., Lindgren, F. & Rue, H. Constructing priors that penalize the complexity of gaussian random fields. J. Am. Stat. Assoc. 0, 1–8, https://doi.org/10.1080/01621459.2017.1415907 (2018).
Rue, H., Martino, S. & Chopin, N. Approximate Bayesian inference for latent Gaussian models by using integrated nested Laplace approximations. J. Royal Stat. Soc. Ser. B: Stat. Methodol. 71, 319–392, https://doi.org/10.1111/j.1467-9868.2008.00700.x (2009).
Freeman, E. A. & Moisen, G. Presence Absence: An r package for presence absence analysis. J. Stat. Softw. 23, 1–31, Eafreeman@fs.fed.us (2008).
Allouche, O., Tsoar, A. & Kadmon, R. Assessing the accuracy of species distribution models: Prevalence, kappa and the true skill statistic (TSS). J. Appl. Ecol. 43, 1223–1232, https://doi.org/10.1111/j.1365-2664.2006.01214.x (2006).
Watanabe, S. A Widely Applicable Bayesian Information Criterion. Mach. Learn. Res. 14, 867–897, 1208.6338 (2013).
Gelman, A., Hwang, J. & Vehtari, A. Understanding predictive information criteria for Bayesian models. Stat. Comput. 24, 997–1016, https://doi.org/10.1007/s11222-013-9416-2 (2014).
Humphreys, J., Elsner, J., Jagger, T. & Mahjoor, A. Disaggregating the Patchwork: Probabilistic models as tools to predict wetland presence as a continuous gradient. Wetlands 37, 205–219, https://doi.org/10.1007/s13157-016-0859-z (2017).
Lee, D.-H. et al. Transmission Dynamics of Highly Pathogenic Avian Influenza. Emerg. Infect. Dis. 24, 1840–1848, https://doi.org/10.3201/eid2410.171891 (2018).
Jennelle, C. et al. Surveillance for highly pathogenic avian influenza virus in wild birds during outbreaks in domestic poultry, Minnesota, 2015. Emerging infectious diseases. Emerg. Infect. Dis. 22, 1278–1282 (2016).
Krauss, S. et al. The enigma of the apparent disappearance of Eurasian highly pathogenic H5 clade 2.3.4.4 influenza A viruses in North American waterfowl. Proc. Natl. Acad. Sci. 113, 9033–9038, https://doi.org/10.1073/pnas.1608853113 (2016).
Wells, S. J. et al. Epidemiologic Investigation of Highly Pathogenic H5N2 Avian Influenza Among Upper Midwest U.S. Turkey Farms, 2015. Avian Dis. 61, 198–204, https://doi.org/10.1637/11543-112816-reg.1 (2017).
Tobler, W. A computer movie simulating urban growth in the Detroit region. Econ. Geogr. 46, 234–240 (1970).
Stallknecht, D. E., Shane, S. M., Zwank, P. J., Senne, D. A. & Kearney, M. T. Avian influenza viruses from migratory and resident ducks of coastal louisiana. Avian Dis. 34, 398–405 (1990).
Ferro, P. J. et al. Multiyear surveillance for avian influenza virus in waterfowl from wintering grounds, Texas Coast, USA. Emerg. Infect. Dis. 16, 1224–1230, https://doi.org/10.3201/eid1608.091864 (2010).
Acknowledgements
We thank Steven M. Gray for assistance in reviewing the manuscript. We are also grateful to the many biologists and volunteers for their assistance with duck captures; including, W. Broussard, D. Carter, A. Fojtik, C. Kienzle-Dean, G. Newsome, P. Pauling, J. McLeod, K. Gesy, S. Mlala, G. Treen, and A. Wilson. This research was supported by the United States Geological Survey Ecosystems Mission Area, Environment and Climate Change Canada, Alberta Conservation Association, Institute for Wetland and Waterfowl Research - Ducks Unlimited Canada, and the University of Saskatchewan. Computing for this project was performed on the High Performance Computing Cluster at the Michigan State University Institute for Cyber-Enabled Research. The use of trade, firm, or product names is for descriptive purposes only and does not imply endorsement by the U.S. Government.
Author information
Authors and Affiliations
Contributions
D.P., A.R. and J.M. conceived the study concept; J.H. led and D.D., A.R. and D.P. contributed to design of the methodology and data analysis. A.R., C.S., P.L. and P.W. led wild bird capture and marking efforts. All authors contributed to writing the manuscript and gave final approval for publication.
Corresponding author
Ethics declarations
Competing interests
The authors declare no competing interests.
Additional information
Publisher’s note Springer Nature remains neutral with regard to jurisdictional claims in published maps and institutional affiliations.
Rights and permissions
Open Access This article is licensed under a Creative Commons Attribution 4.0 International License, which permits use, sharing, adaptation, distribution and reproduction in any medium or format, as long as you give appropriate credit to the original author(s) and the source, provide a link to the Creative Commons license, and indicate if changes were made. The images or other third party material in this article are included in the article’s Creative Commons license, unless indicated otherwise in a credit line to the material. If material is not included in the article’s Creative Commons license and your intended use is not permitted by statutory regulation or exceeds the permitted use, you will need to obtain permission directly from the copyright holder. To view a copy of this license, visit http://creativecommons.org/licenses/by/4.0/.
About this article

Cite this article
Humphreys, J.M., Ramey, A.M., Douglas, D.C. et al. Waterfowl occurrence and residence time as indicators of H5 and H7 avian influenza in North American Poultry. Sci Rep 10, 2592 (2020). https://doi.org/10.1038/s41598-020-59077-1
Received:
Accepted:
Published:
DOI: https://doi.org/10.1038/s41598-020-59077-1
This article is cited by
Comments
By submitting a comment you agree to abide by our Terms and Community Guidelines. If you find something abusive or that does not comply with our terms or guidelines please flag it as inappropriate.
