
Abstract
Native chickens are endangered genetic resources that are kept by farmers for different purposes. Native chickens distributed in a wide range of altitudes, have developed adaptive mechanisms to deal with hypoxia. For the first time, we report variants associated with high-altitude adaptation in Iranian native chickens by whole genome sequencing of lowland and highland chickens. We found that these adaptive variants are involved in DNA repair, organs development, immune response and histone binding. Amazingly, signature selection analysis demonstrated that differential variants are adaptive in response to hypoxia and are not due to other evolutionary pressures. Cellular component analysis of variants showed that mitochondrion is the most important organelle for hypoxia adaptation. A total of 50 variants was detected in mtDNA for highland and lowland chickens. High-altitude associated with variant discovery highlighted the importance of COX3, a gene involved in cell respiration, in hypoxia adaptation. The results of study suggest that MIR6644-2 is involved in hypoxia and high-altitude adaptations by regulation of embryo development. Finally, 3877 novel SNVs including the mtDNA ones, were submitted to EBI (PRJEB24944). Whole-genome sequencing and variant discovery of native chickens provided novel insights about adaptation mechanisms and highlights the importance of valuable genomic variants in chickens.
Introduction
Chickens (Gallus gallus domesticus) are, domestically, considered as widespread birds. Chickens have been domesticated in India and South-East of Asia1. They are used for different purposes including decoration, religions, cock fighting, and food production2. Village chickens are also considered as important sources of food in Iran. Therefore, farmers keep them and consequently, their morphology, behavior, physiology and adaptation to local environment conditions have been remarkably changed3.
Iran is a large country that contains a special range of altitudes and climates. Therefore, there is a remarkable genetic diversity of indigenous chickens in Iran4. However, there is no previous report on Iranian native chickens at the genomic level. The next generation sequencing (NGS) has become a tool to describe genomic features5. Investigating native chickens at the genomic level can clarify the genomic basis of their differences and the specific traits of indigenous chickens can also be precisely explored6.
Usually, hypoxia occurs in high-attitude and pathological conditions. Hypoxia refers to the lack of oxygen7, and the adaptation to hypoxia is a complex process contains biological pathways and gene networks8. Thereby, understanding genetic factors that underlie adaptation to high-altitude conditions could lead to a new source of knowledge in order to understand the adaptation process9.
There are studies carried out in order to identify the genetic factors for high-altitude adaptation of Tibetan chickens, Yak, Tibetan pigs and Tibetan people10. Results of these studies show that hypoxia is involved in cerebral edema, tumorigenesis, myocardial ischemia and diabetes in human being, and some genes including Endothelin 1 (EDN1), Erythropoietin (EPO) and Aldosterone synthase (CYP11B2) are reported as the key genes of hypoxia adaptation11,12,13,14.
Recent evidences indicate that highland chickens are adapted based on factors including the small body size, the ability to outstand foraging, high hatchability, large organs (liver, heart and lungs), and higher hemoglobin concentration. Furthermore, the positive selection of highland populations is related to the cardiovascular and respiratory system development, responses to the radiation, inflammation, DNA repair, and the immune responses15. Recently, one of the most significant discussions about high-altitude condition is known as the mitochondrion organelle, because there is a close association between the lack of oxygen and cell respiration. In a previous study, nine single nucleotide polymorphisms (SNP) of MT-COI (mitochondria-cytochrome c oxidase subunit I) gene were detected for the high-altitude adaptation, but none of them was a missense mutation16.
In the study herein, the whole genome sequencing of highland chickens (Isfahan, Altitude = 2087 m) and lowland chickens (Mazandaran, Altitude = 54 m) was carried out in order to discover genomic variants, associated with high-altitude adaptation.
Results
Quality control
Results of the quality control indicate that short reads were sequenced based on an appropriate form. Trimming was carried out according to the Phred score and the nucleotide contribution. Removing at least ten primary bases, we trimmed 3′ side of short reads in order to minimize mapping errors. In addition, 5% of reads that contained the lowest Phred scores were also removed.
Phenotypic data, phylogenetic and population structure analysis
Results of principle component analysis indicated that six components (combinations of traits) characterized 92 percent of the total variance; therefore, these components were selected in order to be utilized in the discriminate analysis (Table 1). Results of the discriminate analysis showed that collected lowland and highland samples can be classified into two separated groups, phenotypically. The accuracy was estimated to be 75% (Table 2).
Nei’s genetic distance between highland and lowland populations was estimated to be 3 percent. Thus, results of phylogenic analysis revealed that there was no significant genetic distance between highland and lowland populations.
The analysis of genetic population structure was carried out by multiple correspondence analysis (MCA) based on 10000 SNVs genotypes. The first two components of variants were 29.5% and 26.5%, respectively. Results indicated that highland chickens were classified closely; while lowland chickens were classified together. Consequently, highland and lowland chickens could be classified into two groups (Fig. 1).

Classification of the highland and lowland chickens according to the results of multiple corresponding analyses (H: highland and L: lowland). The information of 10000 SNVs genotypes were utilized in order to classify the highland and lowland chickens based on multiple corresponding analysis by R program and Ca package. Results show that highland and lowland chickens can be divided into two groups based on their geographical distribution.
Mapping, variants discovery and statistical analysis
The mapping efficiency versus reference genome was estimated between 94–97% for samples (Table 3). Parameters were optimized in order to decrease false variants for the variants discovery, (See Supplementary Table S1 for optimization process). The process of optimization was carried out in three steps, and parameters of the step 3 were selected in order to be utilized in the variants detection.
We found that more than 20 million variations were generated, including single nucleotide variant (SNV), multi nucleotide variant (MNV), insertion, deletion and replacement (See Supplementary Table S2). Results of the statistical analysis indicated that there was a significant (P < 0.001) difference of variant distribution between highland and lowland samples (Table 4). Thus, we can realize that harsh environmental conditions, including the lack of oxygen, impacted on the variant distribution. In addition, the Chi-square test was carried out for each chromosome, separately. Most of chromosomes had significant differences in harboring associated variants with altitude alteration; therefore, those chromosomes that do not have significant differences are given in Table 5, including mtDNA, W, 4, 11, and 32.
Differential variants of highland and lowland ecotypes
In order to remove the common variants between highland and lowland chickens, total variants of those samples were compared. Differential variants were also kept in order to be utilized in further analyses (Table S3). Finally, the frequency thresholds of 50% and 100% were determined in order to carry out comparisons between the groups of males and females (Table S4). The threshold frequency is considered as the percentage of samples that contain variants. Generally, 97610 and 17024 variants were detected for both males and females as the differential variants of highland and lowland chickens, respectively. For the first time, 16623 and 3024 variants were identified as new variants in males and females. Results of filtering in the male birds, based on the overlap, showed that 614 and 96995 variants were located in coding and non-coding regions. We found that 202 out of 614 coding variants will lead to amino acid changes. It was observed that fewer coding and non-coding variants were detected among female birds (Table 6).
Totally, more than 30 GO terms were reported for differential variants in females. Considering the molecular functions, the most frequency of GO terms belonged to 5′-3′ exodeoxyribonuclease activity and histone binding, respectively. Furthermore, candidate genes of GO terms were suggested including DCLRE1C and ATAD2. It was also found that considering cellular components, the mitochondrion was identified as the most important organelle for hypoxia condition differing between highland and lowland ecotypes.
Results of biological process analysis showed that most of the GO terms were related to the DNA repair processes including double-strand break repair and inter strand cross-link repair.
Results of gene ontology enrichment among males indicated that several candidate genes such as TATDN1, POLQ and DCLRE1A were associated with DNA repair. It was observed in the biological process analysis that there were several Go terms, including pericardium morphogenesis and thalamus development. There were also several biological pathways suggested for DNA repair and biosynthetic (e.g., DNA biosynthetic process; double-strand break repair; DNA repair; and inter strand cross-link repair). The NK T cell differentiation was reported as a biological pathway of immune response in the hypoxia condition. To see more results of gene ontology enrichments analyses in males and females, refer to the Tables 7 and 8.
Identification of potential selective sweeps between the highland and lowland Chickens
The process of signature selection analysis (SSA) is carried out in this study in order to identify those genomic regions that were under the selection pressure. The main goal of SSA was to demonstrate that differential variants are actually adaptive in response to hypoxia and are not due to other evolutionary pressures or mechanisms of genetic changes.
According to the extremely high FST (top 5%), it was found that 95 biological categories and 858 candidate genes were reported from different databases including gene ontology consortium (GO), human phenotype ontology (HP), Kyoto encyclopedia of genes and genomes (KEEG), miRbase (mi), transcription factor database (TF) and the genomic landscape of the population differentiation (FST) among highland and lowland chickens is shown in Fig. 2.

Genomic landscape of the population differentiation in highland and lowland chickens. In current study signature selection analysis was carried out for confirming the results of differential variant analysis. Therefore, for each population of highland and lowland chicken differentiation (FST) was calculated for each SNV as described by Weir and Cockerham (1984) and sex chromosomes were removed. The average FST values of SNVs in each window were calculated and genomic landscape of the population differentiation between highland and lowland chicken was drawn by qqman package and R program (version 3.2.2). Based on extremely high Fst (top 5%) 95 biological categories and 858 candidate genes are reported to identify genomic regions which are under selection pressure.
According to the results of SSA, it was found that several candidate genes were associated with the hypoxia condition. Several candidate genes including MRE11A, DDIAS, PRIM2, DNASE, and MMS22L were suggested as examples of the DNA response to UV radiation and DNA repair. More importantly, it should be noted that there were several biological categories enriched by SSA including immune response (TRAT1, BMX, CXCR4), protein hemostasis (PSMD13), and mitochondrion function (COX7A2, MTO1, ME3, MICU3, HCCS). Table 9 shows a summary of biological categories and candidate genes. Additionally, the results of SSA are completely provided in the Supplementary Dataset 11.
Common variants between highland and lowland chickens
Generally, in both males and females, 53780 variants were shared between highland and lowland chickens; 17835 new variants were also reported for the first time. It was found that 516 out of 53780 variants could lead to changes in amino acid sequences (Supplementary Table S5).
Results of gene ontology enrichment analysis of detected variants, in females and males, indicated that GO terms were related to the cell survival. For example, cell proliferation, cell growth (ROS1), digestion (PRSS3), chromosome organization (BRCA2), RNA processing (TDRD9), telomere capping (POT1), and cytokinesis (CEP55). In order to see more details of common variants, refer to the Supplementary text and Supplementary Tables S6–S7.
mtDNA variants
In general, for both highland and lowland chickens, 50 variants were detected in mtDNA (10 samples), and most of them were considered as the novel variants (Table 10). One significant gene ontology (GO term: 1902600) was observed in mtDNA variants. It was reported that, for highland chickens, hydrogen ion transmembrane transport was a biological pathway in males. It is involved in the directed movement of hydrogen ion (proton) across a membrane. Noticeably, COX3 gene (cytochrome c oxidase III) was considered in this biological pathway.
Validations of novel differential SNVs between highland and lowland ecotypes and mtDNA variants
Results of the validation indicated that 19 out of 32 novel variants were validated in mtDNA. Five variations of regions including 5928, 6758, 8070, 8330, 11378 had the most validating percentage of mtDNA (Table 11). Results of the validation of novel differential SNVs showed that 19 out of 3845 variants were validated in five new samples (Table 11).
The analysis of genomic variants enrichment for the differential variant between highland and lowland chickens
The chromosome that had the most standard frequency in females was known as the chromosome 27 (Fig. 3). In fact, 234 variants were recognized on chromosome 27; however, 100 variants (43% of variants) were located in the range of 2692–1 × 10⁶ base pairs (16% of the chromosome length) (Fig. 4a). Findings illustrated that 40 ENSGALT (Ensembl transcript) IDs were available in this region, and five Ensembl gene IDs were also detected by BioMart tools (Table 12). We found that MIR6644-2 gene contributed in the gastrulation. Gastrulation is recognized as one of the most important steps in animals’ embryonic development. Furthermore, the single layered blastula develops to a multilayered organization, called gastrula, during the gastrulation17.

Standard frequency of differential variants between highland and lowland chicken for the selection of chromosomes that have the highest standard frequency. Dividing variants numbers by the chromosome length (Mb), standard frequencies of differential variants were estimated for each chromosome, then chromosomes with high-density of variants were selected (marked with asterisk) in order to be utilized for further analysis. Chromosomes 30–33 are not available in the genome reference.

Cumulative frequency graph of variant numbers for chromosomes 27 (a) and 2 (b) in female and male chickens for genomic variant enrichment analysis. Chromosomes 2 and 27 (Fig. 2) were selected in order to draw the cumulative frequencies graph of variants along the chromosome. It is shown by Figure (a) that the most variants enrichments are available in the range of 2692–1 × 10⁶ base pairs (separated with horizontal line) of chromosome 27. A total of 234 variants was recognized on chromosome 27, and 100 (42.72%) variants were also located in the range of 2692–1 × 10⁶ region. Figure (b) indicates that 17891 variants were recognized on chromosome 2, but 7600 variants (43%) were located in the range of 41 × 106–81 × 106 (27% of chromosome length) base pairs. Finally, these regions with the highest density of variation were selected for the identification of candidate genes.
The most standard frequency of variants of chromosome 2 in males was estimated to be 119.60 (Fig. 3). A total of 17891 variants was detected on chromosome 2, but 7600 variants (43%) were located in the range of 41 × 106–81 × 106 (27% of chromosome length) base pairs; however, this region, which had a high density of variation, was selected for further analysis (Fig. 4b). It was shown by results of UCSC and the table browser analysis that 412 ENSGALT IDs were available for the selected region and consequently, nine Ensemble gene IDs were identified by BioMart tools (Table 12). We found that some functions were involved in the adaptation to hypoxia including chemotaxis, immune response, inflammatory response, and positive regulations of monocyte chemotaxis. Other results indicated that Jumonji protein might have an important role in the adaptation to hypoxia. Reviewing the studies, we found that Jumonji protein family would contribute in the wide range of chromatin regulation, genes expression, and signaling pathways18. While the Jumonji is known as the DNA binding and transcriptional repressor, this protein interacts with the Polycomb repressive complex 2 (PRC2) in humans, which plays a critical role in the regulation of gene expression during the embryonic development (www.ncbi.nlm.nih.gov/gene/3720). This study indicates that PRL gene can play a very important role in the condition of lack of oxygen. It has been illustrated that the PRL gene is associated with reproductive traits; specially egg production traits19. In fact, PRL gene is a multifunctional hormone that impacts on multiple physiological processes including cardiovascular system; however, they have been poorly described20.
The possible gene network of differential variants
Results of the analysis of gene network indicate that seven differential candidate genes contribute in the regulation of carcinogenesis. It is observed that most of the candidate genes induce carcinogenesis, especially BMX and LRP6 (Fig. 5). However, HSPA14 and DCLRE1A genes had an inhibition impact on the tumorigenesis. See the Supplementary Table S8 for more details about underlying references of relationships. Figure 6 shows the cellular location of candidate gene. For example, LRP6 is considered as the receptor; therefore, it is shown in the membrane cell. In addition, BMX and HSPA14 were activated in cytoplasm, but other candidate genes were in the nucleus. This information could be useful in order to explore the contribution of genes in biological pathways. For instance, DCLRE1A and PRKDC have a critical role in the process of DNA repair21. Therefore, their location can also be observed in nucleus. These results could be helpful in order to understand the process of diseases creation and select the appropriate drug design method, based on the cellular location of key proteins in carcinogenesis.

The network analysis for differential candidate gene in hypoxia condition for carcinogenesis. The high-dose UV radiation can lead to DNA damage and tumorigenesis in high-altitude condition; thus, gene networks analyses of key genes involved in the high-altitude adaptation could provide new information about carcinogenesis. A total of 27 candidate genes was identified for differential variants in males and females in this investigation (Tables 7 and 8). Chicken Ensembl gene identifications were converted into human orthologs in order to construct an informative network and finally, results showed that seven candidate genes were enriched in carcinogenesis network and had a regulatory role. Specifically, BMX and LRP6 induce the carcinogenesis and HSPA14, and DCLRE1A inhibits that.

The cellular location of the key proteins in the regulation of carcinogenesis. This figure shows the cellular location of the key proteins in three parts of the cell (Membrane, Nucleus and Cytoplasm). LRP6 is known as receptor, thus cellular location of this protein is shown in the membrane. Similarly, other proteins including DCLRE1A contribute in the DNA repair process. Consequently, it is illustrated in nucleus. These results can be useful for better understanding of the diseases creation process and the selection of appropriate drug design methods, based on cellular locations of key proteins in carcinogenesis.
The submission of novel variants to European Bioinformatics Information (EBI)
Many SNVs are detected as the novel variants in this investigation. Novel variants were submitted to EBI database with the accession number of PRJEB24944. See Table S9 for more details. Discovered variants can be utilized for future breeding programs. The analysis of data with hierarchical pattern recognition algorithms can be ranked, thus the best combination of variants distinguishing highland and lowland chickens will also be found22,23.
Discussion
Full genome sequencing of highland and lowland chicken ecotypes are utilized in this investigation in order to unravel molecular mechanisms of adaptation to the condition of lack of oxygen. Recently, researchers are more willing to study the mtDNA variation and ATP production in low oxygen conditions. According to our findings, hydrogen ion transmembrane transports in mitochondrial inner membrane, as a biological pathway involves in mitochondrial respiratory, and COX3 candidate gene (cytochrome c oxidase III or MT-CO3) was also detected for this biological pathway. It is the terminal enzyme of the respiratory chain of mitochondria, which is involved in the transfer of electrons from reduced cytochrome c to the molecular oxygen24. Results of this study corroborate the findings of Sun et al.25 who investigated the association between MT-CO3 (mitochondrially encoded cytochrome c oxidase subunit III) gene and high-altitude adaptation in Tibetan chickens. They demonstrated that eight SNPs were available (single nucleotide polymorphisms), and five of them were shared by Tibetan chickens and lowland chickens.
Results showed that highland chickens had more mtDNA variants than lowland chickens (32 versus 18 variants). It is a reasonable approach to consider that more variants in highland chickens were created in order to be adapted to high altitude conditions. Amazingly, there is a severe sex bias in mitochondrial nucleotide variation, as male highland chickens had more variants than female highland chicken (a ratio of almost 3:1). A possible explanation for this might be that female and male chickens are different in sexual traits such as, fertility, gaining and consequently, energy consumption. In this way, Camus et al.26 indicated that mtDNA variation can affect the regulation of healthy traits and contribute in sex-related differences. Furthermore, the interactions between mtDNA and nuclear DNA involved in sex-specific transcript responses27.
In addition, we have detected novel mtDNA variations for the first time. Thus, our findings provided new potential molecular genetics for the genetic adaptation to high-altitude conditions. Logically, further examinations will be required in order to describe the main role of novel variants in low oxygen conditions.
We found that there is a non-mitochondrial variant (chromosome 12), which is involved in the cell respiration. Mitochondrial respiratory complex chain III contributes in the ATP synthesis, electron transport, and metabolism. It is a complex protein located in the mitochondrial inner membrane28. Here, UQCRC1 gene was reported in order to encode ubiquinol cytochrome c reductase or cytochrome bc1 complex protein. This might be explained by the fact that the activity of cytochrome c oxidase will decrease in the low oxygen condition and will also lead to the less activity of bc1 compound. Logically, the generation of reduced ubiquinol will be decreased29. Figure 7 shows the protein structure of UQCRC1.

UQCRC1 gene encodes ubiquinol cytochrome c reductase or cytochrome bc1 complex protein. It is a complex protein which is located on the mitochondrial inner membrane and involves in the cell respiration. The variants locations are shown by the yellow circle in the whole structure. Purple and green atoms show the reference and variants structures, respectively.
Additionally, the proteasomes and protein translation tools are identified as interesting results of the cellular components analysis. There are evidence suggesting an association between hypoxic condition and protein hemostasis. Low oxygen condition affects the gene expression profiles in cell, in this way, transcription and translation process are changeable. Also, protein synthesis is one of the most energy-consuming process in cell related to normal oxygen concentration30,31. Thereby, cell reduces the messenger RNA (mRNA) rate to save energy metabolism while continuing the production of the proteins associated with survival factors32.
Gene ontology enrichment and genomic variants enrichment analysis, including immune response, histone banding, and organ development, also achieved the same results.
Direct evidences were found on the association between solar radiation and immune response about the hypoxia condition in this investigation. Thus, it was recognized that NK (natural killer) T cell differentiation was considered as the immune response. BMX gene contributes in the NK T cell differentiation. BMX gene encodes cytoplasmic tyrosine-protein kinase in human being33. It plays a critical role in the induced interleukin-6 (IL6), adaptation of different cell systems against stress, growth, and differentiation of hematopoietic cells34. Findings of this study are consistent with those of McNamee et al.35, which indicate that the differentiation of T cells could be stimulated by hypoxia and high altitude conditions. Also, Zhang et al.15 showed that there is an association between the high altitude condition and inflammation responses. Protein structures and the variant location of BMX are shown in Fig. 8. Similarly, results of the analysis of genomic variants enrichment indicated that chemokine receptors have a critical role in the immune response. Chemokines are defined as small protein molecules produced by cells of the immune system. They contribute in the migration of immune cells to an infection site. Furthermore, chemokine receptors are involved in monocyte infiltration of inflammatory responses against tumors (Uniprot: Q8QG57).

BMX gene encodes cytoplasmic tyrosine-protein kinase and contributes in the NK T cell differentiation. It plays a critical role in the induced interleukin-6 (IL6), adaptation of different cell systems against stress, growth, and differentiation of hematopoietic cell. Therefore, BMX gene was considered as the immune response in hypoxia conditions. The variants locations are shown by the yellow circle in the whole structure. Purple and green atoms also show the reference and variants structures, respectively.
Several studies indicated that epigenetic regulations in cells might be caused by the hypoxia36,37,38. Results of gene ontology showed that histone binding might be associated with the hypoxia condition. Furthermore, we suggested that ATAD2 gene can be considered for the histone binding process. ATAD2 gene belongs to the ATPase family and is involved in the chromatin binding and histone binding (UniProt: Q6PL18). This finding is in accordance with that of Zhang et al.15, which indicated that there was an association between histone binding and high altitude conditions. In addition, the analysis of genomic variants enrichment confirmed that Jumonji protein and JARID2 can contribute in the hypoxia adaptation process by chromatin bindings. It has been demonstrated that, JARID2 gene plays an essential role in embryonic and organ developments including heart development, and neural tube fusion (UniProt: Q92833).
Other interesting findings of the gene ontology enrichment analysis are considered as organ developments including brain development and pericardium morphogenesis. A strong relationship between high altitude condition and organs development has been reported by Zhang and Burggren39. For instance, highland chickens have smaller organs including heart, liver and lungs15. Our study presents evidences in order to prove that brain development has a critical role in the adaptation to high altitude conditions. It may be explained by the fact that brain is the most sensitive organ to the lack of oxygen, thus cerebral anoxia induces neuronal cell death and apoptosis and will also lead to hypoxic brain injury40. We found that there are gene ontology terms which impact on the brain development in highland chickens including mid brain development, cerebral cortex development, and thalamus development. It is recognized that pericardium morphogenesis was effective in high altitude conditions. Similarly, Patterson and Zhang41 demonstrated that normal heart formation and maturation in fetus depend on low oxygen stress, but further abnormal low oxygen condition has a negative influence on the structure, function, and gene expression in the fetal heart tissue. This is the evidence which is in accordance with our results. Therefore, LRP6 gene was considered as a candidate gene for organs development in high altitude conditions. LRP6 gene encodes low-density lipoprotein receptor-related protein 6 that has included co-receptor groups in the canonical Wnt pathway (Wnt/β-catenin pathway). It is considered as a very important regulator of tissue development and hemostasis42. Figure 9 shows the protein structure and variant location of LRP6.

LRP6 gene was considered as a candidate gene for organs development in high altitude conditions. LRP6 gene encodes low-density lipoprotein receptor-related protein 6 and is a key regulator of tissue development and hemostasis. The yellow circle in the whole structure shows variants locations. The reference and variants structures are also shown by purple and green atoms, respectively.
Other interesting GO terms contained in high-altitude adaptation pathways- including DNA repair, double strand break repair, DNA biosynthetic process and inter strand cross-link repair activity- can be found in this study. One possible explanation might be defined as: high-dose UV radiation can lead to DNA damage, cell apoptosis, skin cancer and tissue injury of mammals43,44 in high-altitude conditions. In this study, we reported DCLRE1C gene as a candidate gene for DNA repair process. In humans, DCLRE1C gene encodes a single-strand nuclear protein that has a specific 5′-3′ exonuclease activity. Interestingly, this protein has main functions in the regulation of the cell cycle in response to DNA damage21.
Amazingly, it should be noted that comparable results were obtained by SSA and differential variants analysis. The results of differential variants analysis indicated that adaptive variants were involved in processes of DNA repair, organs development, immune response, epigenetic regulation, mitochondrion function (cell respiration), and protein hemostasis. Interestingly, similar results were reported by SSA and it is also recognized that both analysis show the similar gene’s functions that contribute in response to hypoxia. For instance, cell respiration and mitochondrion function were considered as the most important results of differential variants analysis in low oxygen condition. Thus, UQCRC1 (mitochondrial respiratory chain complex III) was suggested as the candidate gene of cell respiration. Also, several candidate genes associated with cell respiration and mitochondrion function, including COX7A2, ME3 and HCC, were reported by SSA. According to the results of SSA, it is recognized that adaptive variants in differential variant analysis are due to the adaptation process. Table 13 shows a summary of the comparison of results of SSA and differential variants analysis.
Results of the analysis of genomic variants enrichment showed that miRNAs can be considered in the high-altitude adaptation. Clearly, miRNAs involve in the regulation of different pathways in various cell types; therefore, they can provide new evidence about hypoxia-related gene regulations45. Several studies showed that an association between hypoxia and hypoxia-inducible factor (HIF) transcription factor is available, and will lead to the expression of a different type of genes such as miRNAs46,47. It was recognized that MIR6644-2 was reported as the candidate gene in the high-altitude adaptation process by our genomic variants enrichment analysis. Despite there was no previous study about MIR6644-2 gene and high-altitude adaptation; however, this has been proved that it has a main role in the gastrulation48. This is recognized as one of the most interesting discussions about hypoxia and gastrulation, that chronic hypoxia alters the physiological and morphological pathways of developing animal embryos49,50.
In this study, we carried out the gene network analysis in order to identify that candidate genes were enriched in human diseases. Although the biological pathways in animals are not in a good accordance with human being, there are many treatment systems and drugs developed in animal models, especially chicken models for human genetic and disease51,52,53. We found that the gene network was associated with the carcinogenesis. This result may be explained by the fact that, UV radiation in highlands leads to the DNA damage. Similarly, there is an association between cancers and DNA damage. Interestingly, the network analysis indicated that DCLRE1C and PRKDC proteins can inhibit the tumorigenesis. It is because the DCLRE1C and PRKDC proteins involve in DNA repair process21. In addition, PRKDC protein has a critical role in the development of immune system by maturing B and T cells54. This finding supports the previous research which showed the DNA-PKcs-deficient (encoded by PRKDC gene) associated with immune deficient, radio sensitivity and tumor development in mice54,55. We found that PES1would induce tumorigenesis. It is a possible explanation that PES1 encodes pescadillo ribosomal biogenesis factor 1, which is a member of the PeBoW complex and has a main role in regulating the cell cycle. Therefore, the abnormal mitosis and carcinogenesis might be caused by the disruption of PeBoW complex. These findings further support the idea that PES1 may involve in the promotion of the malignant phenotypes of colon cancer cells and the gastric cancer56,57. Also, it was found that LRP6 would lead to the cancer disease. Cell receptors are considered as biomarkers in cancer researches58. There are several studies attempt to explain the role of LRP6 receptor in tumorigenesis including triple negative breast cancer and human hepatocellular carcinoma59,60,61,62,63. Considering the Wnt signaling pathway (Wnt/β-catenin pathway) and normal cell cycle regulation, LRP6 is a member of the LDL receptor family63. HSPA14 was also reported as another candidate gene in carcinogenesis, and HSPA14 is recognized as the heat shock protein family (member 14). Also, it is known as the HSP70-4 or HSP70L1. Previous studies indicated that HSPs involves in the wide range of tumor64,65,66,67. Similarly, Rerole.et.al.68 showed that HSP70 are expressed abnormally as well as it causes tumor growth and metastasis in rodents.
See the Supplementary text for more information about the discussion part.
Conclusions
This is a comparative genomic study of Iranian native chicken ecotypes in order to identify the genomic region associated with hypoxia and low oxygen condition. The detection of candidate genes in this study would provide new insights about hypoxia. These adaptive genes were related to important functions including DNA repair, organ development, immune response, and histone binding. The comparable results were obtained by signature selection and differential variant analysis, in this way we demonstrate that the differential variants are actually adaptive in response to hypoxia and are not due to other evolutionary pressures or mechanisms of genetic change.
We have also found that variations in mtDNA, including COX3 gene, play an important role in the process of adaptation. It was identified that several candidate genes were associated with carcinogenesis. This is the first investigation that sequences the whole genomes of highland and lowland native chickens; therefore, many novel variants are discovered and submitted to EBI (PRJEB24944). Moreover, MIR6644-2 gene is considered as a candidate gene which might impact on the adaptation process to hypoxia by the regulation of embryo development, and was not implicated in previous investigations of high-altitude adaptation among chickens.
Therefore, this paper can provide new information about the adaptation process. The signature of native chicken, which ecotypes to high altitude and low oxygen at the genomic level, is produced for better understanding about hypoxia adaptation mechanisms.
Materials and Methods
The summary of sampling and whole genome data analyses are depicted in Fig. 10.

The Summary of sampling and data analysis for whole-genome sequencing of native chicken ecotypes and variant discovery associated with high-altitude adaptation (the same colors of vectors show the similar analysis).
Ethical approval statements
This investigation is in accordance with relevant guidelines and regulations of Shiraz University. All experimental protocols were approved by Institute of Biotechnology at Shiraz University.
The whole procedure of blood sampling was approved by the Department of Animal Science at Shiraz University (Permit number: 93-192). No birds were slaughtered and harmed.
Blood sampling and DNA extractions
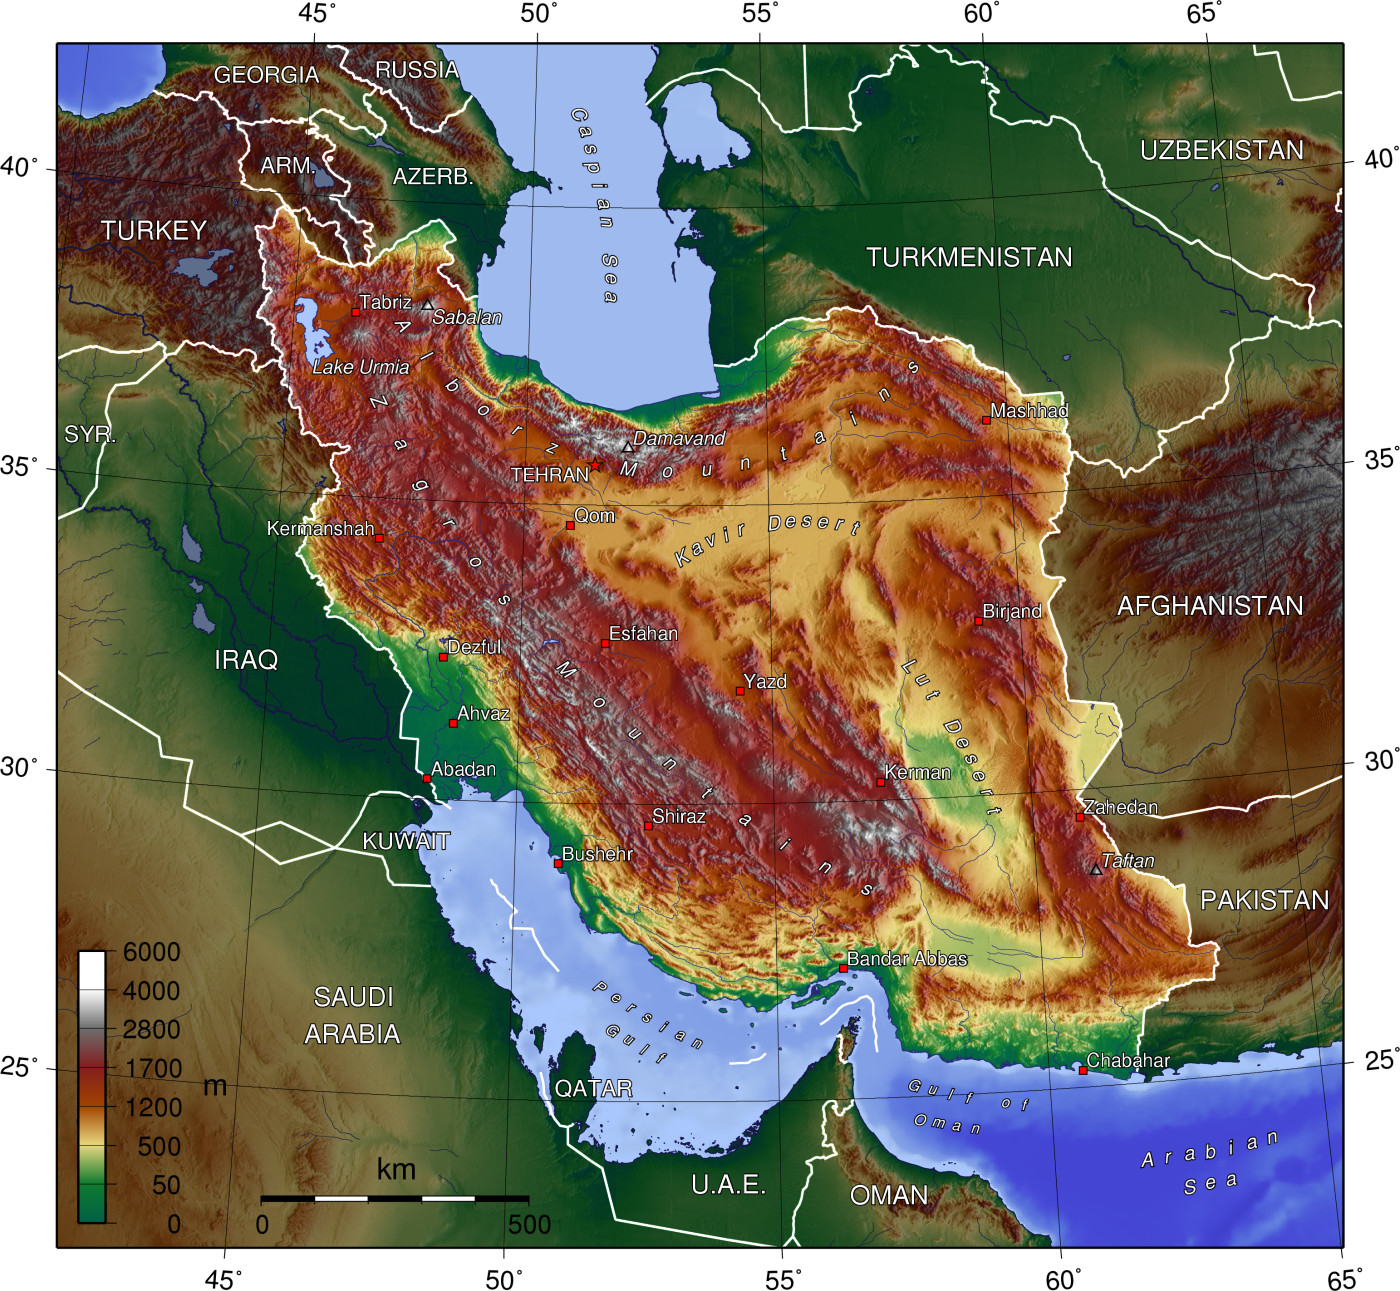
Blood samples were collected from Isfahan (highland, altitude = 2087 m) and Mazandaran (lowland, altitude = 54 m) provinces. Ten samples including three males and two females of the highland, and two males and three females of the lowland were collected. See Fig. 11 for more details about sampling locations. Two mL of blood was obtained from the birds’ wing vein. Using salting out protocol, the total DNA was isolated from the whole blood69. The process of testing DNA samples’ quality was carried out by the agarose gel (2%) and NanoDrop spectrophotometer, and high-quality DNA samples were also utilized for the subsequent whole genome resequencing.

Sampling locations of highland and lowland chickens in Isfahan and Mazandaran provinces, located at different altitudes in Iran. Ten blood samples, including three males and two females from highland and two males and three females from lowland, were collected in order to be utilized in the whole genome sequencing. This figure was downloaded from an open source website https://commons.wikimedia.org. The direct URL is https://upload.wikimedia.org/wikipedia/commons/9/99/Iran_topo_en.jpg. The link to the license is https://creativecommons.org/licenses/by-sa/4.0/deed.en. Outer areas from the original figure were cropped, therefore “Caspian Sea” was rewritten in the above of figure based on the information of original figure. In addition, the locations of sampling were added to the figure by yellow vectors.
Phenotypic data and statistical analysis
Classification of highland and lowland chickens, based on phenotypic traits, was the main purpose of the statistical analysis. Twenty-four quantitative traits were recorded for 16 chickens of highland and lowland. To reduce measurement error, all chickens were matured while recording. The same recording protocol was also used in order to measure phenotypic traits of all the birds. Traits included the body weight (gr), neck length, body size (between waist and pectoral circumference), shank length, body size (between waist and abdominal circumference), wing length, tail length, femur length, crown length, crown height, back cape length, body size (between pectoral and cloaca circumference), head height (height from head to floor), wings length (open wings), number of toes, number of spur (nail of the foot), beak length, head circumference with a crown and a double wattles, toes length (right, middle, left), wattle height, wattle width, pectoral width, femur diameter and shank diameter. Utilizing the principle component analysis and discriminate analysis in Minitab software, we analyzed these traits (version: 17)70.
Whole genome sequencing
The construction of genomic libraries was based on the Illumina standard genome library preparation pipeline. Using Hiseq. 2000 platform, whole genomes were sequenced and the length of provided paired-end short reads was also125 bp.
Quality control and trimming
The function of quality control in CLC Genomic Workbench (8.5.1)71 was used by the following parameters for each sample: length distribution, GC content, ambiguous base content, Phred score, nucleotide contribution, enrich 5 mers, and duplicate sequences72. The adaptor sequences were removed by Illumina Company; thereby, trimming was carried out based on other parameters.
Reference genome, mapping, locally realignments and coverage analysis
The reference genome and annotations were downloaded from the Ensembl database. Annotations included gene annotations and variants (ftp://ftp.ensembl.org/pub/relase-84/fasta/gallus_gallus). Mapping was carried out in CLC Genomics Workbench (8.5.1)71 based on the following parameters: masking mode = no masking, mismatch cost = 2, cost of insertions and deletions = linear gap cost, insertion cost = 3, deletion cost = 3, length fraction = 0.7, similarity fraction = 0.8, global alignment = no, Auto-detect paired distances = yes, and non-specific match handling = ignore. Finally, local realignment was used according to the following parameters: realign-unaligned ends = yes and multi-pass realignment = 273.
The analysis of coverage was also utilized in order to identify the frequency of a base’s coverage in the reference genome by the mapped read of a given sequencing74.
Here, the analyses of coverage were estimated for all highland and lowland samples before and after the trimming process. Also, Lander/Waterman equation was used for the calculation of the coverage75.
where, C stands for coverage, G is the haploid genome length (bp), L is the read length and N is the number of reads.
Variant calling and statistical analysis
The variant detections algorithm was used by CLC genomics workbench (8.5.1)71. First, parameters were optimized for variant calling; therefore, some parameters were changed and tested for the optimization. Decreasing false variants was the main purpose of optimization (Supplementary Table S1). The ploidy level is fixed in chickens (2n = 78). Therefore, fixed ploidy algorithm76 was used for variant calling based on following parameters: required variant probability (%) = 95.0, ignore positions with coverage above = 50,000, restrict calling to target regions = not set, ignore broken pairs = yes, ignore non-specific matches = reads, minimum coverage = 10, minimum count = 2, minimum frequency (%) = 30, base quality filter = Yes, neighborhood radius = 15, minimum central quality = 30, minimum neighborhood quality = 25, remove pyro-error variants = yes, in homo-polymer regions with minimum length = 3-with frequency below = 0.872,76.
We used the IDEG6 website for the statistical analysis77. Using Fisher exact test, we analyzed differences in variants distribution. The statistical analysis was carried out for each variant between highland and lowland samples, separately. Also, Chi-square test was established in order to analyze the differential distributed variations between highland and lowland chickens for each chromosome incorporating the sex of birds in the statistical analysis.
Phylogenetic and structural population analysis
Any change in mitochondrial DNA (mtDNA) can be utilized as the phylogenic analysis, because mtDNA are considered as the conserved sequences. A total of 48 SNVs (single nucleotide variations) was identified in mtDNA using CLC Genomic Workbench (8.5.1)71, 480 SNVs were also genotyped (see results part) for ten samples. The phylogenic analysis was carried out based on 480 SNVs genotypes, Nei’s genetic distance matrix, and UPGMA method by PopGene software (version 1.32)78.
The population structural analysis was performed using multiple correspondence analysis (MCA) by R program (version: 3.2.2)79 and the “Ca” package80) in order to classify the highland and lowland chickens. We used the multiple correspondence analyses for qualitative data, while the principal component analysis (PCA) was used for quantitative data. MCA is another tool of multivariate methods that allows the analysis of systematic patterns of variations with categorical data81. 1000 SNVs genotypes were collected randomly from each highland and lowland chickens and a total of 10000 SNVs genotypes was used for MCA analysis.
Differential variants
Comparing variants, filter variants and gene ontology enrichment analysis
After variants calling, variations of highland chickens were compared against the reads of lowland chickens as a control tool in order to remove the common variation between lowland and highland samples. Also, a comparison was carried out between male and female birds of highland and lowland, separately. We considered five frequency threshold percentages (0, 25, 50, 75 and 100) in order to be utilized for the frequency threshold optimization. The threshold frequency is considered as the percentage of samples that have variants. For instance, determining it to 50% indicates that at least 50% of samples, which were selected as the inputs, must contain a given variant in order to be reported in the output.
The differential variants were filtered based on known variants for the identification of novel variants. CDS (coding region) annotation was selected for overlap comparisons in order to understand which variants were located on coding and non-coding regions. Coding variants were collected for functional consequences and amino acid changes analysis. Reference genome, CDS and mRNA annotations were used for the amino acid change analysis. In addition, synonymous variants and CDS regions that had no variants were also filtered. In order to carry out the amino acid change analysis, standard genetic code was selected in CLC genomics82. The file of gene ontology (GO) association, which includes the gene names and associated gene ontology terms, was downloaded from the gene ontology consortium (http://geneontology.org/) and imported to CLC Genomic Workbench (8.5.1)71. The output of amino acid change analysis was utilized for the analyses of gene ontology enrichment of the biological process, molecular function, and cellular component. The significance level of GO analysis was determined to be 0.01.
Signature selection analysis
It should be noted that SSA was carried out in order to confirm the results of differential variant analysis in the current study. Considering descriptions of Weir and Cockerham83, (FST) was calculated for SNVs of each population of highland and lowland chicken’s differentiation and sex chromosomes were removed. Sliding window analyses were carried out with a window size of 100 kb and a step size of 50 kb. Consequently, average FST values of SNVs in each window were calculated; also, the genomic landscape of the population differentiation between highland and lowland chicken was drawn by qqman pakage and R program (version 3.2.2)79.
Windows with the high 5% FST values were retrieved by using the Variant Effect Predictor online tool (http://www.ensembl.org). Also, the process of gene enrichment analysis was carried out by using g: profiler (http://biit.cs.ut.ee/gprofiler/index.cgi,).
Benjamini–Hochberg FDR (false discovery rate) was used in order to correct P values (Ming-Shan et al., Nosrati et al.)84,85. The summary of SSA are depicted in the online Supplementary Fig. S1. Finally, it should be noted that as it was previously described in CLC Genomic Workbench (8.5.1), all parameters of SNV detection existed in the command line tools were determined71.
Common variants discovery between highland and lowland chickens
The detection of common variants, shared between highland and lowland chickens is the main purpose of common variants discovery. See Fig. 12 for more details about common variants detection. 100% was determined for the frequency threshold. In the other words, all differential variants were removed completely, and common variants were kept for further analysis. The process of filtering and gene ontology enrichment analyses was same as what described for differential variants.

The process of common variants detection in highland and lowland native chicken ecotypes. This figure shows that how differential variants were removed between highland and lowland chickens. All comparisons of native chicken ecotype were carried out based on the sex of birds in each step. The frequency threshold was determined to be 100 percent in order to collect common variants between highland and lowland chickens.
mtDNA variants
Ignoring the mtDNA variants in discovery variant projects is very difficult. The analyses of mtDNA variants were carried out separately in this investigation. After variants detection, all mtDNA variants were obtained in highland and lowland chickens, separately. Filtrations and gene ontology enrichments were carried out same as what described for differential variants.
Linking variants to protein structure
Results of gene ontology enrichment analyses were applied for variants visualization. Some variants impact on a protein’s amino acid composition. Therefore, the protein’s three-dimensional structure was downloaded by CLC Genomic Workbench (8.5.1)71 from the protein data bank (www.rcsb.org) in order to show the variants location on the protein structure. Variants visualization was carried out for important differential candidate genes of our investigation’s results, or the ones that have their structures in the protein database structure.
Developing a new approach for genomic variants enrichment analysis
The identification of genomic regions that contained the highest density of differential variant between highland and lowland chickens, including both males and females, is the main purpose of genomic variants enrichment analysis. In this article, we proposed a plan to analyze the genomic variants enrichment based on the following steps. First, we estimated each chromosome’s standard frequencies of differential variants using the division of variants number by the chromosome length (Mb). Second, the chromosome that had the most standard frequency was selected, and the cumulative frequencies graph of variants was drawn along the chromosome by the R program (version 3.2.2)79. Third, chromosome region, which had the most cumulative frequency, was identified and ENSGALT (Ensembl transcript) IDs were also detected by UCSC and Table browser (www.genome.ucsc.edu/cgi-bin/hgTables) and finally, all detected ENSGALT IDs were converted into the ENSGAL gene ID by BioMart (www.ensembl.org/biomart).
Gene network analysis
According to all candidate genes identified in gene ontology enrichment analyses for differential variants, we carried out the gene network analysis. A total of 27 candidate genes was suggested for differential variants analysis among males and females (Tables 7 and 8). In order to build an informative gene network, chicken Ensembl gene identifications were converted into human orthologs72. Based on the following parameters, gene network analysis was carried out by Studio pathway web (Elsevier) for the identification of upstream neighbor networks for diseases: Min overlap = 2, and P value < 0.0586.
Validations
Variants discovery projects produce numerous variations. Thereby, validating the variants is highly required. Here, validations were carried out for two groups of detected variants. First, novel differential SNVs between highland and lowland chickens, and second, mtDNA variations in highland chickens. Thus, the sequencing of other five whole genomes of highland samples (Isfahan) was carried out, separately. The whole genome sequencing, trimming, and variant detection were performed according to the information provided in the material and method sections. A total of 3845 SNVs was reported as new variants for differential variants analyses and 32 variations were also detected in mtDNA for highland samples (see result part). Each SNV’s regions and chromosomes were evaluated in the new five samples by R program in order to validate the variants79. The percentage of validation was calculated based on those samples that had variants.
Data Availability
Produced and analyzed datasets of this study are not publicly available due to the policy of financial sponsor. But datasets are available from the corresponding author on reasonable request. In addition, novel detected SNVs with an accession number of PRJEB24944 are available in EBI.
References
Tixier-Boichard, M., Bed’hom, B. & Rognon, X. Chicken domestication: From archeology to genomics. C R Biol. 334, 197–204 (2011).
Burt, D. W. Chicken genome: current status and future opportunities. Genome Res. 15, 1692–1698 (2005).
Meydan, H., Jang, C. P., Yıldız, M. A. & Weigend, S. Maternal origin of Turkish and Iranian native chickens inferred from mitochondrial DNA D-loop sequences. Asian Austral J Anim Sci. 29, 1547 (2016).
Shahbazi, S., Mirhosseini, S. Z. & Romanov, M. N. Genetic diversity in five Iranian native chicken populations estimated by microsatellite markers. Biochem Genet. 45, 63–75 (2007).
Barba, M., Czosnek, H. & Hadidi, A. Historical perspective, development and applications of next-generation sequencing in plant virology. Viruses. 6, 106–136 (2014).
Yan, Y., Yi, G., Sun, C., Qu, L. & Yang, N. Genome-wide characterization of insertion and deletion variation in chicken using next generation sequencing. PloS One 9, e104652 (2014).
Grocott, M., Montgomery, H. & Vercueil, A. High-altitude physiology and pathophysiology: implications and relevance for intensive care medicine. Crit Care. 11, 203–208 (2007).
De, B. et al. Systems biology approach to study the high altitude adaptation in tibetans. Braz Arch Biol Techn. 56, 53–60 (2013).
Jia, C. et al. Gene Co-Expression Network Analysis Unraveling Transcriptional Regulation of High-Altitude Adaptation of Tibetan Pig. PloS One 11, e0168161 (2016).
Dong, K. et al. Genomic scan reveals loci under altitude adaptation in Tibetan and Dahe pigs. PLoS One 9, e110520 (2014).
Srivastava, S. et al. Association of polymorphisms in angiotensin and aldosterone synthase genes of the renin–angiotensin–aldosterone system with high-altitude pulmonary edema. J. Renin Angiotensin Aldosterone Syst. 13, 155–160 (2012).
Michiels, C. Physiological and pathological responses to hypoxia. Am J Pathol. 164, 1875–1882 (2004).
Takiyama, Y. & Haneda, M. Hypoxia in diabetic kidneys. BioMed Res Int. 2014, https://doi.org/10.1155/2014/837421 (2014).
Stobdan, T., Karar, J. & Pasha, M. Q. High altitude adaptation: genetic perspectives. High Alt Med Biol. 9, 140–147 (2008).
Zhang, Q. et al. Genome resequencing identifies unique adaptations of Tibetan chickens to hypoxia and high-dose ultraviolet radiation in high-altitude environments. Genome Biol Evol. 8, 765–776 (2016).
Zhao, X. et al. High-altitude adaptation of Tibetan chicken from MT-COI and ATP-6 perspective. Mitochondrial DNA. 27, 3280–3288 (2016).
Vasiev, B., Balter, A., Chaplain, M., Glazier, J. A. & Weijer, C. J. Modeling gastrulation in the chick embryo: formation of the primitive streak. PLoS One 5, e10571 (2010).
Takeuchi, T., Watanabe, Y., Takano‐Shimizu, T. & Kondo, S. Roles of jumonji and jumonji family genes in chromatin regulation and development. Dev Dyn. 235, 2449–2459 (2006).
Wilkanowska, A., Mazurowski, A., Mroczkowski, S. & Kokoszyński, D. Prolactin (PRL) and prolactin receptor (PRLR) genes and their role in poultry production traits. Folia biologica. 62, 1–8 (2014).
Hsieh, D. J.-Y. et al. Prolactin protects cardiomyocytes against intermittent hypoxia-induced cell damage by the modulation of signaling pathways related to cardiac hypertrophy and proliferation. Int J Cardiol. 181, 255–266 (2015).
Felgentreff, K. et al. Functional analysis of naturally occurring DCLRE1C mutations and correlation with the clinical phenotype of ARTEMIS deficiency. J Allergy Clin Immunol. 136, 140–150. e7 (2015).
Ebrahimie, E., Ebrahimi, F., Ebrahimi, M., Tomlinson, S. & Petrovski, K. R. Hierarchical pattern recognition in milking parameters predicts mastitis prevalence. Comput Electron Agr. 147, 6–11 (2018).
Sharifi, S. et al. Integration of machine learning and meta-analysis identifies the transcriptomic bio-signature of mastitis disease in cattle. PloS One 13, e0191227 (2018).
Hartmut, M. Cytochrome c oxidase: catalytic cycle and mechanisms of proton pumping-A discussion. Biochem. 38, 15129–15140 (1999).
Sun, J. S., Zhong, H., Chen, S. Y., Yao, Y. G. & Liu, Y. P. Association between MT-CO3 haplotypes and high-altitude adaptation in Tibetan chicken. Gene. 529, 131–137 (2013).
Camus, M. F., Wolf, J. B., Morrow, E. H. & Dowling, D. K. Single Nucleotides in the mtDNA Sequence Modify Mitochondrial Molecular Function and Are Associated with Sex-Specific Effects on Fertility and Aging. Curr Biol. 25, 2717–2722 (2015).
Mossman, J. A., Tross, J. G., Li, N., Wu, Z. & Rand, D. M. Mitochondrial-Nuclear Interactions Mediate Sex-Specific Transcriptional Profiles in Drosophila. Genetics. 204, 613–630 (2016).
Lemarie, A. & Grimm, S. Mitochondrial respiratory chain complexes: apoptosis sensors mutated in cancer? Oncogene. 30, 3985 (2011).
Zhou, F., Yin, Y., Su, T., Yu, L. & Yu, C.-A. Oxygen dependent electron transfer in the cytochrome bc1 complex. Biochimica et Biophysica Acta (BBA)-Bioenergetics. 1817, 2103–2109 (2012).
Liu, L. & Simon, M. C. Regulation of Transcription and Translation by Hypoxia. Cancer Biol Ther. 3, 492–497 (2004).
Koritzinsky, M. & Wouters, B. G. Hypoxia and regulation of messenger RNA translation. Methods Enzymol. 435, 247–273 (2007).
Staudacher, J. J. et al. Hypoxia-induced gene expression results from selective mRNA partitioning to the endoplasmic reticulum. Nucleic Acids Res. 43, 3219–3236 (2015).
Tamagnone, L. et al. BMX, a novel nonreceptor tyrosine kinase gene of the BTK/ITK/TEC/TXK family located in chromosome Xp22. 2. Oncogene 9, 3683–3688 (1994).
Paavonen, K. et al. Bmx tyrosine kinase transgene induces skin hyperplasia, inflammatory angiogenesis, and accelerated wound healing. Mol Biol Cell. 15, 4226–4233 (2004).
McNamee, E. N., Johnson, D. K., Homann, D. & Clambey, E. T. Hypoxia and hypoxia-inducible factors as regulators of T cell development, differentiation, and function. Immunol Res. 55, 58–70 (2013).
Xia, X. et al. Integrative analysis of HIF binding and transactivation reveals its role in maintaining histone methylation homeostasis. Proceedings of the National Academy of Sciences 106, 4260–4265 (2009).
Niu, X. et al. The von Hippel–Lindau tumor suppressor protein regulates gene expression and tumor growth through histone demethylase JARID1C. Oncogene. 31, 776 (2012).
Hancock, R. L., Dunne, K., Walport, L. J., Flashman, E. & Kawamura, A. Epigenetic regulation by histone demethylases in hypoxia. Epigenomics. 7, 791–811 (2015).
Zhang, H. & Burggren, W. Hypoxic level and duration differentially affect embryonic organ system development of the chicken (Gallus gallus). Poult Sci. 91, 3191–3201 (2012).
Mattiesen, W.-R. C. et al. Increased neurogenesis after hypoxic-ischemic encephalopathy in humans is age related. Acta neuropathological. 117, 525–534 (2009).
Patterson, A. J. & Zhang, L. Hypoxia and fetal heart development. Curr Mol Med. 10, 653–666 (2010).
Joiner, D. M., Ke, J., Zhong, Z., Xu, H. E. & Williams, B. O. LRP5 and LRP6 in development and disease. Trends Endocrinol Metab. 24, 31–39 (2013).
Svobodová, A. R. et al. DNA damage after acute exposure of mice skin to physiological doses of UVB and UVA light. Arch Dermatol Res. 304, 407–412 (2012).
Yel, M., Güven, T. & Türker, H. Effects of ultraviolet radiation on the stratum corneum of skin in mole rats. J. Radiat Res Appl. 7, 506–511 (2014).
Zhang, B. et al. A Comprehensive MicroRNA Expression Profile Related to Hypoxia Adaptation in the Tibetan Pig. PloS One 10, e0143260 (2015).
Blick, C. et al. Identification of a hypoxia-regulated miRNA signature in bladder cancer and a role for miR-145 in hypoxia-dependent apoptosis. Brit J Cancer. 113, 634 (2015).
Kulshreshtha, R. et al. A microRNA signature of hypoxia. Mol Cell Biol. 27, 1859–1867 (2007).
Shao, P. et al. Drastic expression change of transposon-derived piRNA-like RNAs and microRNAs in early stages of chicken embryos implies a role in gastrulation. RNA Biol. 9, 212–227 (2012).
Ghatpande, S. K., Billington, C. J., Rivkees, S. A. & Wendler, C. C. Hypoxia induces cardiac malformations via A1 adenosine receptor activation in chicken embryos. Birth Defects Res A Clin Mol Terato. 82, 121–130 (2008).
Lo, K. H., Hui, M. N. Y., Yu, R. M. K., Wu, R. S. S. & Cheng, S. H. Hypoxia impairs primordial germ cell migration in zebrafish (Danio rerio) embryos. PLoS One 6, e24540 (2011).
Chakraborty, C., Hsu, C. H., Wen, Z. H., Lin, C. S. & Agoramoorthy, G. Zebrafish: a complete animal model for in vivo drug discovery and development. Curr Drug Metab. 10, 116–124 (2009).
Burt, D. W. Emergence of the chicken as a model organism: implications for agriculture and biology. Poult Sci. 86, 1460–1471 (2007).
Dodgson, J. B. & Romanov, M. N. Use of chicken models for the analysis of human disease. Curr Protoc Hum Genet. 15.5. 1–15.5. 12 (2004).
Mathieu, A.-L. et al. PRKDC mutations associated with immunodeficiency, granuloma, and autoimmune regulator–dependent autoimmunity. J Allergy Clin Immunol 135, 1578–1588. e5 (2015).
Blunt, T. et al. Identification of a nonsense mutation in the carboxyl-terminal region of DNA-dependent protein kinase catalytic subunit in the scid mouse. Proceedings of the National Academy of Sciences 93, 10285–10290 (1996).
Xie, W., Su, Y.-h, Feng, Q., Qu, L.-k & Shou, C.-C. Inhibitory effects of silencing PES1 gene expression on the malignant phenotypes of colon cancer cells. Tumor. 35, 1175–1184 (2015).
Li, J. et al. Repression of PES1 expression inhibits growth of gastric cancer. Tumor Biol. 37, 3043–3049 (2016).
Brennan, M. & Lim, B. The Actual role of receptors as cancer markers, biochemical and clinical aspects: receptors in breast cancer. Adv Exp Med Biol. 867, 327–337 (2015).
Bar-Shavit, R. et al. G protein-coupled receptors in cancer. Int J Mol Sci. 17, 1320 (2016).
Li, Y., Lu, W., He, X., Schwartz, A. L. & Bu, G. LRP6 expression promotes cancer cell proliferation and tumorigenesis by altering β-catenin subcellular distribution. Oncogene. 23, 9129 (2004).
Liu, C.-C., Prior, J., Piwnica-Worms, D. & Bu, G. LRP6 overexpression defines a class of breast cancer subtype and is a target for therapy. Proceedings of the National Academy of Sciences. 107, 5136–5141 (2010).
Ma, J., Lu, W., Chen, D., Xu, B. & Li, Y. Role of Wnt Co‐Receptor LRP6 in Triple Negative Breast Cancer Cell Migration and Invasion. J Cell Biochem. 118, 2968–2976 (2017).
Tung, E. K.-K., Wong, B. Y.-C., Yau, T.-O. & Ng, I. O.-L. Upregulation of the Wnt co-receptor LRP6 promotes hepatocarcinogenesis and enhances cell invasion. PloS One 7, e36565 (2012).
Calderwood, S. K., Stevenson, M. A. & Murshid, A. Heat Shock Proteins, Autoimmunity, and Cancer Treatment. Autoimmune Dis, https://doi.org/10.1155/2012/486069 (2012).
Lianos, G. D. et al. The role of heat shock proteins in cancer. Cancer letters. 360, 114–118 (2015).
Yang, Z. et al. Upregulation of heat shock proteins (HSPA12A, HSP90B1, HSPA4, HSPA5 and HSPA6) in tumour tissues is associated with poor outcomes from HBV-related early-stage hepatocellular carcinoma. Int J Med Sci. 12, 256–263 (2015).
Wu, J. et al. Heat shock proteins and cancer. Trends Pharmacol Sci. 38, 226–256 (2017).
Rerole, A. L., Jego, G. & Garrido, C. Hsp70: anti-apoptotic and tumorigenic protein. Methods Mol Biol. 787, 205–30 (2011).
Iranpur-Mobarakeh, V. Esmailizadeh, A, K. Rapid Extraction of High Quality DNA from Whole Blood Stored at -4 C for Long Period. Protocol Online, http://www.protocol-online.org (2010).
Minitab 17 Statistical Software [Computer software]. State College, PA: Minitab, Inc., www.minitab.com (2010).
CLC Genomics Workbench 8.5.1, https://www.qiagenbioinformatics.com/.
Doan, R. et al. Whole-genome sequencing and genetic variant analysis of a Quarter Horse mare. BMC genomics. 13, https://doi.org/10.1186/1471-2164-13-78 (2012).
Mortazavi, A., Williams, B. A., McCue, K., Schaeffer, L. & Wold, B. Mapping and quantifying mammalian transcriptomes by RNA-Seq. Nat Methods. 5, 621–628 (2008).
Sims, D., Sudbery, I., Ilott, N. E., Heger, A. & Ponting, C. P. Sequencing depth and coverage: key considerations in genomic analyses. Nat Rev Genet. 15, 121–132 (2014).
Lander, E. S. & Waterman, M. S. Genomic mapping by fingerprinting random clones: a mathematical analysis. Genomics. 2, 231–239 (1988).
Dias, M. et al. SNP detection using RNA-sequences of candidate genes associated with puberty in cattle. Genet Mol Res. 16, https://doi.org/10.4238/gmr16019522 (2017).
Romualdi, C., Bortoluzzi, S., d’Alessi, F. & Danieli, G. A. IDEG6: a web tool for detection of differentially expressed genes in multiple tag sampling experiments. Physiol Genomics. 12, 159–162 (2003).
Yeh, F. C., Yang, R. C., Boyle, T. B., Ye, Z. & Mao, J. X. POPGENE, the user-friendly shareware for population genetic analysis. Molecular biology and biotechnology centre, University of Alberta, Canada 10, 295–301 (1997).
R Core Team R: A language and environment for statistical computing. R Foundation for Statistical Computing, Vienna, Austria. URL, http://www.R-project.org/ (2014).
Nenadic, O. & Greenacre, M. Correspondence analysis in R, with two-and three-dimensional graphics: The ca package. J Stat Softw. 20, https://doi.org/10.18637/jss.v020.i03 (2007).
Abdi, H. &Valentin, D. Multiple correspondence analysis. Encyclopedia of measurement and statistics, 651–657 (2007).
Comparative analysis of three bovine genomes, www.qiagenbioinformatics.com/support/tutorials (2017).
Weir, B. S. & Cockerham, C. C. Estimating F-Statistics for the Analysis of Population Structure. Evolution. 38, 1358–1370 (1984).
Ming-Shan, W. et al. Genomic Analyses Reveal Potential Independent Adaptation to High Altitude in Tibetan Chickens. Mol Biol Evol. 32, 1880–1889 (2015).
Nosrati, M., Asadollahpour Nanaei, H., Amiri Ghanatsaman, Z., Esmailizadeh, A. Whole genome sequence analysis to detect signatures of positive selection for high fecundity in sheep. Reprod Dom Anim, https://doi.org/10.1111/rda.13368 (2018).
Pashaiasl, M., Ebrahimi, M. & Ebrahimie, E. Identification of the key regulating genes of diminished ovarian reserve (DOR) by network and gene ontology analysis. Mol Biol Rep. 43, 923–937 (2016).
Acknowledgements
This project was supported financially by Kunming Institute of Zoology in China. The authors are thankful to Chinese colleagues for providing the raw NGS data. This research was supported by use of the Nectar Research Cloud, a collaborative Australian research platform supported by the National Collaborative Research Infrastructure Strategy (NCRIS). Additionally, authors appreciate A. Dorafshan, M. Dorafshan, H. Dorafshan, M.R Jabbari, B. Kharrati, K. Dehbandi, B. Nazari, E. Fouladi, A. Kohan-rooz and specially Dr. R. Dehbandi for their supporting in sampling procedure. We would like to thank Dr. Hojjat Asadollahpour Nanaei because of his guidance in analyzing the data.
Author information
Authors and Affiliations
Contributions
H.K.K., M.D. and A.E. conceived the study. H.K.K. collected the samples, performed the experiments, and prepared the manuscript. H.K.K., E.E. and A.N. contributed in data analyses. A.E. prepared the NGS data. All authors read and approved the final manuscript.
Corresponding authors
Ethics declarations
Competing Interests
The authors declare no competing interests.
Additional information
Publisher’s note: Springer Nature remains neutral with regard to jurisdictional claims in published maps and institutional affiliations.
Rights and permissions
Open Access This article is licensed under a Creative Commons Attribution 4.0 International License, which permits use, sharing, adaptation, distribution and reproduction in any medium or format, as long as you give appropriate credit to the original author(s) and the source, provide a link to the Creative Commons license, and indicate if changes were made. The images or other third party material in this article are included in the article’s Creative Commons license, unless indicated otherwise in a credit line to the material. If material is not included in the article’s Creative Commons license and your intended use is not permitted by statutory regulation or exceeds the permitted use, you will need to obtain permission directly from the copyright holder. To view a copy of this license, visit http://creativecommons.org/licenses/by/4.0/.
About this article

Cite this article
Kharrati-Koopaee, H., Ebrahimie, E., Dadpasand, M. et al. Genomic analysis reveals variant association with high altitude adaptation in native chickens. Sci Rep 9, 9224 (2019). https://doi.org/10.1038/s41598-019-45661-7
Received:
Accepted:
Published:
DOI: https://doi.org/10.1038/s41598-019-45661-7
This article is cited by
-
Novel genetic variants data for adaptation to hypoxia in native chickens
BMC Research Notes (2023)
-
Transcriptome resequencing data for rock pigeon (Columba livia)
BMC Research Notes (2022)
-
Genetic diversity and signatures of selection for heat tolerance and immune response in Iranian native chickens
BMC Genomics (2022)
-
Comparative analysis of long noncoding RNA and mRNA expression provides insights into adaptation to hypoxia in Tibetan sheep
Scientific Reports (2022)
-
Gene network analysis to determine the effect of hypoxia-associated genes on brain damages and tumorigenesis using an avian model
Journal of Genetic Engineering and Biotechnology (2021)
Comments
By submitting a comment you agree to abide by our Terms and Community Guidelines. If you find something abusive or that does not comply with our terms or guidelines please flag it as inappropriate.
